


Risk/Reward Ratio Calculator: A Practical Guide for Traders
Have you ever had a brilliant trading idea, watched it play out perfectly, and still somehow ended up with a shrinking account balance? It’s a frustratingly common story. The problem isn't your chart analysis or your entry signal; it’s a critical piece of the professional trading puzzle that most amateurs completely overlook.
This missing link is the risk/reward ratio, and it's the absolute bedrock of any sustainable trading career.
Why Most Trading Strategies Fail Without This Ratio
So many traders I've seen over the years are obsessed with one thing: finding the perfect entry. They spend countless hours hunting for setups with a high win rate, thinking that's the only way to make money. But then a couple of bad trades come along and completely demolish weeks of their hard-won profits.
This painful cycle happens because they're ignoring the simple math that governs trading success. It’s not just about how often you win. It's about how much you make when you're right compared to how much you lose when you're wrong.
This is where the risk/reward ratio comes in and changes the game entirely. It’s a simple calculation that measures your potential profit on a trade against your potential loss. You stop gambling and start making calculated business decisions. By using a risk/reward ratio calculator, you turn wishy-washy market predictions into cold, hard numbers, forcing you to ask the most important question: is this trade actually worth the risk?
The Foundation of Profitability
Getting a handle on this ratio is the first real step you'll take toward becoming a consistently profitable trader. It gives you a logical framework that strips emotion out of your trading and puts you back in control. Here’s what it really does for you:
- It Defines Your Edge: You finally see the mathematical advantage you need to be profitable over the long run.
- It Enforces Discipline: No more jumping into low-quality trades where the potential payout is tiny compared to what you're risking.
- It Protects Your Capital: It's your best defense against one or two losing trades blowing a massive hole in your account.
The entire point of the risk/reward ratio is to make sure your winning trades are big enough to more than cover your inevitable losses. Without it, you could have a 70% win rate and still lose money if your losses are just too big.
This single principle is why a trader who only wins 40% of their trades can be wildly profitable, while someone else winning 60% of the time can be stuck in a losing cycle. Grasping this concept is what separates the pros from the rest. In the next sections, I'll show you exactly how to calculate it and, more importantly, how to apply it to your own trading.
To give you a quick reference, here's a simple table that shows how different ratios impact the win rate you need just to break even.
Risk Reward Ratios at a Glance
| Risk Reward Ratio | Meaning | Breakeven Win Rate Required |
|---|---|---|
| 1:1 | You risk $1 to make $1 | 50% |
| 1:2 | You risk $1 to make $2 | 33.3% |
| 1:3 | You risk $1 to make $3 | 25% |
| 1:5 | You risk $1 to make $5 | 16.7% |
| 2:1 | You risk $2 to make $1 | 66.7% |
As you can see, the higher your potential reward is relative to your risk, the fewer trades you actually need to win to stay profitable. This is the mathematical edge that professionals build their entire careers on.
How to Calculate Your Risk to Reward Ratio
Calculating your risk/reward ratio is a surprisingly simple bit of math, but it's the engine that drives professional trading.
It all boils down to defining three specific prices before you ever click the buy or sell button. Forget vague percentages for a moment; this is about pinning down concrete levels on your chart that decide whether a trade is even worth taking.
The whole process starts with you identifying your entry point, your stop-loss, and your profit target. These aren't just random numbers plucked from thin air. They should be anchored to real market structure—think key support and resistance zones, trendlines, or specific price action signals you've identified. The discipline you bring to setting these levels is what separates a calculated risk from a pure gamble.
The Three Critical Prices
To figure out your ratio, you first need to quantify your potential risk and your potential reward in dollars and cents (or pips). You get there by measuring the distance between those critical price points you just identified.
- Potential Risk: This is the space between your Entry Price and your Stop-Loss Price. It's the maximum you're willing to lose if the trade goes south.
- Potential Reward: This is the distance from your Entry Price up to your Take-Profit Price. It represents the total profit you're aiming for if the trade plays out as planned.
The formula itself is straightforward:
Risk/Reward Ratio = (Entry Price – Stop-Loss Price) / (Take-Profit Price – Entry Price)
A Real-World Apple Stock Example
Let's walk through this with a real example. Imagine you're looking at a chart for Apple (AAPL) and you've spotted a solid support level at $165. You decide this is a good spot to buy, anticipating a bounce.
- Entry Price: You get into the trade at $165.
- Stop-Loss: To protect your capital, you place your stop-loss just below a recent swing low, setting it at $160.
- Take-Profit Target: You've identified the next major resistance level as your target, so you place your take-profit order at $180.
Now, we just plug these numbers into the formula.
- Your Risk: $165 (Entry) – $160 (Stop-Loss) = $5 per share
- Your Reward: $180 (Target) – $165 (Entry) = $15 per share
- The Ratio: $5 / $15 = 1/3, which gives you a 1:3 risk/reward ratio.
What this means is that for every $1 you are risking on this trade, you stand to make $3 in profit. This is the kind of favorable asymmetry that professional traders hunt for day in and day out. It's also worth noting that tools like an expected value calculator can help you quantify these potential outcomes over the long term, which is a key part of thinking like a pro.
This is where things get really interesting. Take a look at the image below—it shows exactly how different ratios impact the breakeven win rate you need to stay in the game.
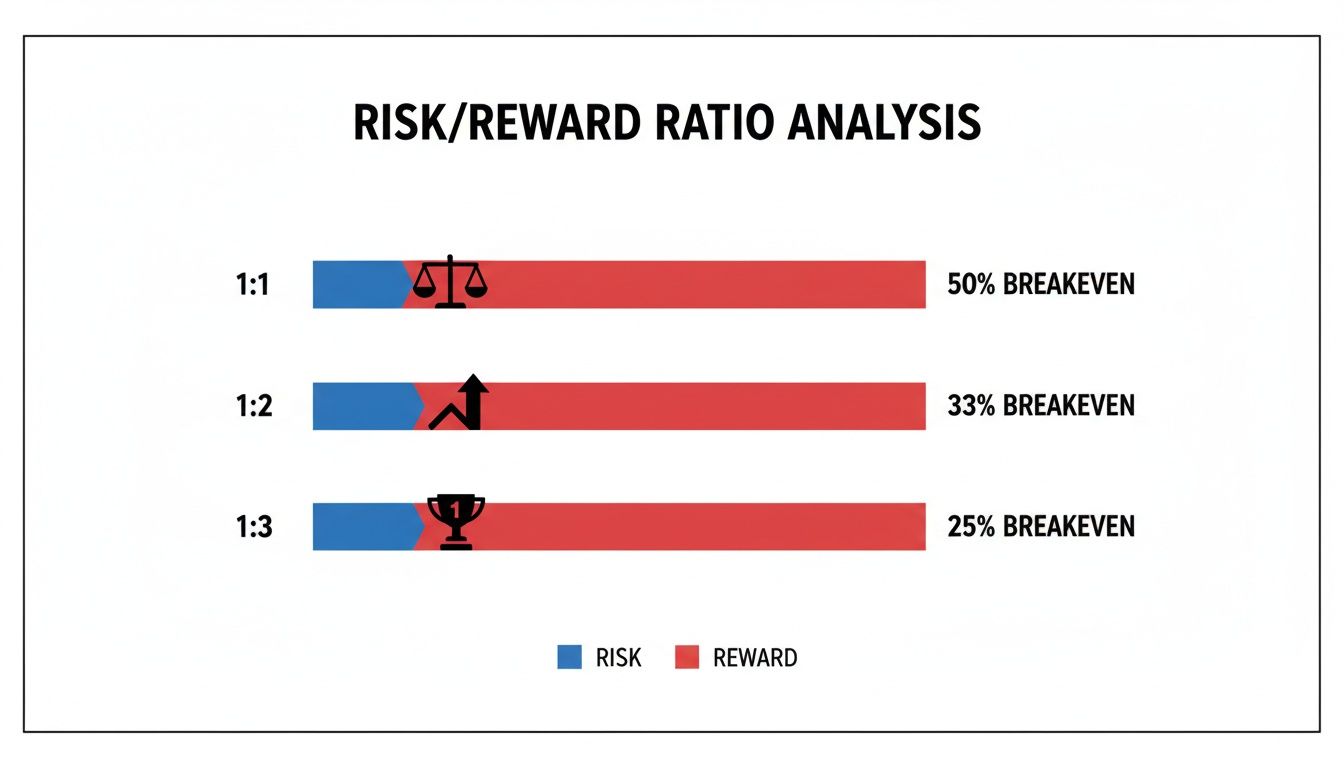
As you can see, a 1:3 ratio lets a trader break even with just a 25% win rate. That's a massive statistical edge. It's why so many traders can be wrong more often than they are right and still come out profitable at the end of the year. This is also why so many retail traders blow up their accounts—they often take trades with terrible risk/reward profiles, like risking $3 to make $1, which requires an incredibly high win rate to survive.
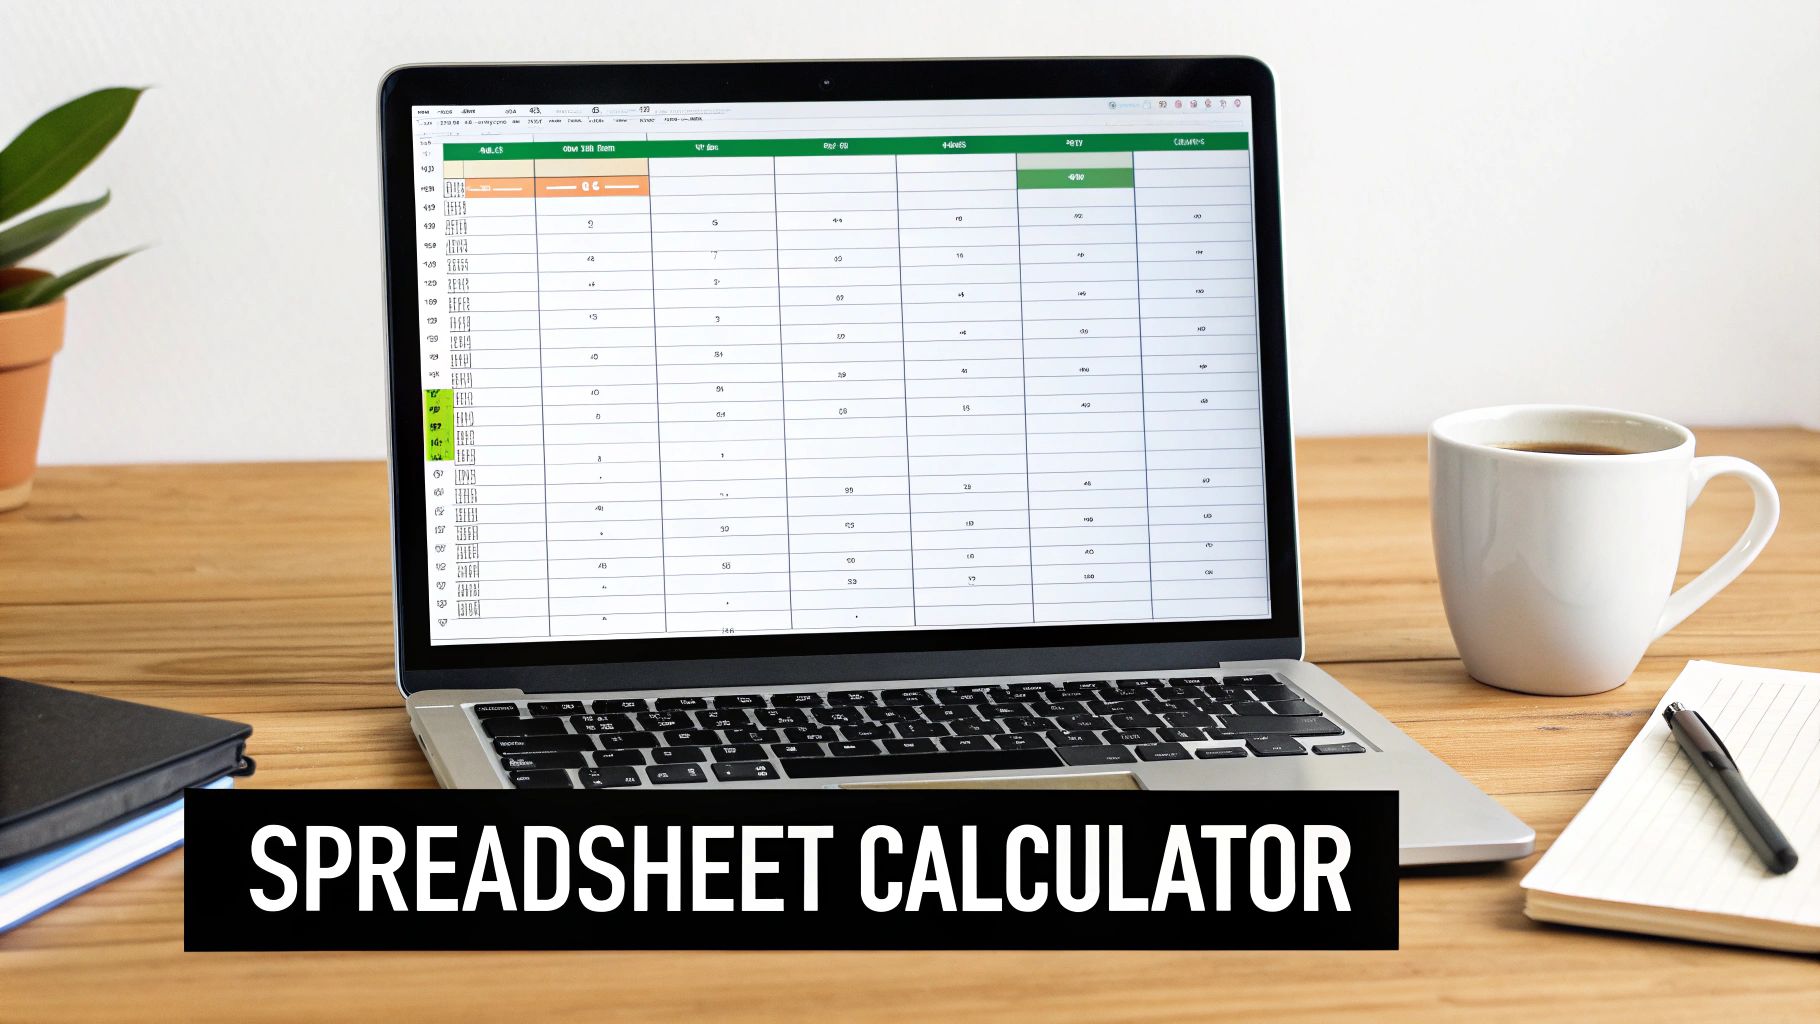
Building Your Own Simple Ratio Calculator in a Spreadsheet
Sure, there are plenty of web-based tools out there, but building your own risk/reward ratio calculator in a spreadsheet like Google Sheets or Excel is a game-changer. It gives you complete control and, more importantly, a much deeper understanding of the mechanics behind each trade.
Doing this transforms risk management from an abstract idea into a practical, repeatable process. The goal is to create a simple dashboard. You plug in your three critical numbers—entry, stop-loss, and target—and let the formulas do the heavy lifting for you. This isn't just about saving time; it's about building discipline.
Setting Up Your Spreadsheet
First things first, open a blank sheet and lay out the columns for your essential data. Keeping the structure clean and organized is key. This simple setup can even form the foundation of a more powerful trading journal down the line.
If you're interested in building out a more detailed system, our guide on creating a trading journal in Excel is an excellent next step.
For now, here are the basic columns you'll need:
- Asset: The stock, forex pair, or crypto you're trading (e.g., AAPL, EUR/USD).
- Entry Price: The price where you plan to open your position.
- Stop-Loss Price: Your predetermined exit price if the trade moves against you.
- Target Price: Your profit target where you'll close the trade.
These first four columns are all you'll need to fill in manually. The next few will be powered by formulas to do the calculations for you automatically.
Adding the Core Formulas
Now, let's bring this calculator to life. We'll add three more columns: Risk per Share, Reward per Share, and the all-important Risk/Reward Ratio.
Let's assume your data starts in row 2.
- Risk Per Share (Column E): For a long trade, the formula is
=B2-C2. For a short trade, it's=C2-B2. You can even automate this with an IF statement:=IF(D2>B2, B2-C2, C2-B2). - Reward Per Share (Column F): For a long trade, this is
=D2-B2. For a short, it's=B2-D2. The automated formula is:=IF(D2>B2, D2-B2, B2-D2).
The most crucial formula is for the ratio itself. It tells you exactly how much potential reward you're getting for each unit of risk. This final number is your go/no-go signal for the trade.
The last step is the ratio calculation. In your Risk/Reward Ratio (Column G), the formula is simply =E2/F2. You can format this cell to display as a clean ratio (e.g., using a formula like "1:" & ROUND(F2/E2,2)) or just as a simple decimal.
As you build your own tools, it's helpful to get comfortable with different number formats. Sometimes a dedicated tool like a fraction to decimal calculator can come in handy for quick conversions.
With those simple formulas in place, your homemade risk/reward ratio calculator is good to go. Every time you analyze a potential trade, you can plug in the numbers and get an instant, objective measure of whether it's worth taking.
Putting the Calculator to Work with Real Trade Examples
Theory is one thing, but seeing how a risk/reward ratio calculator performs in the heat of a live market is where its true value really sinks in. Let's move beyond the formulas and apply this tool to a few trading scenarios you’re likely to face. These examples will show you not just how to calculate the ratio, but why it's a non-negotiable part of my trading routine.
We'll start with a classic swing trade setup, then look at a faster-paced day trade, and finish with a trade that should be avoided at all costs. Each scenario highlights how the ratio enforces the discipline needed for long-term survival in these markets.
Example 1: The EUR/USD Swing Trade
Swing trading in the forex market often serves up some excellent opportunities for high-quality risk/reward setups. Imagine you're analyzing the EUR/USD pair and notice price is approaching a well-defined demand zone around 1.0700, an area where buying pressure has previously stepped in.
Your plan is to go long, anticipating a bounce from this level.
- Entry Price: You set a limit order to buy at 1.0710.
- Stop-Loss: To protect your capital, your stop is placed just below the demand zone at 1.0660. This gives the trade a bit of breathing room.
- Target Price: You identify a clear supply zone, where sellers have previously dominated, up at 1.0860.
Now, let’s run these numbers through the calculator.
- Risk: 1.0710 (Entry) – 1.0660 (Stop) = 50 pips
- Reward: 1.0860 (Target) – 1.0710 (Entry) = 150 pips
- Ratio Calculation: 150 pips / 50 pips = 3. This gives you a clean 1:3 risk/reward ratio.
This is a textbook example of a high-quality trade. For every pip you're risking, you stand to gain three. This favourable asymmetry is exactly what professional traders hunt for.
Example 2: A Volatile Stock Day Trade
Day trading is a different beast entirely. The timeframes are shorter, and the targets are often much closer. Let's say you're watching a volatile tech stock, XYZ, which just broke out above a key resistance level at $150. You decide to buy the retest of this level, expecting it to now act as support.
Your day trading plan looks like this:
- Entry Price: You enter the trade at $150.50 as price confirms the level as new support.
- Stop-Loss: A tight stop-loss is placed just below the breakout level at $149.50.
- Target Price: Your target is the next minor resistance area at $152.50.
Let's do the math for this quick scalp.
- Risk: $150.50 (Entry) – $149.50 (Stop) = $1.00 per share
- Reward: $152.50 (Target) – $150.50 (Entry) = $2.00 per share
- Ratio Calculation: This works out to a solid 1:2 risk/reward ratio.
While not as high as the swing trade, a 1:2 ratio is excellent for day trading, where the goal is to capture smaller, quicker moves and compound them.
It's crucial to remember that your risk/reward ratio works hand-in-hand with your position sizing. A trade with a $1 risk per share still needs the correct share count to ensure the total dollar risk aligns with your overall account risk rules. You can explore this further with our detailed guide on using a position size calculator.
Example 3: The Cautionary Tale
Finally, let's look at a trade you should always, always reject. Imagine a stock has been in a strong downtrend and is now consolidating in a tight range. You feel that classic urge to "catch the bottom," but the chart offers no clear support.
You decide to buy at $50, but the nearest logical stop-loss is way down at $45. To make matters worse, the closest resistance—your only logical target—is at $52.50. The math on this is a recipe for disaster.
- Risk: $50 (Entry) – $45 (Stop) = $5.00
- Reward: $52.50 (Target) – $50 (Entry) = $2.50
- Ratio Calculation: This gives you a 2:1 risk/reward ratio, meaning you are risking $2 to make just $1.
This is what we call a low-quality, high-risk setup. The potential reward simply does not justify the risk involved. Running the numbers through a risk/reward calculator instantly reveals this fatal flaw, saving you from what is, statistically, a losing trade.
Integrating the Ratio into Your Trading Plan
Knowing how to use a risk/reward ratio calculator is a great first step, but it’s just data. The real magic happens when you weave this data into the fabric of your trading plan. It's how you turn a simple tool into a proactive rulebook that guides every single decision you make in the market. This is the bridge between calculation and consistent, disciplined execution.
The first, most crucial step is to define a non-negotiable minimum ratio for any trade you even consider taking. For many of us who trade price action, a common baseline is 1:2. This means you simply don't risk your capital unless the potential reward is at least twice the potential risk.
Think about it: this one simple filter instantly eliminates a huge number of low-quality, emotionally-driven trade ideas before they can ever harm your account.
Making the Ratio Actionable
Once you have your minimum standard, the calculator becomes your gatekeeper. Before you even think about hitting the "buy" or "sell" button, you run the numbers. If a potential setup doesn't meet your minimum 1:2 threshold, you walk away. No exceptions, no "what ifs."
This strict, rule-based approach has a profound psychological benefit. It forces you to hunt for A-grade setups and stops you from chasing mediocre price movements where the odds are mathematically stacked against you. It's the foundation of a professional mindset. For more on building these kinds of rules, check out our guide to creating a comprehensive trading plan template.
Adjusting Your Position Size
Next up is connecting the ratio directly to your money management. Your calculated risk—the dollar amount between your entry and your stop-loss—is what should inform your position size.
Let's say a trade on a volatile stock requires a wider stop. Your calculator will show a larger "risk per share." To keep your total dollar risk constant (for example, 1% of your account), you must take a smaller position.
On the other hand, a trade with a very tight stop allows for a much larger position size for that same 1% dollar risk. This dynamic adjustment, guided by the calculator, is what ensures no single trade can ever inflict catastrophic damage on your account.
A lot of new traders make the critical mistake of chasing high-reward ratios without understanding the statistical reality. Under random market conditions, a 1:1 ratio requires a 50% win rate just to break even. A 3:1 ratio drops that requirement to 25%, but such setups are far less common. A staggering 95% of losing retail traders misjudge this balance, as detailed in various trading analyses. You can explore the math behind this common pitfall on TradingView.
Tracking and Optimizing Performance
Finally, your risk/reward calculator should be a vital part of your trading journal.
By logging the proposed ratio for every trade you take, you can start to gather powerful data on your own performance. After 50 or 100 trades, you'll be able to analyze which ratios perform best with your specific strategy. You might discover that your edge truly shines on 1:3 setups but completely fades on anything less than 1:2. This feedback loop is how the calculator evolves from a simple tool into the cornerstone of a refined and profitable trading system.
Common Questions About Risk Reward Ratios
Once you get the hang of the risk/reward ratio calculator, you'll find that real-world trading throws up some practical questions. It's one thing to understand the numbers, but it's another to integrate this tool into your daily trading routine. Let’s tackle some of the most common questions I hear from traders.
My goal here is to clear up any confusion so you can use the ratio with confidence. These are the kinds of questions that pop up after you've taken a few trades and start to see how the theory actually plays out in the live market.
What Is a Good Risk Reward Ratio for Beginners?
If you're just starting out, here’s a rule of thumb that will serve you well: never accept a trade with a risk/reward ratio below 1:2. Think of this as a non-negotiable filter. It's one of the best habits you can build from day one.
Why? This simple rule forces you to be selective. It prevents you from falling into the classic beginner trap of risking a big slice of your account for a tiny potential profit. When you only target setups where the potential reward is at least double your risk, you build a powerful statistical cushion for yourself.
As you gain more screen time, you’ll get better at spotting higher-quality setups. From there, you can start aiming for ratios of 1:3 or even higher. This gives you a massive edge, allowing you to be profitable even if you win less than a third of your trades.
This is the kind of discipline that separates traders who make it from those who wash out. It shifts your mindset from just winning trades to making sure your wins are big enough to matter.
Can I Use This Calculator for Crypto and Forex?
Yes, absolutely. The beauty of the risk/reward ratio is that it’s universal. It's a market-agnostic principle that works just as well for forex, crypto, stocks, or commodities. It's based entirely on price levels, not the asset you're trading.
The key is to adjust your inputs—your stop-loss and take-profit—to the unique personality of the market you're trading.
- Cryptocurrencies: Crypto is known for wild swings, so you'll often need to use a wider stop-loss to avoid getting shaken out by random noise.
- Major Forex Pairs: An instrument like the EUR/USD is usually less volatile, which often allows for tighter stops and more precise targets.
The calculation itself doesn't change. What changes is the price action context you use to define your risk and reward.
How Does My Win Rate Affect My Risk Reward Strategy?
Win rate and risk/reward are two sides of the same coin. You simply can't look at one without considering the other. They are locked together, and finding the right balance between them is at the very heart of a profitable trading plan.
Think about it. A high risk/reward ratio, like 1:5, means you can be profitable with a very low win rate. One big winner can easily wipe out a string of small losses. On the other hand, a strategy with a high win rate (say, 70%) can be profitable even with a poor ratio below 1:1, where you're risking more than you stand to gain.
The trap many traders fall into is chasing those huge R/R setups without a strategy that actually produces them, which just leads to a long, frustrating series of losses. Your trading plan only works when your strategy's average win rate, combined with your minimum acceptable risk/reward, results in a positive expectancy.
Ready to stop gambling and start trading like a business? The price action strategies taught at Colibri Trader are built on a foundation of sound risk management. Discover how to find high-probability setups that offer the favorable risk/reward ratios you need for long-term success. Learn more and take your trading to the next level at https://www.colibritrader.com.