


The Inverted Cup And Handle Trading Strategy Guide
How many of you have heard about the inverted cup and handle pattern?
Technical setups, when appropriately used, can be a powerful tool to generate profits in financial markets.
There’s nothing mystic around technical analysis (TA) – the chart patterns repeat due to the same psychological tendencies that people have had.
One of the oldest classic TA formations is cup and handle, from which the inverted version is derived.
In 1988 An American trader, William O’Neil, described the pattern in his book “How to Make Money in Stocks“. Since then, the setup hasn’t lost popularity as traders and investors across all assets use the inverted cup and handle to ride trends.
The cup and handle is an excellent tool to build a trading strategy around, providing clear structure rules, measurable risk, and reward. We’ll dive into the details of how to spot the inverted cup and handle and take advantage of it.
Contents in this article
Where Does The Inverted Cup And Handle Originate From?
First, let’s define the original cup and handle setup to understand the inverted version better.
Cup and handle appears in an uptrend, serving as a trend continuation pattern, coming back to the significant high after a correction.
As evident from the name, the formation consists of the cup and the handle. The classic cup is a massive rounded, U-shaped bottom, while the handle is a minor pullback (see the illustration below).
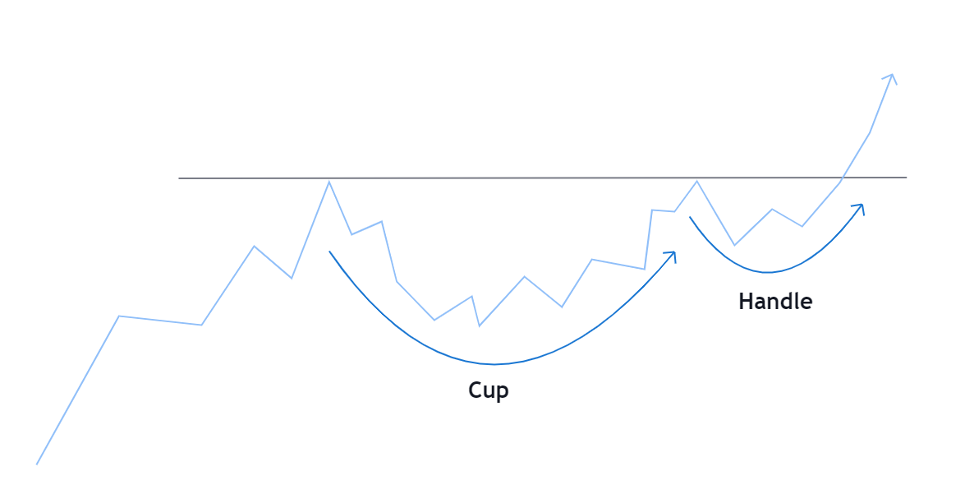
The early trigger to buy comes up when the market breaks out from the pullback structure.
The main signal appears when prices get above the cup’s highs – the whole pattern’s upper border. A common way to set a stop loss is hiding the order below the handle’s low.
Traders use the height of the cup added to the upper boundary of the setup to determine a target.
Here is an example:
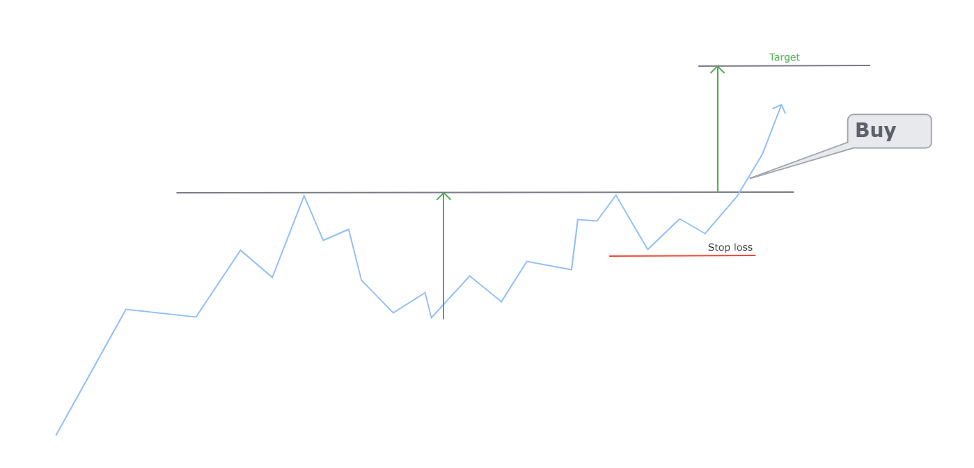
The illustration above portrays a common entry, stop loss, and the target for trading cup and handle pattern.
Not too complicated, right?
Inverted Cup And Handle In-Details
The inverted cup and handle pattern is an opposite of the classic setup. Traders use this pattern to catch a downtrend continuation.
After the downtrend starts to retrace, the setup forms in two parts – the cup and the handle.
We can go short at the breakout of the handle’s structure with a protective stop above the handle’s high. The target can be estimated if we subtract the cup’s height from the entire pattern’s lows.
Check out this example:
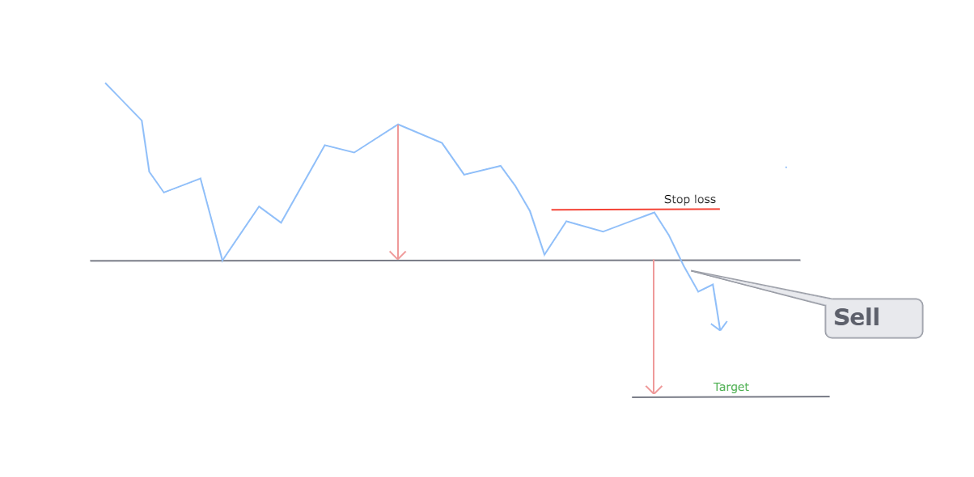
Above, you can see a brief illustration of the inverted cup and handle pattern and a common trade tactic.
Looks quite straightforward, doesn’t it?
Remember: The hardest part of mastering the setup is the selection process.
It takes an effort to find the pattern, where all of its parts match strict criteria – there are quite a few! Below we’ll look closer at each stage of the inverted cup and handle.
We will go over the setup and the trading process.
Note: The lowest time frame we will use for any assessments of the setup is daily.
Trading The Inverted Cup And Handle In A Downtrend
The inverted cup and handle forms in a downtrend – when the market keeps making new lower lows and lower highs.
Here is an example of a steady downtrend:
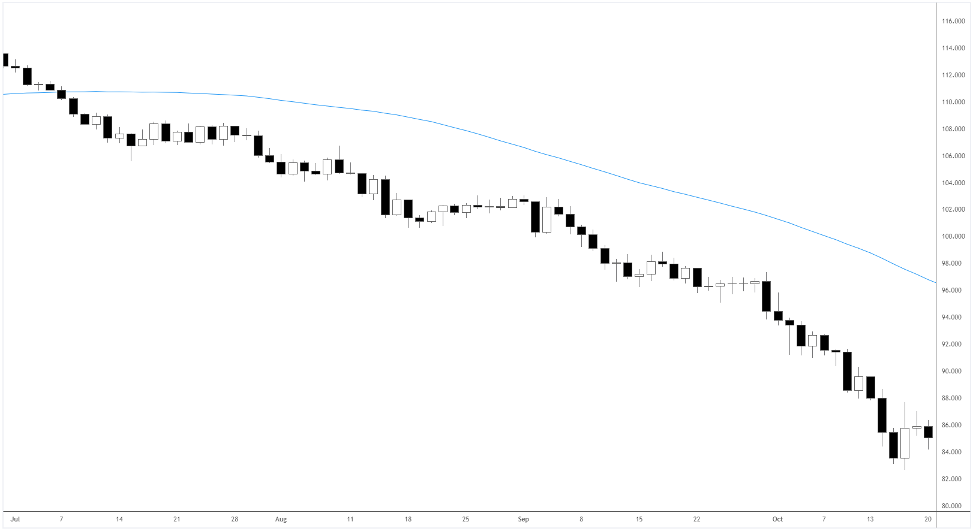
Sometimes the downtrends are so steep that you can’t find any obvious highs.
Quick check: If prices start in the upper left corner of your screen and finish in the bottom right one, it’s surely a downtrend!
Make sure the downtrend is of the same time frame in which you’re looking for the inverted cup and handle.
Pro Tip: Moving Averages can help you to confirm the trend direction if you think your eyes might be lying to you.
In the daily chart above, the down-sloping 50-day MA (the blue line) confirms the downtrend.
Cup
After the downtrend made a significant low, the subsequent retracement forms the cup. Ideally, the cup should retrace not more than half of the proceeding down move.
The typical length of the cup is from 1 to 6 months (based on a daily chart). There are two general variations of the cup’s shape:
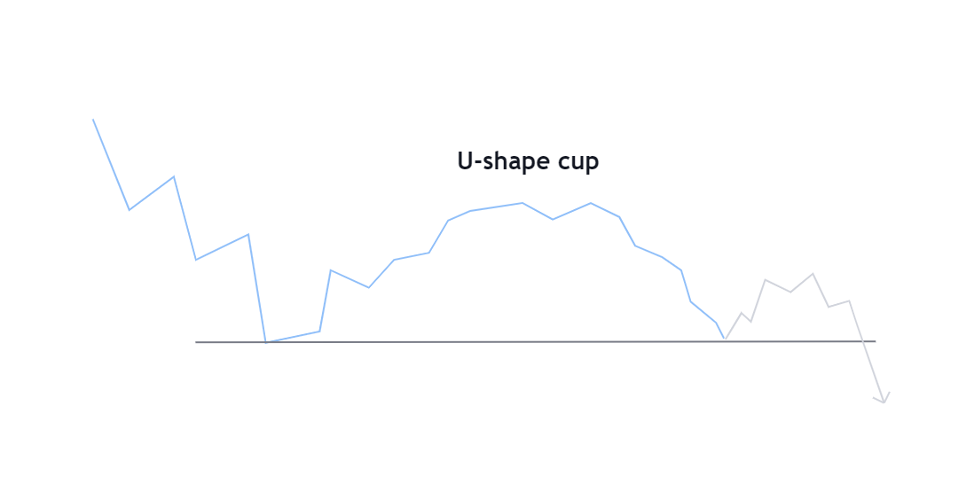
1. U-shape cup: as the market retraces, the decline’s speed cools off, forming a gradual correction curve.
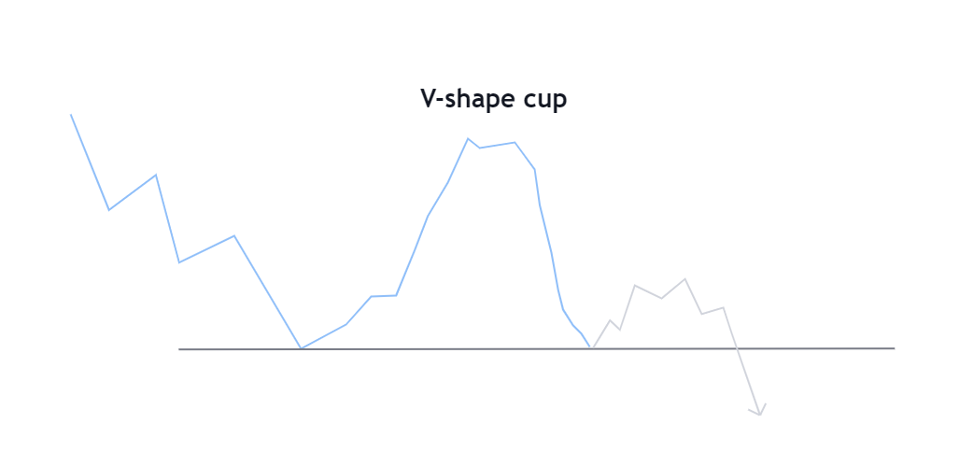
2. V-shape cup: the prices aggressively correct and quickly recover, making the sharp bottom.
Pay attention to the volume as prices form the cup.
Volume Tip: When the market recovers, the volume should decrease, and every time selling pressure comes back, the volume increases.
The top of the cup and the pattern’s ultimate downward breakout should contain the biggest volume spikes.
Handle
The second part of the inverted cup and handle is the “handle”, a pullback that can come in various forms. The form of the handle can be a rectangular, flag-like, descending channel, etc.
Pro Tip: The less deep the handle, the higher the odds of a powerful breakout downwards.
A good handle shouldn’t exceed half of the cup.
The image below shows the handle’s properties within the inverted cup and handle.
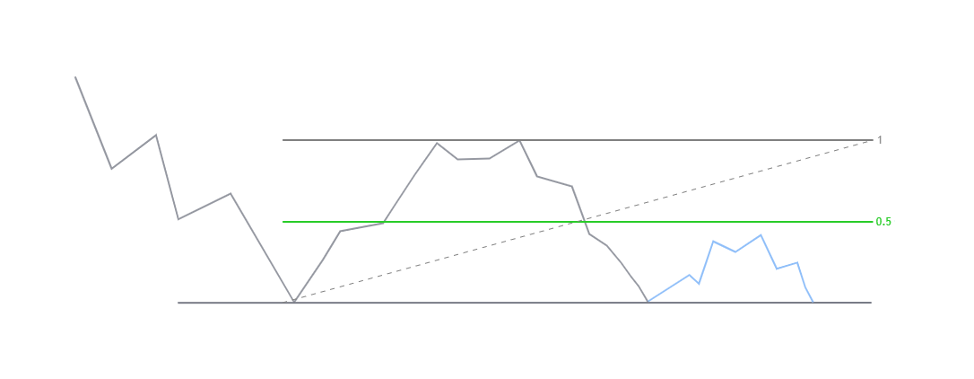
The optimal duration of the handle’s completion is one month (based on a daily timeframe).
What if it takes longer?
If the handle takes significantly longer to form than a month, there might be too much buying pressure. Eventually, buyers may invalidate the pattern, not letting the breakout from the lower boundary develop.
Cup And Handle Breakouts And Trade Management
The first trigger to enter a short-sell trade is the breakout of the handle.
Remember: We set the protective stop above the handle’s high (see the Stop loss A).
Note that handle breakout (see sell #1) might not get the price below the overall pattern yet.
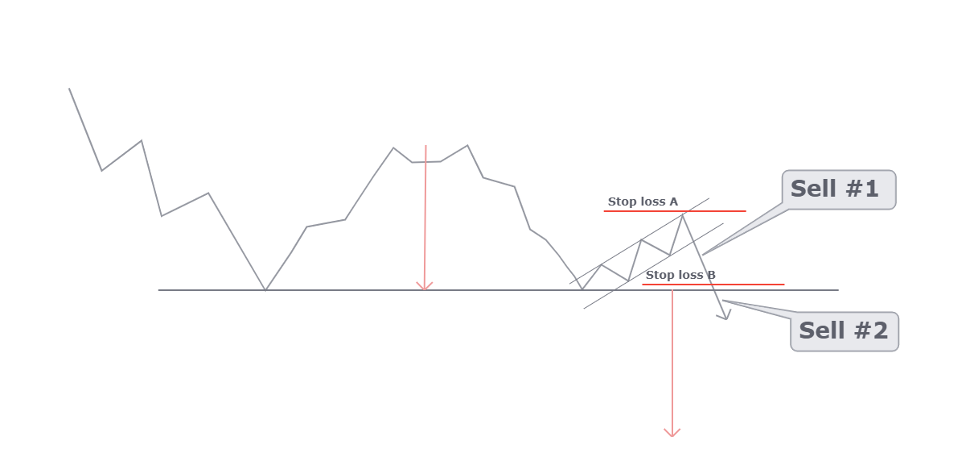
The final sell-entry (see sell #2) would be at the breakout of the cup’s lows, as seen in the chart above. You may also set a stop loss right above the down boundary (see the Stop loss B) of the inverted cup and handle.
Pro Tip: The stop can be for the entire or a part (if entering at the handle’s breakout) of your position.
Live Examples Of Inverted Cup And Handle
The classic cup and handle is a common occurrence in bullish markets. However, due to the distinct nature of bear markets, the inverted cup and handle pattern is rather challenging to find.
Why are bearish markets so different?
Usually, when assets grow, the prices increase more gradually compared to the declining markets. Such a price behaviour is due to panic selling, driven by fear of losses.
Considering that the inverted cup and handle needs a significant time to form, the rapid selloffs don’t give much room for the pattern to appear. We can still find the setup during major bear markets that usually results from fundamental shifts in the economy.
Let’s look at a few examples below.
Commodities bear market: sugar
The commodities markets declined during 2014-2015 due to the multiple factors that affected supply and demand.
Sugar also got hit by the bear market, producing meaningful corrections during the downtrend. The daily chart below shows the inverted cup and handle that has formed for over two months, culminating in a breakout.
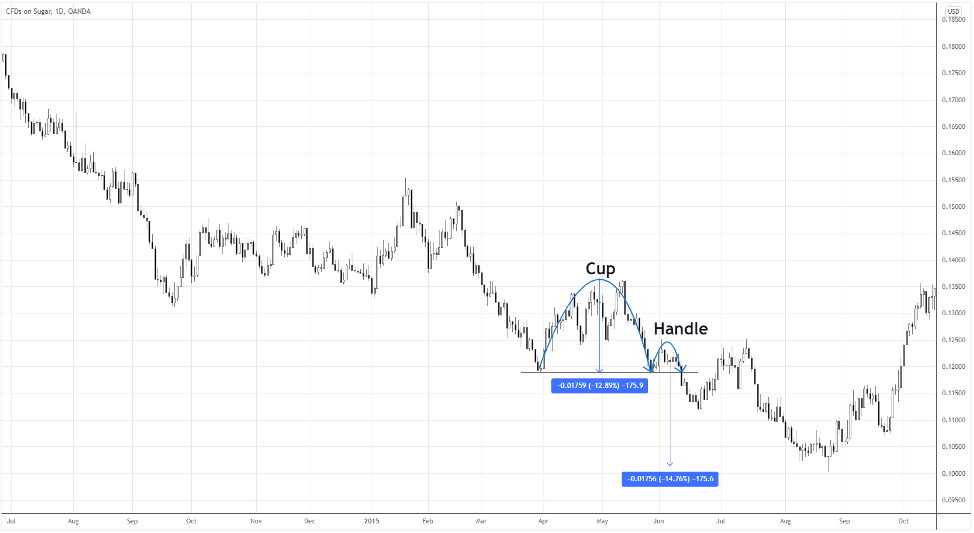
Suppose you entered at the pattern’s breakout and set your stop loss above the handle’s high. In that case, you would likely withstand a pullback that touched the handle’s top at 0.125.
Afterward, the market went straight to the target, which eventually turned out to be the bottom of the downtrend.
Look into the context: Brent Crude Oil
In the unfortunate for commodities 2015 cycle, oil formed an impressive, ten-month long inverted cup and handle.
The hard part, though, is the handle’s shape.
In the chart below, the main down boundary of the pattern is $46.00. However, the swing that signified the end of a cup and the beginning of the handle pierced the level, touching $42.00.
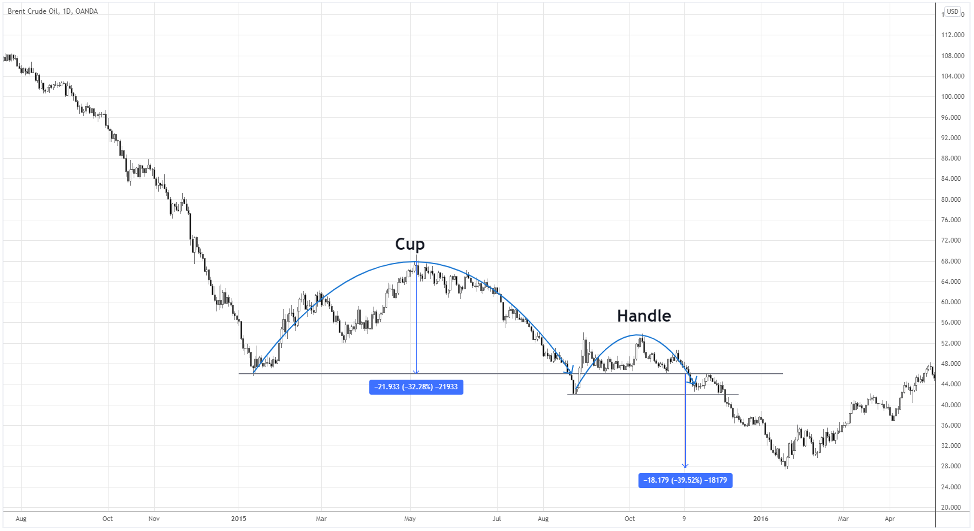
We could still enter at the breakout of $46.00 as the level was tested numerous times during the formation of the handle.
The context of this particular inverted cup and handle allows us to scale in.
Shorting at the breakout of $46.00 might not be the best decision as we would be selling into the potential $42.00 support level. Instead, we could add to the short position at the breakout of $42.00, setting a protective stop loss above $47.00
After the breakout, the market almost reached the standard target. If the price forms a reversal pattern right before the target, it’s reasonable to at least scale out.
Hong Kong: how bears stepped in during Global Financial Crisis
The 2008 bear market affected most of the economies, and China is not an exception. It takes an extra effort to identify the inverted cup and handle not long after the bearish reversal.
Do you remember that the basic requirement for the pattern is the appearance during bear markets?
In the HK33 chart below, let’s see how we can decipher if the major trend has changed.
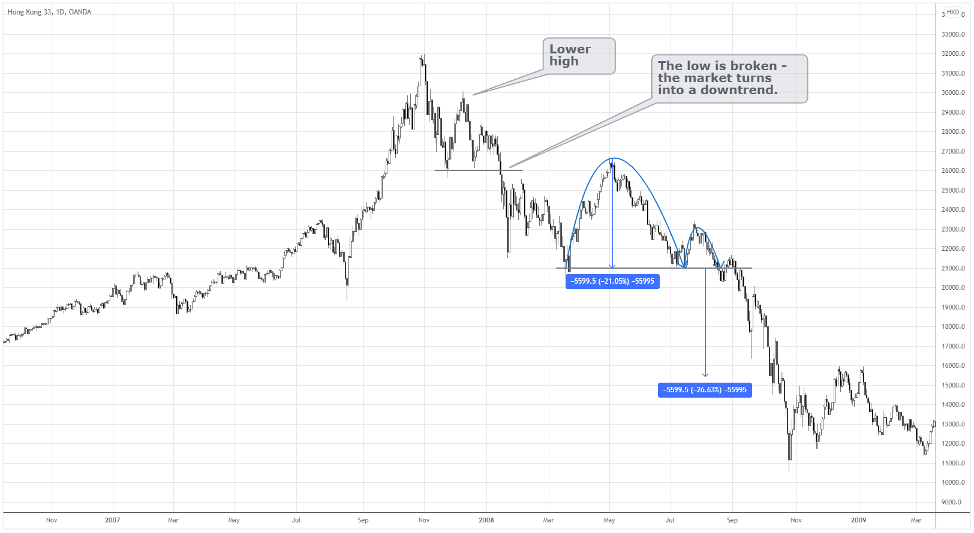
The uptrend is broken when buyers are unable to make a new high, and the price breaks below the previous low.
That’s what happened to the Hong Kong index; later on, the inverted cup and handle has formed in already bearish sentiment. You can see how the panic selling resulted in the index far exceeding the target.
Conclusion
Inverted cup and handle setup gives a signal to sell during the downtrend.
The pattern has clear properties such as length, proportions, entries, stops, and targets.
The accuracy rate of the formation is around 65% if we trade it on a daily timeframe.
However, due to the unique nature of the bear markets, it can be challenging to spot this pattern.