


GBPUSD Trading Analysis
GBPUSD Trading Analysis
Dear traders,
The trading analysis from last time enfolded beautifully well. I managed to take a position off my Twitter analysis HERE
Initially I managed to get 5R ratio, which means the risk I took was rewarded 5 times.
Gradually I lifted my stop loss and managed to secure a small part of the profit.
In the following trading sessions unfortunately, there was a bullish engulfing pattern that formed on the daily chart. This candlestick pattern led to a massive sell-out the following day.
Since I did not close my position (partially my mistake) at that time, price moved back down to my stop loss level and I got closed out.
Sometimes you make mistakes by aiming too high and ignoring the current circumstances. I never said I was perfect and this is a great example of how I could have played this trade out better.
I was looking to get over 30 times the return of my original risk which was something I have accomplished in the past, but by continuously reading the market environment.
On this occasion, I ignored the following price action signals I was receiving from the daily chart and consequently the 4H chart.
GBPUSD Trading Analysis
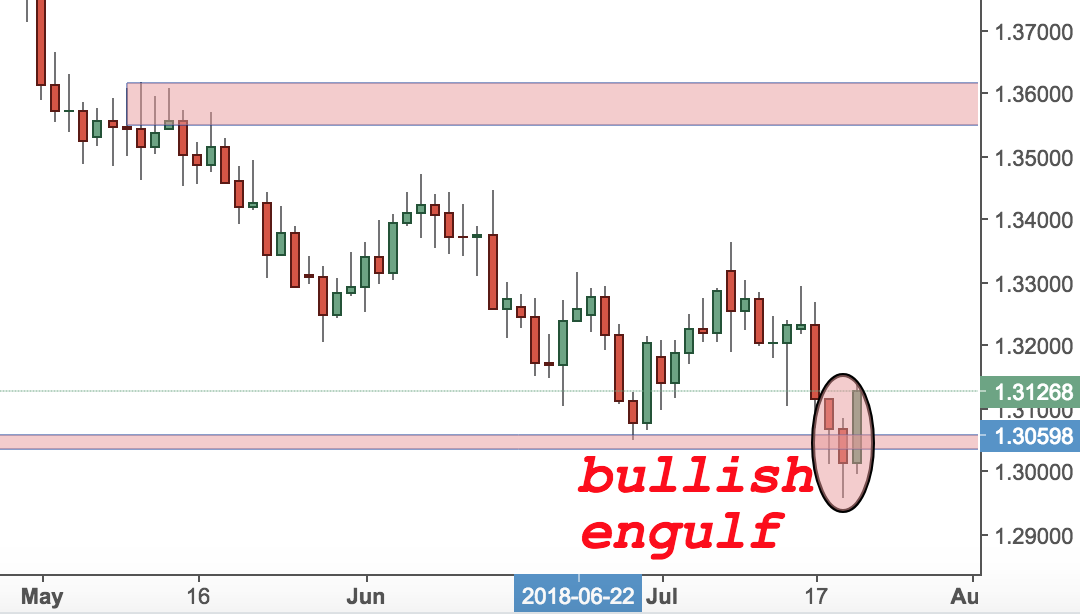
Today’s trading analysis comes from the GBPUSD.
As you can see from the chart above, I believe there might be an opportunity to go long here.
GBPUSD reached a major support level just above 1.3000. The daily chart formed a bullish engulfing pattern and in the next few sessions I will be looking for a confirmation of that initial trading setup.
Ideally, I would like to see price returning back to the 1.3075 area and forming a bearish rejection or another significant bullish candlestick pattern.
Until that happens, I will be monitoring the price action of GBPUSD and planning my next move.
Happy Sunday,
Colibri Trader
p.s.
Check out my recent article on Pitchfork Trading Strategies
OR
Check out how I use the Inside Bar – another very important candlestick pattern