


A Trader’s Guide to Double Tops and Bottoms

Double tops and bottoms are some of the most powerful and reliable patterns you'll find on a chart. They act like flashing signals, warning you that the current trend might be running out of gas and is getting ready to turn around.
A double top looks like the letter 'M' and hints that an uptrend is losing steam. On the other hand, a double bottom forms a 'W' shape, suggesting a downtrend is likely coming to an end.
What Are Double Top and Bottom Patterns?
Think of the market as a constant tug-of-war between the buyers (bulls) and the sellers (bears). Double tops and bottoms are the chart's way of telling the story of this battle, showing a clear shift in who has the upper hand. These aren't just random shapes; they represent a failed attempt by one side to keep pushing the price their way, giving savvy traders a heads-up about what could happen next.
A double top pattern tells a story of buyer exhaustion. After a solid run-up, buyers push the price to a new high (the first peak). Sellers then jump in, causing a pullback. The bulls, ever the optimists, give it another go but just can't manage to break past that previous high (the second peak). This second failure is a massive clue that buying pressure is fizzling out and sellers are starting to take over.
The double bottom is the exact opposite story: seller fatigue. During a downtrend, sellers drag the price to a new low (the first trough). Buyers see a bargain and step in, pushing the price up for a bit. Sellers then try one last time to shove the price lower but stall out at the previous low (the second trough). Their inability to make a new low signals that the selling pressure is weak, and buyers are getting ready to step in.
The Key Landmarks on the Battlefield
To spot these patterns correctly, you need to know their core components. I like to think of them as landmarks on the market battlefield that map out the struggle.
- The Two Peaks (Tops) or Troughs (Bottoms): These are the two points where the market tries and fails to advance. For a double top, the peaks should be at roughly the same price level, creating a resistance zone. For a double bottom, the troughs form a similar support area.
- The Neckline: This is the most important part of the pattern, hands down. The neckline is a horizontal line drawn through the lowest point of the pullback between the two peaks (in a double top) or the highest point of the rally between the two troughs (in a double bottom). A clean, decisive break of this line is what confirms the pattern and signals that the reversal is officially on.
Understanding the psychology behind these patterns is what really matters. It’s not about memorizing an 'M' or 'W' shape. It’s about recognizing the story of a failed breakout and the shift in market sentiment that follows.
To really get a feel for these reversal patterns, it helps to understand the wider world of essential day trading chart patterns. These formations are a cornerstone of technical analysis and belong to a larger family of forex chart patterns that traders use to read the market's mind. They provide a solid framework for anticipating when a trend is about to change direction.
The Anatomy of a Reversal Pattern
To consistently spot high-probability double tops and bottoms, you have to look beyond just seeing an 'M' or a 'W' shape on your chart. Think of yourself as a detective at a crime scene—every little detail matters. Each part of the pattern tells a story about the tug-of-war between buyers and sellers. Getting a handle on this anatomy is the key to telling a real signal from simple market noise.
At their core, both the double top and double bottom are about a shift in momentum. A double top is a bearish reversal pattern that shows up after a nice, long uptrend. It’s marked by two rounded peaks at roughly the same price, with a small dip in between. This formation screams that buyers are losing steam; the second peak fails to push higher, signaling that sellers are starting to take over.
Conversely, a double bottom forms after a prolonged downtrend. Price tries to make a new low, fails, and then tries again—only to fail a second time. This tells us the selling pressure is drying up, and buyers are quietly starting to step in and accumulate. If you want a deeper look at the mechanics, tastylive.com offers a great breakdown of these powerful chart patterns.
This next image perfectly captures the psychological battle that fuels these formations.
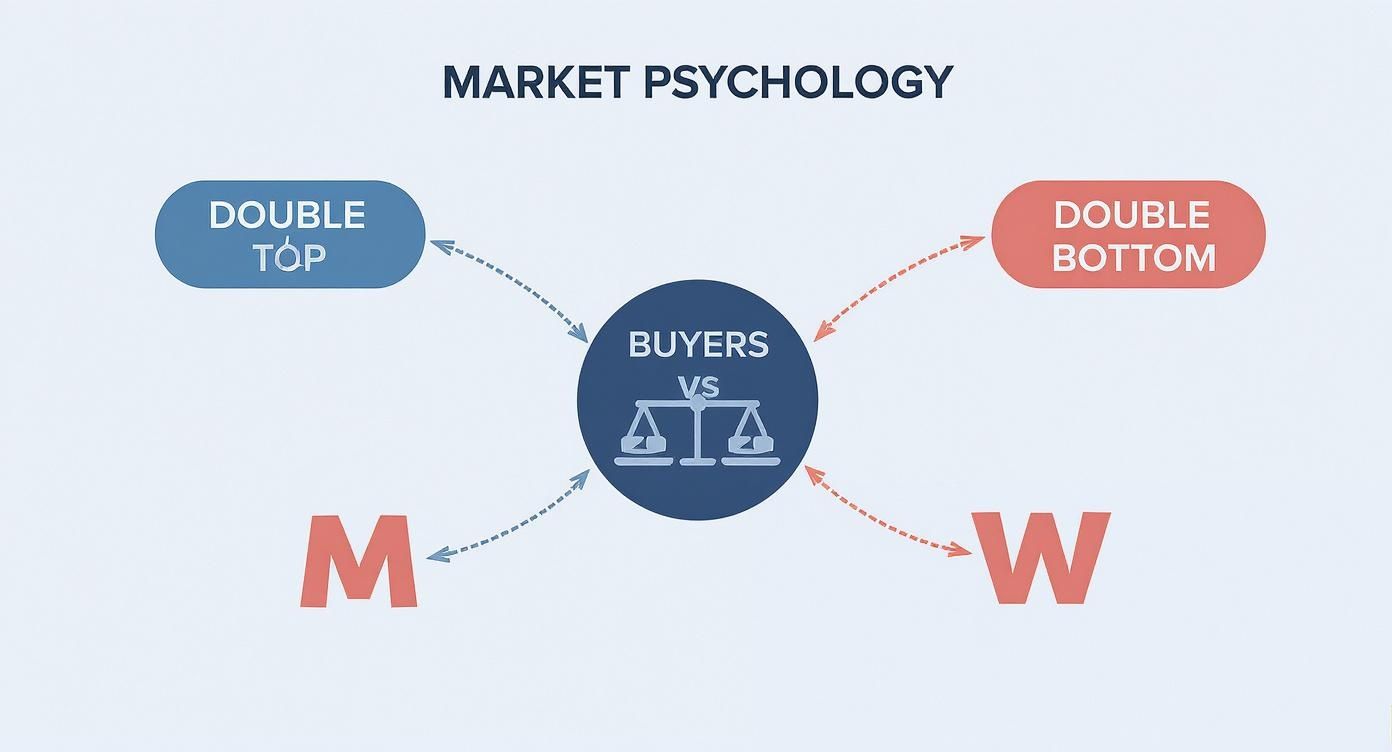
You can see how the 'M' shape illustrates buyers running out of gas, while the 'W' shape shows sellers finally giving up.
Breaking Down the Core Components
Every valid pattern is built from four distinct parts. If even one of these is missing, the whole setup could be invalid, turning a potential trade into a trap. Let's look at the blueprint for both patterns.
The Four Essential Elements:
-
The First Peak or Trough: This sets the initial extreme for the trend. For a double top, it's the first high point where buying momentum hits a wall. For a double bottom, it's the first low where sellers start to lose their grip.
-
The Intervening Pullback: After that first extreme, the other side of the market steps in. In a double top, this is a price drop that forms a temporary support level. In a double bottom, it’s a rally that creates temporary resistance.
-
The Second Peak or Trough: This is the moment of truth. Price comes back to test the level of the first extreme. A real pattern needs this second test to fail at or very near the same price, showing a clear loss of momentum.
-
The Neckline: This is the horizontal line you draw through the lowest point of the pullback (in a double top) or the highest point of the rally (in a double bottom). It’s the definitive line in the sand. A break of the neckline is what confirms the pattern is complete and ready to trade.
The Critical Role of Volume
I like to call volume the "lie detector" of technical analysis. It’s especially critical when you’re looking at double tops and bottoms because it gives you context about the conviction behind the price moves.
In a classic double top, you ideally want to see lower volume on the second peak compared to the first. This drop-off in participation signals that fewer buyers are interested at that price, confirming their exhaustion.
For a double bottom, the opposite is true. We often look for a spike in volume on the breakout above the neckline. That surge shows strong buying interest and adds a powerful layer of confirmation that a new uptrend is kicking off. Weak volume on a breakout is a major red flag.
Double Top vs Double Bottom Key Characteristics
To make things crystal clear, this table lays out a side-by-side comparison of the key attributes for both of these powerful reversal patterns.
| Characteristic | Double Top (Bearish) | Double Bottom (Bullish) |
|---|---|---|
| Prior Trend | A clear and established uptrend. | A clear and established downtrend. |
| Shape | Resembles the letter 'M'. | Resembles the letter 'W'. |
| Peaks/Troughs | Two distinct peaks at a similar price level. | Two distinct troughs at a similar price level. |
| Volume Clue | Volume is often lower on the second peak. | Volume often increases on the breakout. |
| Confirmation | A decisive price break below the neckline. | A decisive price break above the neckline. |
| Market Signal | Indicates a potential shift to a downtrend. | Indicates a potential shift to an uptrend. |
Understanding these distinct characteristics will help you quickly differentiate between the two setups and evaluate their potential strength in real-time market conditions.
Finding Confirmation Signals You Can Trust
Spotting a potential 'M' or 'W' on your chart is just the start. The real skill is knowing which patterns are genuine signals and which are just market noise. This is where confirmation comes in—it's what separates a high-probability trade from an expensive lesson. Without it, you’re just gambling.
Think of a potential pattern as a rumor floating around the market. Confirmation is the hard evidence that turns that rumor into actionable intelligence. For me, the two most powerful pieces of evidence are a decisive break of the neckline and a significant change in trading volume. These signals tell you a real shift in market power is underway.
A clean, powerful break of the neckline is your main trigger. For double tops and bottoms, this horizontal line is the battleground. When the price slices through it with conviction, it signals that one side has finally surrendered and a new trend is likely taking hold.

The Neckline Break: The Ultimate Go Signal
A true breakout isn't just a brief dip below or a quick poke above the line. So many impatient traders jump the gun the moment price touches the neckline, only to get trapped in a nasty "fakeout" when it snaps right back. To avoid this costly mistake, you need to see a more definitive sign of commitment from the market.
My most reliable rule is to wait for a full candlestick to close firmly beyond the neckline. This act of closing shows that the market held the new price for the entire duration of that candle's period, which suggests a much stronger consensus. For a deeper dive into reading these clues, our guide on understanding candlestick charts is essential for any price action trader.
A weak close, where the candle barely crosses the line or has a long wick pointing back toward it, is a huge warning sign. It screams hesitation and could be the prelude to a pattern failure.
Volume: The Lie Detector of the Market
If the neckline break is the signal, then trading volume is the amplifier. It tells you how much real conviction is behind that move. Volume measures participation—how many shares or contracts are changing hands—and it reveals the level of enthusiasm in the market.
A breakout accompanied by a significant increase in volume is a powerful confirmation. It shows that a large number of market participants are aggressively pushing the price in the new direction, adding serious fuel to the reversal.
On the flip side, a breakout on weak or declining volume is a major red flag. It’s like hearing a loud cheer from a tiny crowd—it just doesn't feel credible. This often means there isn’t enough force to sustain the move, making a reversal back into the pattern’s range highly likely. This is a classic false breakout that traps unsuspecting traders every single day.
To keep it simple, here are the core confirmation rules I live by:
- Rule 1: Wait for a Candle Close. I cannot stress this enough. Never enter a trade until a candle has fully closed beyond the neckline on your chosen timeframe.
- Rule 2: Look for High Volume. A breakout from a double bottom should happen on rising volume. A breakdown from a double top should also see a clear increase in selling pressure.
- Rule 3: Context is King. The strongest double tops and bottoms form after a clear, sustained trend. A pattern that shows up in a messy, sideways market is far less reliable.
By patiently waiting for these signals to align, you dramatically stack the odds in your favor. It's how you build the discipline needed for consistent, long-term trading.
How to Execute Your Trading Plan
Spotting a confirmed pattern is one thing. Pulling the trigger with precision is something else entirely. This is where a rock-solid, mechanical trading plan comes in—it’s what separates disciplined traders from emotional ones. A real strategy for double tops and bottoms goes way beyond just finding the pattern; it’s about defining your exact entry, stop-loss, and profit target before you ever risk a single dollar.

This kind of playbook gives you a repeatable process, turning your chart analysis into cold, hard action. It's a non-negotiable part of any trader's toolkit. If you're serious about getting your rules down on paper, our comprehensive trading plan template gives you a structured framework to build from.
Choosing Your Entry Method
Once the neckline breaks, you've got two main ways to get into the trade. Neither is right or wrong; they just cater to different risk appetites and trading personalities.
-
The Aggressive Entry: This means jumping in the moment a candle closes decisively past the neckline. The big plus here is you get in early and are less likely to miss the move if it takes off like a rocket. The downside? You're more vulnerable to "fakeouts"—those nasty moments when the price pops through the line only to snap right back.
-
The Conservative Entry: With this approach, you wait for the initial breakout, then sit on your hands and watch for the price to pull back and retest the neckline. If the line holds (as new resistance for a double top or new support for a double bottom) and price action confirms the reversal, then you enter. This gives you much better confirmation, but you run the risk of missing the trade completely if the price never looks back.
Your choice here really has to mesh with your personal tolerance for risk. An aggressive entry might get you a better price but with less certainty. The conservative entry offers more proof the move is real, but you might pay a higher price or miss the boat altogether.
Setting Your Stop Loss and Profit Target
Good trade management boils down to two things: knowing exactly when you're wrong and knowing when to cash in your chips. The very structure of double tops and bottoms gives us a logical map for both.
Placing Your Stop-Loss
Think of your stop-loss as your eject button. It's the point on the chart that proves your trade idea was a bust.
- For a Double Top (Short Trade): Your stop-loss goes just a bit above the highest point of the two peaks. That's the logical invalidation point. If the price manages to climb back above that high, your bearish idea is clearly wrong.
- For a Double Bottom (Long Trade): The stop-loss gets placed just below the lowest point of the two troughs. If sellers push the price below this support area, the bullish reversal has failed. Simple as that.
Projecting Your Profit Target
The most common way to set a profit target is beautifully simple and surprisingly effective.
- Measure the Height: Calculate the vertical distance (in pips, points, or dollars) from the highest peak down to the neckline. For a double bottom, you'd measure from the lowest trough up to the neckline.
- Project the Target: From the spot where the price broke the neckline, project that same measured distance in the direction of the breakout. This calculation gives you a solid, logical minimum price target for the move.
It’s interesting to note that one statistical analysis of double top strategies found an average win rate of about 38%. Now, that might sound low, but the key was the reward-to-risk ratio, which came in at an attractive 3:1. This means the winning trades were substantially bigger than the losing ones, highlighting why it's so important to let your winners run to their targets. When you follow a structured plan with clear exit rules, you're giving yourself a much-needed statistical edge.
Navigating False Signals and Pattern Failures
Let's get one thing straight: no chart pattern is a crystal ball. Anyone who tells you otherwise is probably selling something.
The reality of trading is that even the most reliable setups, like double tops and bottoms, are going to fail sometimes. Knowing how to handle these moments—when the chart veers off-script—is what separates consistently profitable traders from the ones who blow up their accounts.
A false signal, or a failed pattern, is the market's ultimate head-fake. For a double top, it's when the price breaks the neckline, sucking in short-sellers, only to violently snap back above it. For a double bottom, the breakout above the neckline fizzles out, and the price collapses back below. It’s frustrating, but it’s part of the game.
These failures don't just happen randomly, though. They’re usually driven by powerful market forces that simply overwhelm the reversal signal you were watching.
Why Patterns Sometimes Break Down
Understanding why a pattern fails is the first step toward building resilience. It’s rarely a random fluke. Instead, a few common culprits are usually at play, and learning to spot them can help you sidestep a lot of pain.
Here are the three main reasons a pattern is likely to fall apart:
- Overwhelming Trend Momentum: If an uptrend is just incredibly strong, a double top might just be a brief pause. It's a resting spot before the buyers regroup and shove prices even higher. The underlying momentum is simply too powerful for the reversal pattern to stand a chance.
- Lack of Volume Confirmation: Like I've said before, volume is your lie detector. A breakdown below the neckline on weak, anemic volume is a massive red flag. It screams that the sellers lack conviction, making a snap-back reversal much, much more likely.
- Major News or Economic Events: Sometimes, the charts just don't matter. A surprise announcement from a central bank or a shocking economic report can inject a massive dose of volatility into the market, making your perfectly formed pattern temporarily irrelevant.
A failed pattern isn’t a personal failure; it's a data point. The market is simply telling you that your initial thesis was wrong. The professional’s job is not to argue with the market, but to listen and react swiftly.
Your Defensive Playbook When a Trade Turns South
Your best defense against a failed pattern is having an escape plan before you even enter the trade. This is where your pre-set stop-loss becomes your most valuable tool. It’s your non-negotiable exit strategy that protects your capital when you're wrong, preventing a small, manageable loss from turning into a devastating one.
The numbers back this up. In one analysis of 500 stocks, roughly 17% of identified double tops turned out to be false signals. While the successful patterns led to big moves, the fact that failures exist highlights the absolute statistical necessity of managing your risk on every single trade. You can dig into more data on double top performance and strategy at QuantifiedStrategies.com.
Here's the interesting part: when a pattern fails, it can sometimes create a brand new opportunity. A failed double top that aggressively reclaims the neckline can become a powerful bullish signal. Why? Because all those trapped short-sellers are forced to buy back their positions to cover, adding serious fuel to the upward fire.
By staying objective and managing your risk like a professional, you can not only survive failed patterns but sometimes even turn them to your advantage.
Advanced Tactics and Common Variations
Once you’ve got the hang of spotting classic double tops and bottoms, it's time to start layering in some more advanced analysis. Moving past the textbook pattern helps you read the market’s psychology with more nuance and build a much more robust trading strategy. These methods are all about stacking the odds in your favour by looking for extra confirmation.
This means we'll look at subtle variations in the pattern's shape, how to use multiple timeframes to your advantage, and how to combine pure price action with other tools. The goal here is to shift from just identifying a pattern to building a rock-solid, multi-faceted case for every single trade you're thinking about taking.
The Adam and Eve Variation
You'll quickly notice that not all double tops and bottoms are created equal. One of the most common and powerful variations you'll see is the Adam & Eve pattern. This formation gives you a much deeper insight into the shifting sentiment that's driving the reversal.
The names simply refer to the shape of the peaks or troughs:
- Adam: Think of a sharp, narrow, V-shaped peak or trough. This represents a fast, aggressive rejection of a price level. It's a quick "get out" moment.
- Eve: This is a slower, more rounded, and wider U-shaped peak or trough. This shows a more gradual loss of steam and a drawn-out fight before the market finally gives up and reverses.
An Adam & Eve double top, for instance, kicks off with a sharp first peak (Adam) and is followed by a much weaker, rounded-off second peak (Eve). This combination can be particularly powerful. It shows an initial aggressive rejection, followed by a clear failure of the buyers to muster up the same momentum again.
Using Multiple Timeframes for Stronger Signals
Here’s a powerful technique: use a pattern on a higher timeframe to set up your trade on a lower one. For example, if you spot a double top forming on the weekly chart, that gives you a strong bearish bias for the entire market. This high-level context is priceless.
With that larger bias in mind, you can then drill down to the daily or 4-hour chart to pinpoint your actual entry. Waiting for a neckline to break on the daily chart, knowing it’s backed by a weekly pattern, gives you a much higher-probability setup than just trading that daily pattern in a vacuum. This top-down approach makes sure you're trading with the larger market structure, not fighting against it.
By confirming a pattern across multiple timeframes, you filter out so much of the market noise. A weekly double top that triggers a daily neckline break is a signal that carries far more weight than a pattern that only shows up on a 15-minute chart.
Combining Patterns with Momentum Indicators
While my core approach is always grounded in pure price action, layering in a momentum indicator like the Relative Strength Index (RSI) can add an incredibly powerful layer of confirmation. One of the best signals to look for is divergence.
- Bearish Divergence (Double Top): The price makes a second high that is equal to or even slightly higher than the first, but the RSI makes a lower high. This is a huge clue that the momentum behind the price move is fading fast, even as the price itself is trying to push higher.
- Bullish Divergence (Double Bottom): The price forms a second low equal to or slightly lower than the first, but the RSI prints a higher low. This tells you that the selling pressure is drying up, setting the stage for a potential rally.
When you see a classic double top forming at the exact same time bearish divergence appears on the RSI, you now have two independent signals telling you the same story. This confluence of evidence dramatically increases the probability that the pattern will play out as expected, giving you much more confidence to pull the trigger on your trade.
Frequently Asked Questions
Even when you feel you've got a solid handle on double tops and bottoms, seeing one pop up on a live chart can bring a flood of new questions. Let's tackle some of the most common ones that come up in the heat of the moment.
Think of this as your quick-reference guide. Getting these details straight is what builds the confidence to act decisively when a pattern finally takes shape.
What Is the Ideal Time Between the Two Peaks or Troughs?
There’s no magic number here. The "right" amount of time between the two tests depends entirely on the timeframe you're trading. On a daily chart, for instance, a separation of three weeks to a few months is a pretty good benchmark. It suggests a genuine, memorable test of that price level.
The principle is the same no matter the chart. If the two peaks are crammed together, it might just be minor consolidation—a brief pause, not a major reversal signal. But if they're worlds apart, the two price actions could be completely unrelated.
What you really want to see is a significant, intervening pullback between the two tests. That dip or rally is what proves the market had a genuine change of heart before coming back for a second look.
How Is a Double Top Different From Basic Resistance?
This is a fantastic question because it gets right to the core of why we trade patterns, not just lines. While a double top absolutely forms at a resistance level, it tells a much richer story about a potential reversal.
Basic resistance is just a price ceiling that held in the past. A double top is a complete narrative with a beginning, middle, and end.
That narrative unfolds like this:
- An established uptrend is in play.
- Bulls make a first attempt to push higher but fail (the first peak).
- Price pulls back significantly, carving out the neckline.
- A second attempt to break the high is made, often on weaker volume, and fails again.
The pattern is only truly confirmed when the price breaks that neckline, signaling a fundamental shift in market structure. A resistance level is just a data point; a double top is the story of a battle fought and lost at that level.
When Are These Patterns Most Reliable?
Context is everything in trading. These reversal patterns pack the most punch when they appear after a long, clear trend.
A double top is most powerful after a strong, sustained uptrend because it screams trend exhaustion. Similarly, a double bottom is a much more credible signal after a deep, prolonged downtrend.
Trying to trade them in choppy, sideways markets is a recipe for frustration. When the market has no clear directional momentum, a "reversal" signal is almost meaningless and far more likely to fail.
At Colibri Trader, we teach you to read the market's story through pure price action, turning complex charts into clear, actionable signals. If you're ready to trade with clarity and confidence, without relying on confusing indicators, our approach is designed for you. Discover your trading potential and start your journey with us.