Candlestick Patterns for Beginners: Master Essential Trading Strategies
Decoding the Secrets of Candlestick Patterns
Want to unlock the predictive power of price action? This listicle introduces eight essential candlestick patterns for beginners. Learn to identify the Doji, Hammer, Hanging Man, Engulfing, Morning/Evening Star, Shooting/Inverted Hammer, Harami, and Marubozu patterns. We’ll cover their characteristics and how to apply them. Mastering these candlestick patterns for beginners will enhance your ability to analyze charts, anticipate market shifts, and improve your trading decisions. These fundamental concepts offer valuable insights into market sentiment and potential price movements, paving the way for more profitable trades.
1. Doji Candlestick Pattern
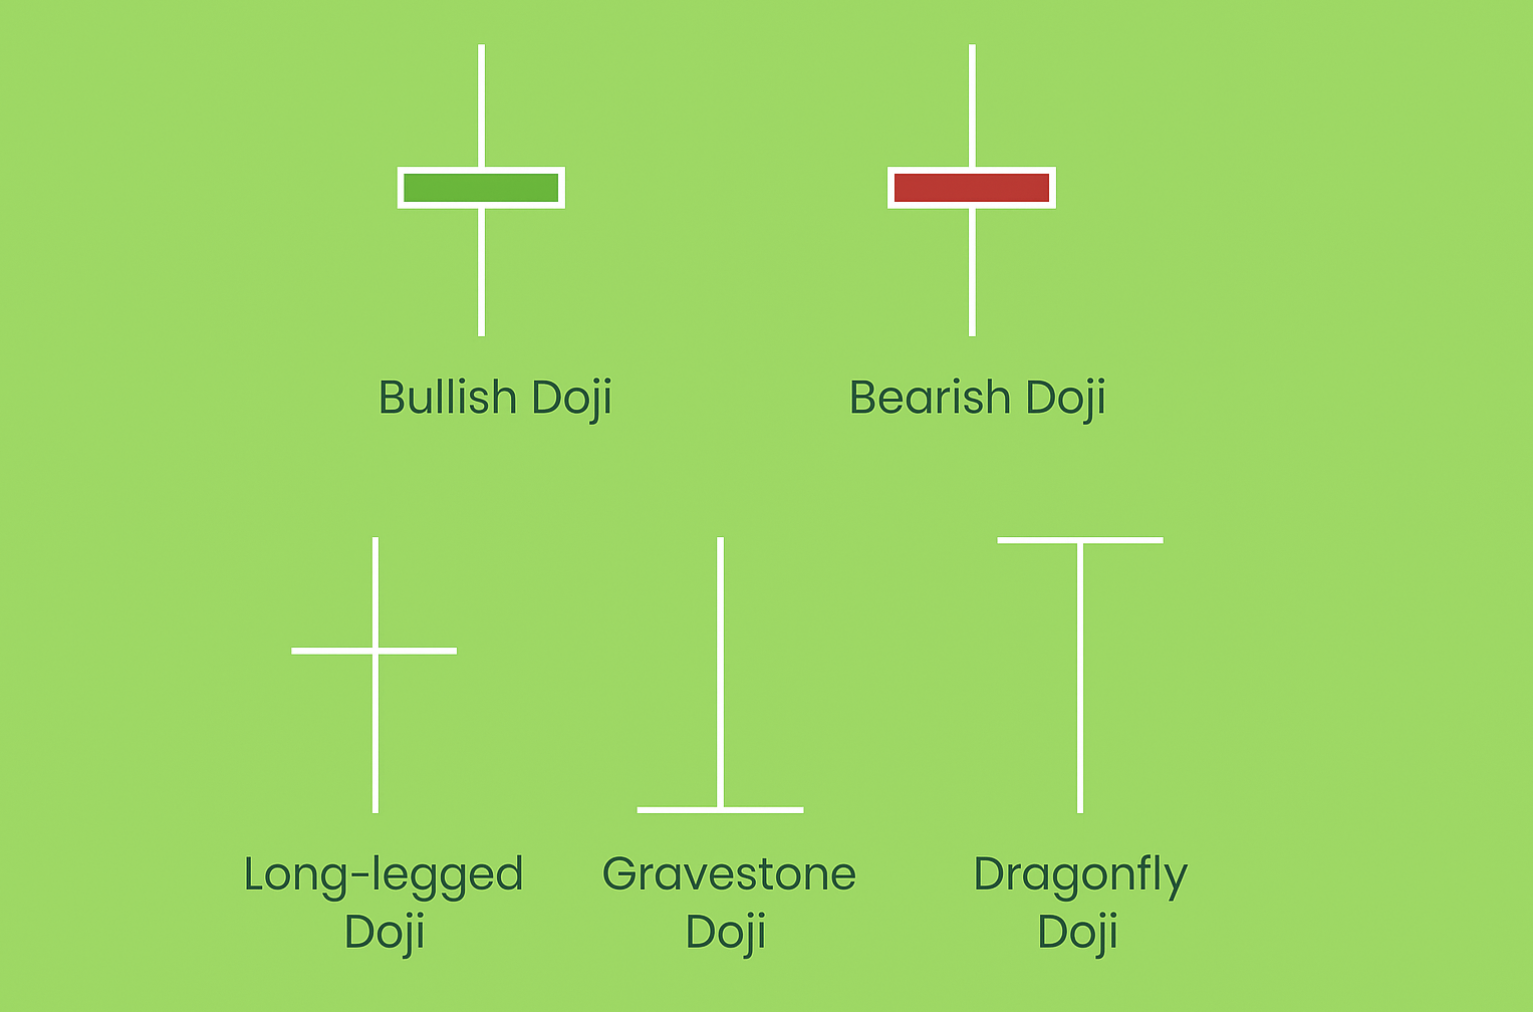
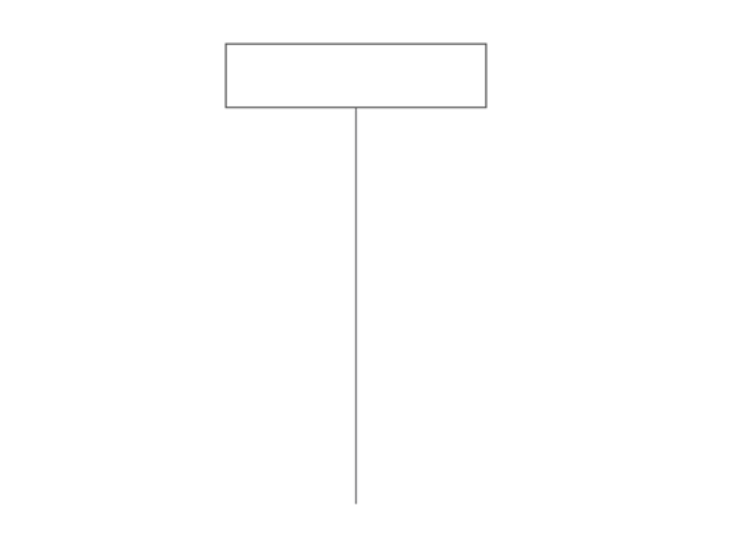
The Doji candlestick pattern is a fundamental element of candlestick analysis, making it a crucial tool for beginners learning to interpret price action. This unique pattern emerges when a security’s opening and closing prices are virtually identical, creating a cross, plus sign, or T-shaped figure on a candlestick chart. The Doji signifies a moment of market indecision and equilibrium where neither buyers nor sellers have gained a clear advantage. This balance of power can often foreshadow a potential reversal in the prevailing trend, particularly after a sustained period of advance or decline. This makes it a valuable addition to any beginner’s toolkit of candlestick patterns.
The Doji’s power lies in its ability to highlight potential turning points in the market. While the opening and closing prices are almost the same, the Doji can have varying lengths of upper and lower shadows (wicks). These shadows represent the price fluctuations throughout the trading period. A long upper shadow suggests that buyers initially pushed the price higher but were ultimately met with selling pressure, driving the price back down to near its opening level. Conversely, a long lower shadow indicates that sellers initially dominated, pushing the price lower, only to be countered by buying pressure that brought the price back up. This internal struggle between buyers and sellers is the essence of the Doji’s message of indecision.
There are several variations of the Doji, each providing slightly different insights. The Long-Legged Doji, with its long upper and lower shadows, emphasizes the significant price volatility and struggle for control during the trading period. A Dragonfly Doji, characterized by a long lower shadow and no upper shadow, suggests strong buying pressure that reversed earlier losses. Conversely, the Gravestone Doji, with a long upper shadow and no lower shadow, indicates selling pressure overcoming initial buying attempts.
Pros of Using the Doji Candlestick Pattern:
- Excellent indicator of potential trend reversals: Dojis often precede significant shifts in market direction.
- Easy to identify visually on charts: The distinct shape makes it easy to spot.
- Works across multiple timeframes and markets: Applicable from short-term intraday charts to long-term investment horizons.
- Strong signal when appearing at support/resistance levels: Increases the likelihood of a reversal.
Cons of Using the Doji Candlestick Pattern:
- Generates many false signals when used alone: Confirmation from subsequent candles is crucial.
- Requires confirmation from subsequent candles: Not a standalone trading signal.
- Less reliable in highly volatile markets: Indecision is commonplace in volatile environments, reducing the Doji’s predictive power.
- Interpretation varies based on preceding trend context: Its meaning changes depending on the prior price action.
Examples of Doji Candlestick Pattern in Action:
- A Doji forming at the peak of an uptrend often precedes a bearish reversal.
- In June 2020, Apple stock formed a Doji after a strong rally, leading to a brief pullback before continuing its upward trajectory.
- Bitcoin frequently shows Doji patterns at major price inflection points.
Tips for Using the Doji Candlestick Pattern:
- Always wait for confirmation in the following candle before entering a trade.
- Combine with volume indicators for stronger signals.
- The Doji is most effective when appearing at major support or resistance levels.
- Use in conjunction with other technical indicators like the Relative Strength Index (RSI) or Moving Average Convergence Divergence (MACD) to enhance your analysis.
The Doji Candlestick pattern was popularized by Steve Nison, who brought Japanese candlestick charting techniques to the Western world. However, the pattern’s origins lie with traditional Japanese rice traders who developed it centuries ago. Learn more about Doji Candlestick Pattern This historical perspective underscores the enduring value and relevance of this simple yet powerful tool for understanding market dynamics. For beginners venturing into the world of candlestick patterns, mastering the Doji is a crucial first step towards successful trading.
2. Hammer and Hanging Man Pattern
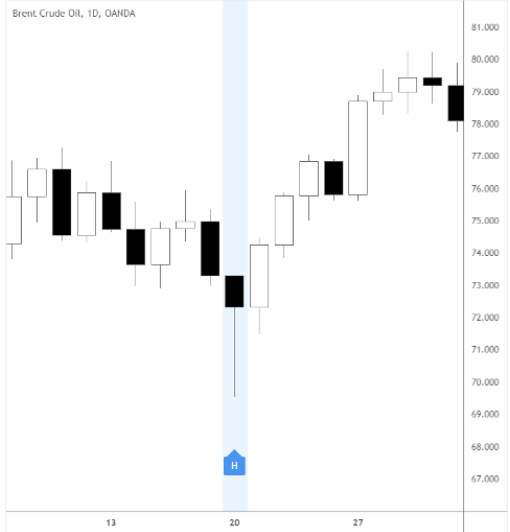
The Hammer and Hanging Man are two of the most easily recognizable candlestick patterns for beginners learning about price action. Visually identical, they both feature a small real body at the upper end of the trading range with a long lower shadow, typically two to three times the size of the body, and little to no upper shadow. This distinctive shape resembles a hammer, hence the name. The key difference lies in their placement within a trend and, consequently, their meaning.
A Hammer appears during a downtrend and signals a potential bullish reversal. It suggests that sellers initially pushed prices lower, creating the long lower shadow, but buyers then stepped in aggressively, driving the price back up towards the opening price. Conversely, a Hanging Man forms during an uptrend and warns of a possible bearish reversal. In this context, the long lower shadow indicates that selling pressure is increasing and the buyers’ ability to maintain the upward momentum might be weakening. The body color (green/white for bullish, red/black for bearish) is less critical than the pattern’s location and shape relative to the prevailing trend. Both patterns require the context of the preceding price action for accurate interpretation.
This pattern deserves its place on the beginner’s list due to its straightforward visual identification and strong reversal potential. They are readily spotted on any timeframe chart, from minutes to months, making them versatile tools for various trading styles. Furthermore, they provide clear entry and stop-loss levels, enhancing risk management.
Features:
- Small real body at the upper end of the trading range
- Long lower shadow (typically 2-3 times the size of the body)
- Little to no upper shadow
- Body color less important than location and shape
- Requires context of the preceding trend for interpretation
Pros:
- Strong reversal signals when properly identified
- Easy to spot on any timeframe chart
- Provides clear entry and stop-loss levels
- Effective across various markets and securities
Cons:
- Can produce false signals without confirmation
- Hanging Man requires additional confirmation as reversal reliability is lower
- Shadow length proportions can be subjective
- Less effective in choppy, sideways markets
Examples: Tesla stock formed a textbook Hammer pattern in March 2021 after a significant pullback, preceding a substantial rally. The S&P 500 displayed a Hanging Man in September 2020 before a market correction. These patterns also frequently appear in other markets like gold futures, often forming at key support and resistance levels.
Tips:
- For Hammers: Wait for the next candle to close above the Hammer’s body before entering a buy trade. This confirmation helps filter out false signals.
- For Hanging Man: Look for the next candle to break below the pattern’s low as confirmation of the bearish reversal.
- Set stop-losses just beyond the extremity of the lower shadow to minimize potential losses.
- Consider the volume during pattern formation—higher volume during the Hammer or Hanging Man adds credibility to the signal.
The Hammer and Hanging Man patterns were popularized by Steve Nison in his book Japanese Candlestick Charting Techniques and further analyzed by Thomas Bulkowski, who provided statistical data on their reliability. Learning to identify and interpret these candlestick patterns can be a valuable addition to any beginner’s technical analysis toolkit.
3. Engulfing Pattern
The Engulfing Pattern is a crucial two-candle reversal pattern for candlestick pattern beginners because it provides a clear visual signal of potential market shifts. This pattern occurs when the second candle completely “engulfs” the real body of the preceding candle. It signifies a potential reversal in the current trend, indicating a possible shift in market sentiment from bearish to bullish or vice versa. This easy-to-identify pattern makes it an excellent starting point for those new to candlestick analysis.
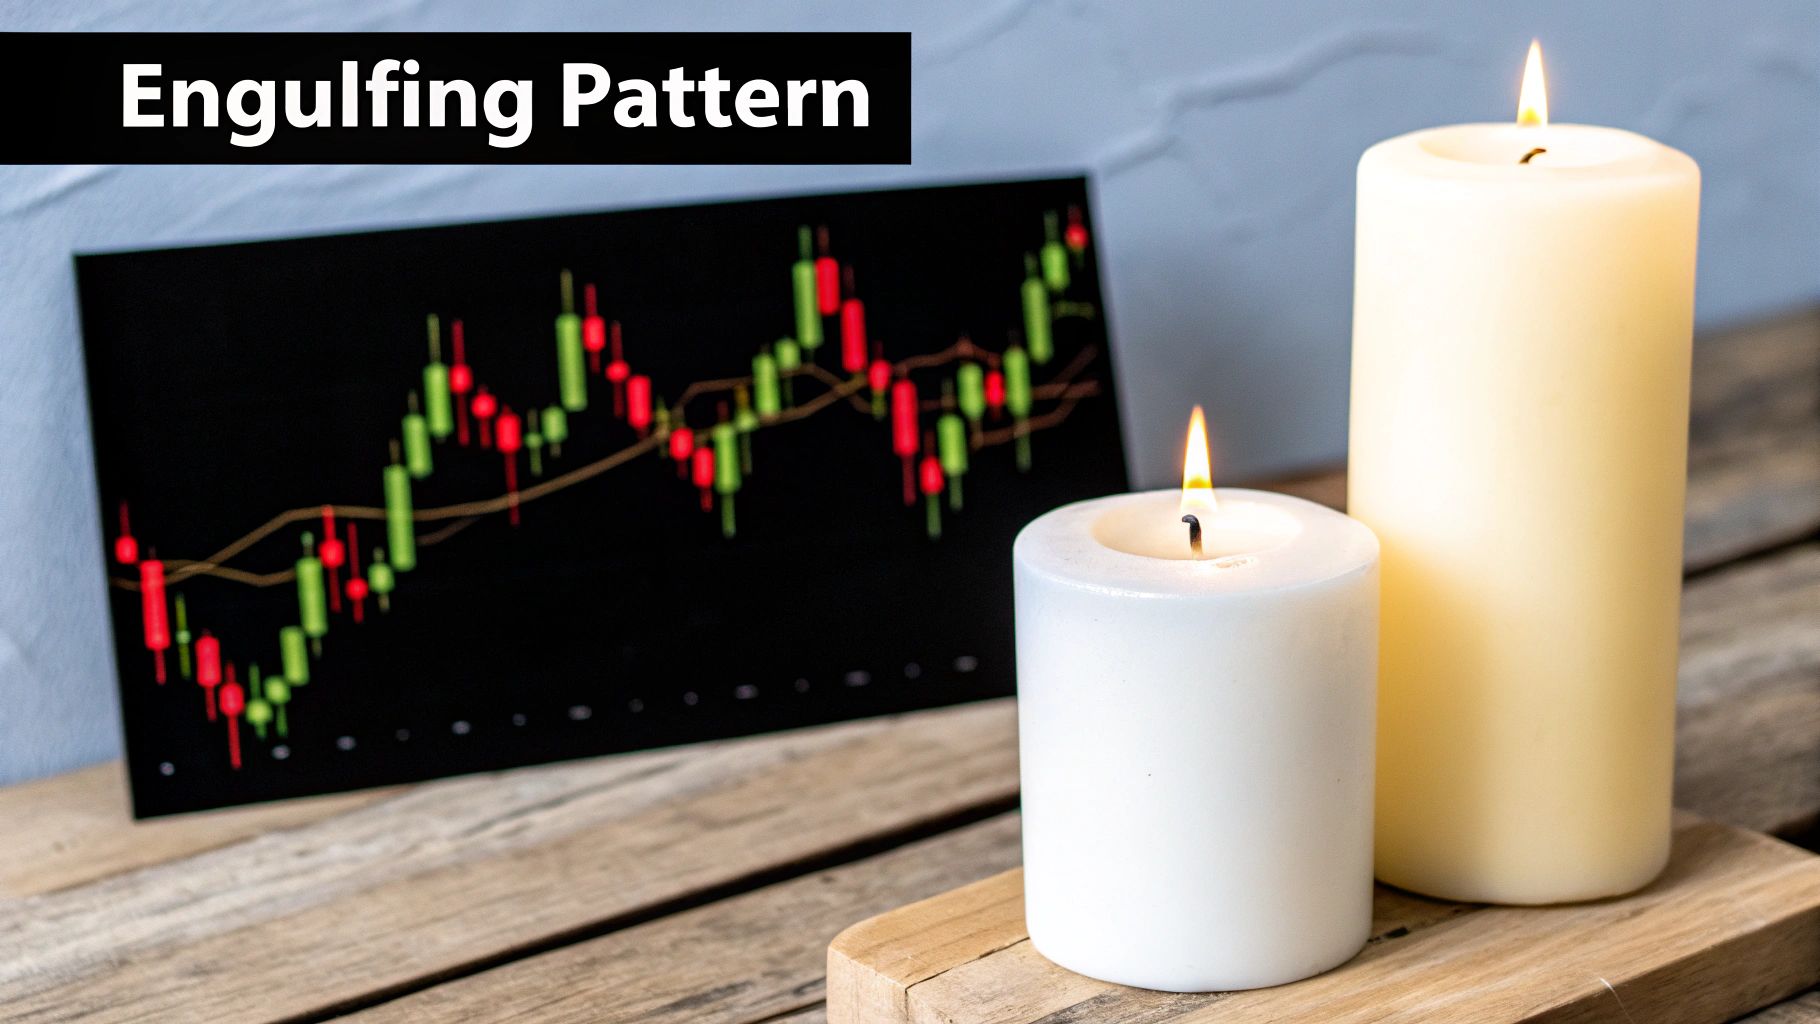
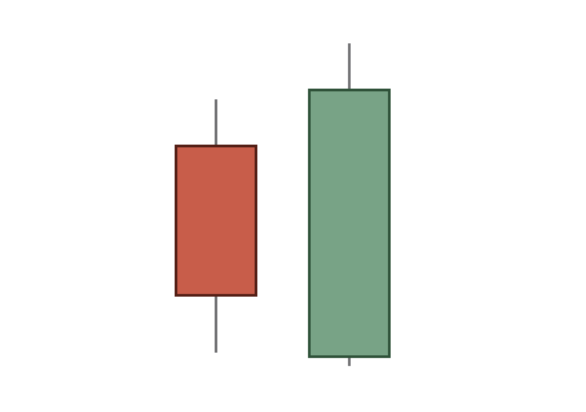
There are two types of Engulfing patterns: Bullish and Bearish. A Bullish Engulfing pattern emerges during a downtrend. It’s characterized by a small bearish candle followed by a larger bullish candle that completely engulfs the previous candle’s body. This suggests that buyers have overpowered sellers, potentially signaling an upward reversal. Conversely, a Bearish Engulfing pattern forms during an uptrend. It consists of a small bullish candle followed by a larger bearish candle that engulfs the prior candle’s body. This indicates that sellers have taken control, potentially leading to a downward reversal. The larger the difference in size between the two candles, the stronger the potential reversal. Note that while the real body must be engulfed, the shadows (wicks) don’t necessarily need to be.
Features of the Engulfing Pattern:
- Two-candle pattern with opposing colors.
- The second candle’s body completely covers (engulfs) the first candle’s body.
- The size difference between candles indicates the strength of the potential reversal.
- Shadows (wicks) are not required to be engulfed.
- More significant when appearing after extended trends.
Pros:
- One of the most reliable reversal patterns in candlestick analysis.
- Clear visual representation of shifting market sentiment.
- Provides well-defined entry and stop-loss points.
- Works effectively across different timeframes and markets.
Cons:
- Can produce false signals in volatile markets.
- Less reliable in ranging or choppy markets.
- Requires confirmation from subsequent price action or other indicators.
- Doesn’t predict the magnitude of the reversal.
Examples:
- A Bullish Engulfing pattern formed on Microsoft’s stock chart in March 2020 at the COVID market bottom, preceding a significant rally.
- The EUR/USD currency pair exhibited a Bearish Engulfing pattern in January 2021 before a notable downtrend.
Tips for Using the Engulfing Pattern:
- Focus on Extended Trends: Look for engulfing patterns that form after extended uptrends or downtrends, as these tend to be more reliable.
- Volume Confirmation: Increased volume on the engulfing candle strengthens the signal.
- Stop-Loss Placement: Set stop-losses beyond the high/low of the pattern depending on the direction of the potential reversal (above the high for a bullish engulfing, below the low for a bearish engulfing).
- Candle Size Matters: Larger engulfing candle bodies suggest stronger reversals.
- Key Levels: Engulfing patterns forming at key support or resistance levels hold added significance.
The Engulfing Pattern deserves a place on this list of candlestick patterns for beginners due to its straightforward visual identification and its powerful implications for potential trend reversals. It provides a solid foundation for understanding how market sentiment can shift, and with careful observation and confirmation, traders of all levels can utilize this pattern to identify promising trading opportunities. This pattern, popularized by technical analysts like Steve Nison and John Murphy, is a valuable tool for analyzing price action and making informed trading decisions.
4. Morning Star and Evening Star Pattern
The Morning Star and Evening Star patterns are valuable tools in a beginner’s candlestick pattern arsenal, offering clear signals of potential trend reversals. These three-candle formations provide powerful insights into shifting market sentiment and can pinpoint opportune entry and exit points. The Morning Star emerges at the bottom of a downtrend, hinting at a bullish reversal, while the Evening Star appears at the top of an uptrend, suggesting a bearish reversal. Both patterns feature a small, often indecisive middle candle (like a Doji or spinning top) sandwiched between a larger candle reflecting the previous trend and a large candle in the opposite direction, confirming the reversal.
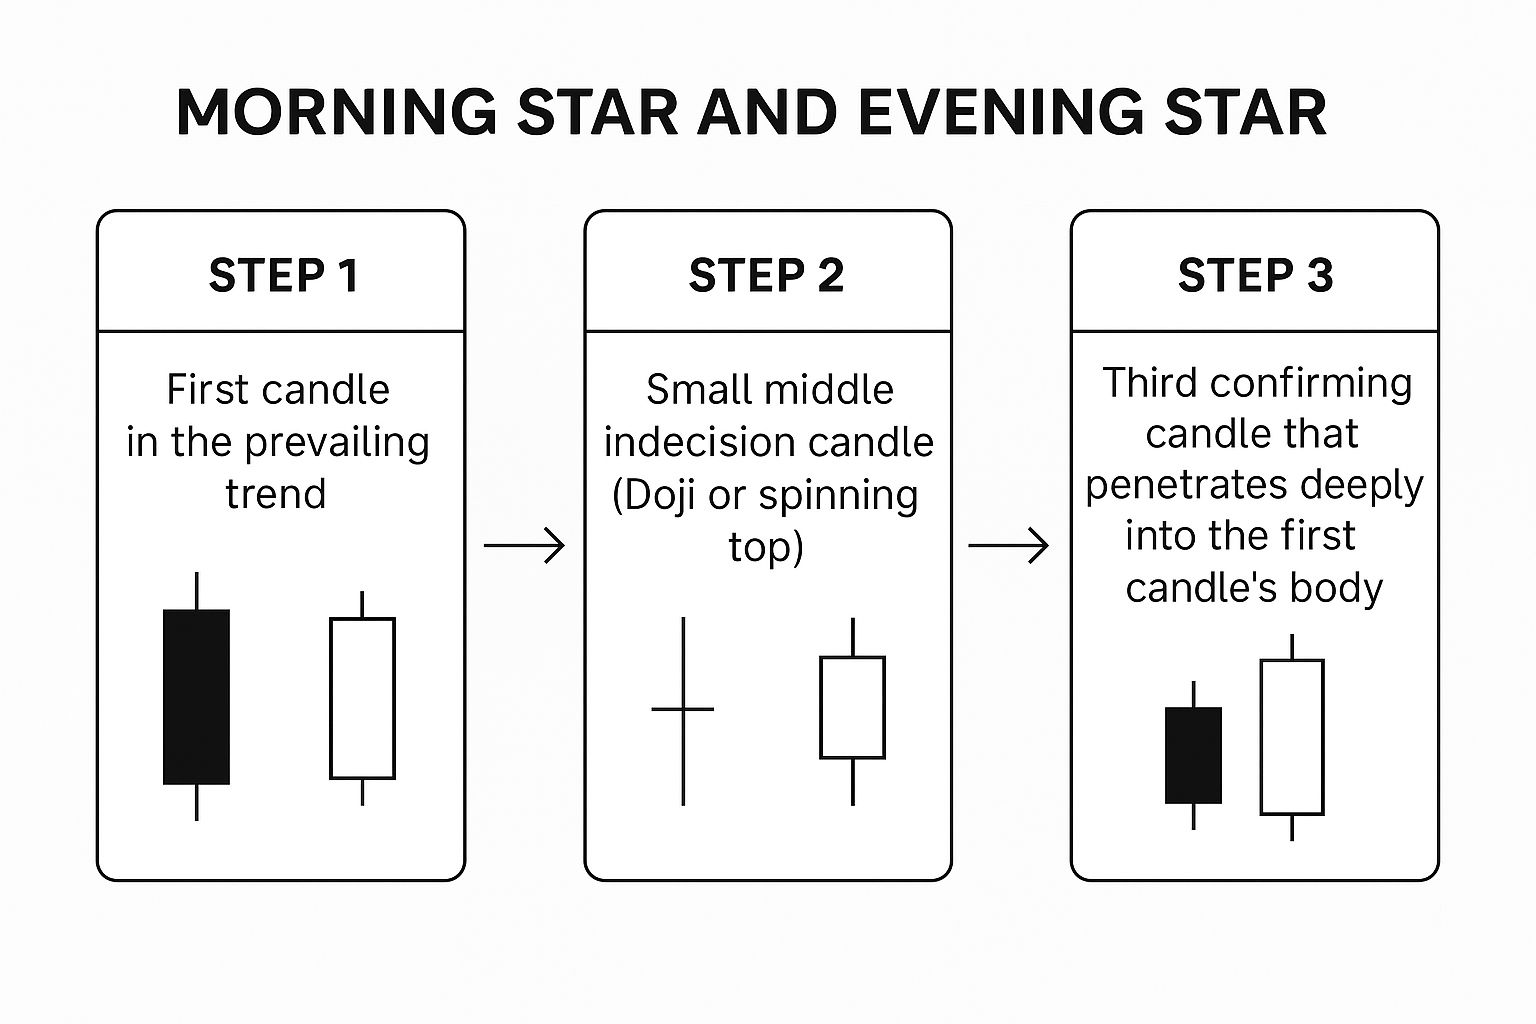
The infographic above visually represents the formation of both the Morning Star and Evening Star patterns. It illustrates the key elements: the initial trend candle, the small, indecisive middle candle, and the final reversal candle that penetrates significantly into the body of the first candle. This visualization emphasizes the importance of the sequence and the distinct shift in momentum these patterns highlight.
These patterns are highly reliable when correctly identified, providing a clear visualization of the transition from bearish to bullish sentiment (Morning Star) or bullish to bearish sentiment (Evening Star). The formation offers well-defined entry and stop-loss levels, making them particularly effective at major market tops and bottoms. For example, Apple stock displayed a classic Morning Star pattern during the March 2020 COVID market crash, preceding a substantial rally. Conversely, the S&P 500 formed an Evening Star in January 2022 before a significant correction. Another example includes Netflix showing a Morning Star in May 2022, which preceded a 25% rally. These real-world examples demonstrate the potential predictive power of these formations in various market conditions.
While the Morning Star and Evening Star patterns are valuable candlestick patterns for beginners, they do have limitations. Their three-candle structure necessitates a longer waiting period for confirmation compared to single or two-candle patterns. Also, they are less common than other patterns, requiring patience to spot them. The size of the middle candle can sometimes be subjective, adding a layer of complexity to the interpretation.
To maximize their effectiveness, wait for the complete three-candle formation before acting. Look for increased volume on the third, confirming candle, and prioritize patterns where the middle candle has minimal overlap with the first and third. Setting stop-losses beyond the pattern’s extreme (low for Morning Star, high for Evening Star) mitigates risk. Combining these patterns with support/resistance levels further enhances the probability of successful trades.
These powerful patterns, popularized by Steve Nison and originating from centuries-old Japanese rice trading practices, are essential tools for traders of all levels. From novices seeking foundational price action techniques to experienced professionals, understanding and applying the Morning Star and Evening Star patterns can significantly enhance trading strategies. Learn more about Morning Star and Evening Star Pattern This resource can offer further insights and practical applications of these powerful patterns. These patterns deserve a place on this list due to their clear visual representation of potential market turning points, well-defined entry and exit points, and historical effectiveness. They offer a powerful tool for beginners to understand and anticipate potential market shifts.
5. Shooting Star and Inverted Hammer Pattern
The Shooting Star and Inverted Hammer are essential candlestick patterns for beginners learning to analyze price action. These single-candle formations can provide valuable insights into potential trend reversals and are relatively easy to spot on a chart. Understanding these patterns can significantly enhance your ability to interpret market sentiment and make more informed trading decisions. They deserve a place on this list due to their straightforward visual identification and the early warning signals they can provide.
These patterns are characterized by their unique shape: a small real body situated at the lower end of the trading range, a long upper shadow (typically two to three times the length of the body), and little to no lower shadow. Think of an inverted hammer, hence the name for one of the patterns. Interestingly, despite their identical appearance, the Shooting Star and Inverted Hammer have contrasting meanings depending on the prevailing trend. The body color is less critical than the context of the preceding trend and the overall shape.
How They Work and When to Use Them:
-
Shooting Star: This pattern forms during an uptrend and signals a potential bearish reversal. It suggests that buyers initially pushed prices higher during the trading session (creating the long upper shadow) but failed to maintain control, leading to a close near the opening price. This indicates weakening bullish momentum and the possibility of a downturn.
-
Inverted Hammer: Conversely, the Inverted Hammer appears during a downtrend and hints at a possible bullish reversal. The long upper shadow again shows buyers attempting to push prices up, but this time within a downtrend. While the close isn’t significantly higher, the fact that buyers managed to push prices up suggests potential buying pressure entering the market.
Examples:
- Nvidia (NVDA): A Shooting Star pattern formed near Nvidia’s all-time high in November 2021, preceding a significant price correction. This illustrates the pattern’s potential to foreshadow bearish reversals at crucial resistance levels.
- Bitcoin (BTC): Following a major decline in July 2021, Bitcoin displayed an Inverted Hammer pattern. This signaled a potential shift in momentum and preceded a subsequent rally, demonstrating the pattern’s ability to identify possible bullish reversals in downtrends.
- Disney (DIS): In March 2021, Disney exhibited a textbook Shooting Star pattern at its post-pandemic recovery high, followed by a reversal. This highlights the importance of paying attention to these patterns, especially when they occur at significant price levels.
Pros:
- Easy to identify on any timeframe chart.
- Provides early warning of potential trend reversals.
- Offers clear stop-loss placement levels (below the body for Shooting Stars, below the low of the Inverted Hammer).
- Works across various markets and securities.
Cons:
- Lower reliability when used independently. Confirmation from subsequent candles is crucial.
- Inverted Hammer has lower reliability than the Shooting Star.
- Can produce false signals in volatile or ranging markets.
Actionable Tips:
- Confirmation: For Shooting Stars, wait for the next candle to close below the pattern’s body for confirmation. For Inverted Hammers, look for the next candle to close above the pattern’s body before entering a long position.
- Shadow Length: The longer the upper shadow, the stronger the potential reversal signal.
- Location: Patterns at key support or resistance levels carry more significance.
- Combined Analysis: Use volume analysis and other technical indicators like RSI or MACD to improve the accuracy of your trading decisions.
The Shooting Star and Inverted Hammer patterns, popularized by Steve Nison and further analyzed by technical analysts like Thomas Bulkowski, provide valuable tools for beginners and experienced traders alike. By understanding their characteristics and applying the tips provided, you can enhance your candlestick pattern analysis and improve your trading performance. Remember to always consider these patterns in the context of the broader market trend and confirm signals with subsequent price action and other technical indicators.
6. Harami Pattern
The Harami pattern is a valuable addition to any beginner’s candlestick pattern toolkit. As a two-candle reversal formation, it’s relatively easy to spot and understand, making it a great starting point for learning to read price action. Its name, meaning “pregnant” in Japanese, aptly describes its appearance: a large candle followed by a smaller candle nestled within the first candle’s body. This visual characteristic makes it readily identifiable on a chart.
This pattern suggests a potential shift in momentum and a possible trend reversal. It works by highlighting a weakening in the prevailing trend. A large candle signifies strong momentum, but the subsequent smaller candle, entirely contained within the prior candle’s body, indicates that this momentum is waning. The opposing colors of the two candles further emphasize this shift in sentiment.
There are two types of Harami patterns:
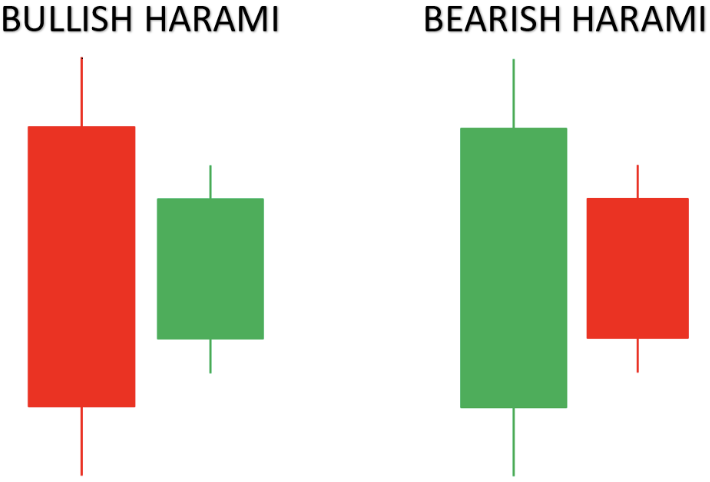
- Bullish Harami: Forms during a downtrend. It starts with a large bearish (red or black) candle followed by a smaller bullish (green or white) candle. This suggests that selling pressure is diminishing, and buyers are starting to step in.
- Bearish Harami: Appears during an uptrend. It begins with a large bullish candle followed by a smaller bearish candle. This signals potential buying exhaustion and increasing selling pressure.
Features of the Harami Pattern:
- Two-candle pattern with opposing colors.
- The second candle’s body is entirely contained within the first candle’s body.
- The second candle is notably smaller than the first.
- Shadows (wicks) of the second candle may extend beyond the first candle.
- A Harami Cross, where the second candle is a Doji (a candle with a very small body or no body), is considered a stronger reversal signal.
Pros:
- Signals potential exhaustion in the current trend.
- Offers a less aggressive entry point compared to more dramatic reversal patterns.
- Provides clear stop-loss placement levels (typically just beyond the high of the pattern for a Bearish Harami and the low for a Bullish Harami).
- Particularly effective in strongly trending markets.
Cons:
- Considered a weaker signal compared to Engulfing patterns.
- Often requires additional confirmation, such as a third candle closing in the direction of the reversal.
- Can be subjective in identifying the “containment” of the second candle.
- May lead to premature entries before a true trend reversal.
Examples:
- Facebook (Meta) stock formed a Bullish Harami in March 2020 near the pandemic market bottom, preceding a significant upward move.
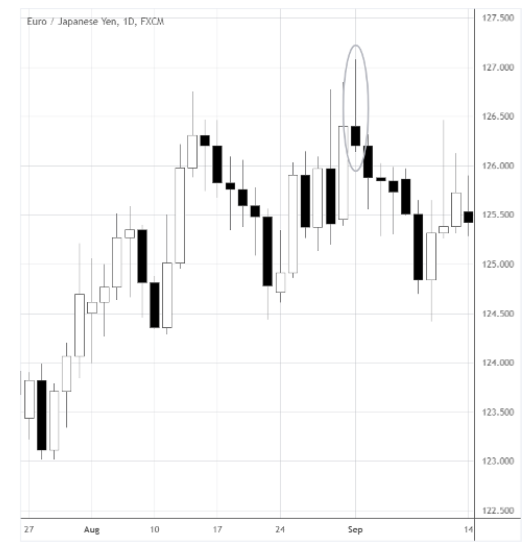
- The USD/JPY currency pair displayed a Bearish Harami in April 2022 before a notable downward correction.
- Ethereum showed a Bullish Harami pattern in July 2021 that preceded a substantial rally.
Tips for Using the Harami Pattern:
- Confirmation is key: Wait for a confirming candle after the Harami formation for higher reliability. This third candle should close in the direction of the anticipated reversal.
- Doji Power: The closer the second candle is to a Doji, the stronger the reversal signal (Harami Cross).
- Trend Context: Look for Harami patterns that form after extended trends, where a reversal is more likely.
- Indicator Confluence: Combine with momentum indicators like the Relative Strength Index (RSI) or Moving Average Convergence Divergence (MACD) for confirmation of trend exhaustion.
- Risk Management: Set stop-losses beyond the extreme of the pattern (high for Bearish Harami, low for Bullish Harami).
The Harami pattern’s simplicity and visual clarity make it an ideal starting point for beginners learning candlestick patterns. While it shouldn’t be used in isolation, when combined with other confirming factors, it can be a powerful tool for identifying potential trend reversals and improving trading decisions. Remember, practice and observation are crucial to mastering the art of candlestick analysis.
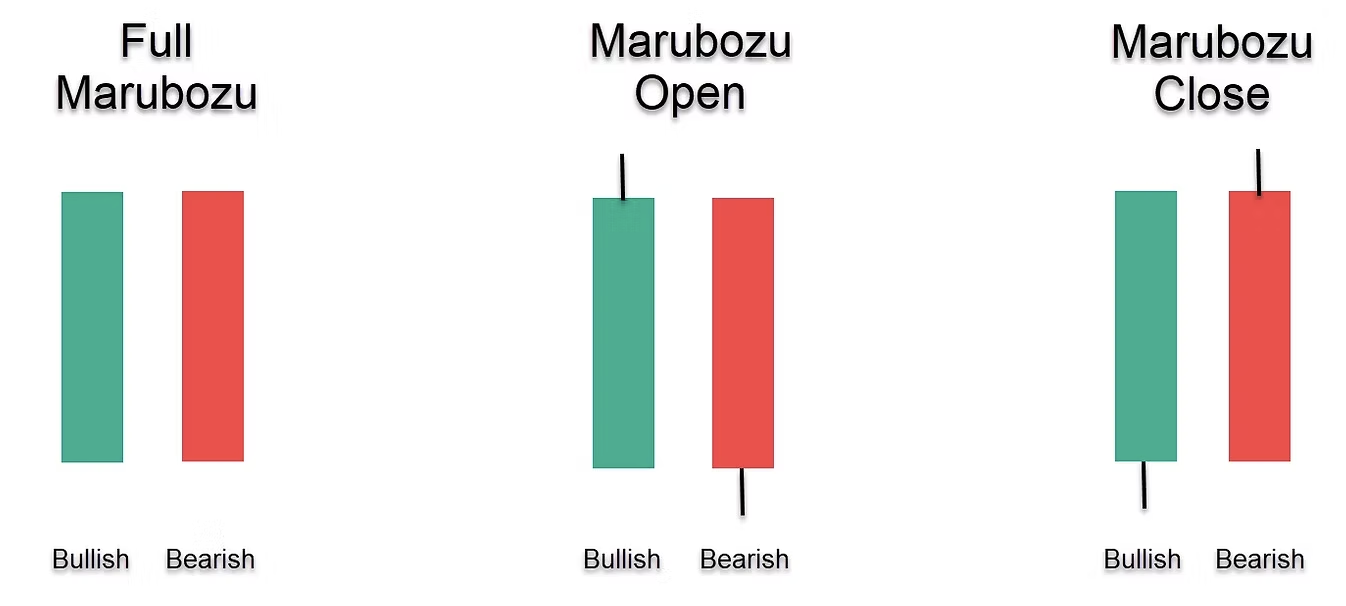
7. Bullish and Bearish Marubozu Pattern
The Marubozu candlestick pattern is a powerful tool for beginner traders learning to read price action. It’s a single candlestick that tells a compelling story of market conviction and momentum, making it a valuable addition to any beginner’s arsenal of candlestick patterns. Its simplicity and clear signals make it easy to identify and interpret, even for those just starting their trading journey.
The Marubozu, meaning “bald” or “shaven head” in Japanese, is characterized by its long body and the absence of, or very minimal, upper and lower shadows (wicks). This distinctive appearance reflects the complete dominance of either buyers or sellers during the trading period. There are two types of Marubozu candles:
-
Bullish Marubozu: A long green (or white) candle with no, or very small, shadows. The opening price is equal to the low, and the closing price is equal to the high. This indicates that buyers controlled the entire session, pushing the price higher from the opening bell to the close.
-
Bearish Marubozu: A long red (or black) candle with no, or very small, shadows. The opening price is equal to the high, and the closing price is equal to the low. This shows that sellers were in complete control, driving the price down throughout the session.
How it Works: The Marubozu’s strength lies in its depiction of strong market sentiment. The lack of shadows signifies that one side (buyers or sellers) was so dominant that the price moved in a single direction with little resistance. This strong momentum often indicates a potential continuation of the trend.
Examples of Successful Implementation:
- Tesla (2020-2021 Rally): During its significant rally, Tesla stock formed multiple Bullish Marubozu candles. These often preceded further price gains, demonstrating the pattern’s predictive power in a strong uptrend.
- S&P 500 (February 2022): A Bearish Marubozu appeared on the S&P 500 chart on the day Russia invaded Ukraine, reflecting the strong selling pressure and market fear triggered by the geopolitical event.
- Bitcoin: This volatile cryptocurrency frequently displays Marubozu patterns during strong trend days, showcasing the pattern’s relevance across various markets.
Actionable Tips for Readers:
- Trend Confirmation: A Bullish Marubozu in an uptrend strengthens the continuation signal, while a Bearish Marubozu in a downtrend suggests further selling pressure.
- Reversal Caution: If a Marubozu appears counter to the prevailing trend, wait for confirmation from subsequent candles before acting on a potential reversal. Don’t rely solely on a single Marubozu for reversal signals.
- Support/Resistance: Use the body of the Marubozu as potential support or resistance levels for future price action.
- Partial Positions: Consider taking partial profits or entering positions in stages, as strong moves like those signaled by a Marubozu can experience short-term retracements.
Pros:
- Clear indication of market conviction and momentum.
- Easy to identify on any timeframe.
- Provides a clear direction of market sentiment.
- Can signal both continuation and potential reversal opportunities.
Cons:
- Perfect Marubozus (with absolutely no shadows) are relatively rare.
- Can sometimes signal overextended markets prone to pullbacks.
- Requires context from surrounding price action and other indicators for accurate interpretation.
The Marubozu candlestick pattern deserves its place on this list of candlestick patterns for beginners because of its clear signals and ease of identification. It provides valuable insight into market sentiment and potential future price movements, making it a useful tool for traders of all levels, especially beginners looking to understand basic price action. While pure Marubozus are uncommon, even those with minimal shadows can provide valuable trading signals when considered within the broader market context. Using the Marubozu in conjunction with other technical analysis tools can significantly enhance your trading strategy.
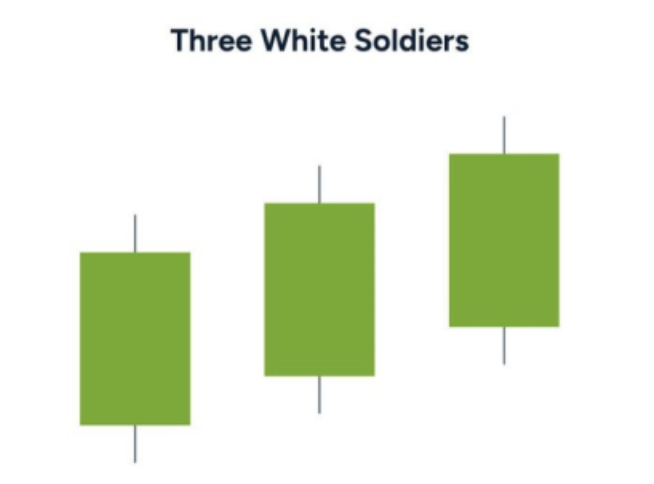
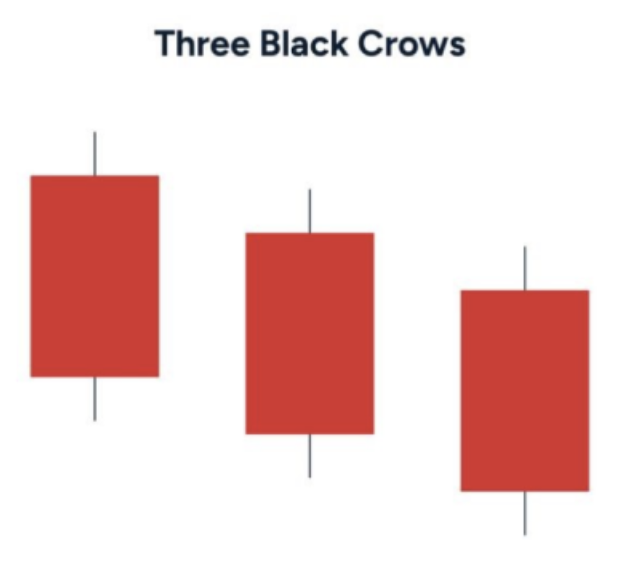
8. Three White Soldiers and Three Black Crows Pattern
The Three White Soldiers and Three Black Crows patterns are essential candlestick patterns for beginners to understand because they provide a strong visual cue of potential trend continuation. These patterns are easy to spot and can offer valuable insights into the prevailing market sentiment. They are particularly useful for beginners learning to interpret price action and identify high-probability trading setups.
These powerful three-candle continuation patterns vividly illustrate strong momentum in a developing trend. The Three White Soldiers pattern consists of three consecutive bullish candles, each opening within the previous candle’s body and closing higher than the previous close. This pattern suggests sustained buying pressure and is a bullish signal. Conversely, the Three Black Crows pattern, its bearish counterpart, shows three consecutive bearish candles, each opening within the previous candle’s body and closing lower. This pattern signifies persistent selling pressure and is a bearish signal. Both patterns suggest strong conviction in the new trend direction.
Features:
- Three consecutive candles in the same direction (bullish or bearish)
- Each candle opens within the previous candle’s body
- Each candle closes beyond the previous candle’s close
- Minimal or decreasing shadows, demonstrating conviction
- Often appears after a period of consolidation or at the beginning of a new trend
Pros:
- Strong indication of trend momentum and conviction
- Clearly visible on charts of any timeframe
- Provides defined entry points for trend continuation
- High reliability when properly formed and in appropriate context
Cons:
- Can indicate overextended conditions when candles are too large
- Somewhat subjective in defining the “opening within previous body” requirement
- May trap traders in false breakouts during ranging markets
- Less common than single or two-candle patterns
Examples:
- Apple stock showed a Three White Soldiers pattern in April 2020 during its recovery from the pandemic lows, preceding further gains.
- Crude oil futures displayed Three Black Crows in early March 2020 as prices collapsed during the pandemic’s onset.
- Gold formed a textbook Three White Soldiers formation in July 2019 before a major bull run.
Tips for Using Three White Soldiers and Three Black Crows:
- Look for moderate, not overly extended, candles. Excessively long candles may indicate exhaustion.
- Ideal Formation: The pattern is most reliable when the opening of each candle is near the middle of the previous candle’s body.
- Shadow Strength: Diminishing shadows from the first to the third candle add to the pattern’s strength.
- Volume Confirmation: Watch volume—increasing volume through the pattern confirms momentum.
- Caution after Extended Moves: Be cautious when the pattern forms after a strong extended move, as it may indicate exhaustion.
These patterns are valuable for novice traders learning candlestick patterns for beginners, as well as experienced traders seeking confirmation of trend continuation. Learn more about Three White Soldiers and Three Black Crows Pattern
These concepts were popularized by Japanese rice traders, the originators of candlestick methodology. Steve Nison introduced and popularized Japanese candlestick patterns in Western financial markets, and technical analyst Thomas Bulkowski provided statistical analysis on the pattern’s reliability. Understanding these patterns can be a crucial step for anyone, from beginners to professionals, seeking to navigate the complexities of financial markets and achieve consistent profitability. They offer a clear, visual representation of market sentiment and can help traders identify potential entry and exit points with increased confidence.
Key Features Comparison of 8 Candlestick Patterns
| Pattern | ⭐ Effectiveness / Quality | 🔄 Implementation Complexity | ⚡ Resource Requirements | 📊 Expected Outcomes | 💡 Ideal Use Cases | 💡 Key Advantages |
|---|---|---|---|---|---|---|
| Doji Candlestick Pattern | ⭐⭐ Moderate – signals indecision, needs confirmation | 🔄 Low – simple single candle recognition | ⚡ Low – needs confirmation indicators | 📊 Potential trend reversal signals, but many false positives | At support/resistance, trend reversals | Easy to spot, works on multiple timeframes |
| Hammer and Hanging Man Pattern | ⭐⭐⭐ Good – strong reversal signals with context |
🔄 Low – single candle pattern | ⚡ Low – confirmation advised | 📊 Bullish or bearish reversals depending on trend context | Trend reversal points | Clear entry/stop-loss levels, easy identification |
| Engulfing Pattern | ⭐⭐⭐⭐ High – one of most reliable reversal patterns |
🔄 Low – requires two consecutive candles | ⚡ Moderate – confirmation with volume advised | 📊 Reliable reversals with clear sentiment shift | After extended trends | Strong visual signal, defined entry/exit points |
| Morning Star and Evening Star | ⭐⭐⭐⭐ High – powerful three-candle reversals |
🔄 Moderate – needs tracking three candles | ⚡ Moderate – longer confirmation time | 📊 Highly reliable reversal at major tops/bottoms | Major market tops/bottoms | Clear pattern flow, strong confirmation signals |
| Shooting Star and Inverted Hammer | ⭐⭐ Moderate – early reversal warning but less reliable alone | 🔄 Low – single candle pattern | ⚡ Low – confirmation needed | 📊 Potential short-term reversals | Key resistance/support areas | Easy to identify, provides early reversal alerts |
| Harami Pattern | ⭐⭐ Moderate – weaker than Engulfing, needs confirmation | 🔄 Low – two-candle pattern | ⚡ Low – requires additional confirmation | 📊 Indicates trend exhaustion or potential reversal | Trending markets | Less aggressive entries, clear stop-loss points |
| Bullish and Bearish Marubozu | ⭐⭐⭐ Moderate to high – indicates strong momentum | 🔄 Low – single candle | ⚡ Low – simple identification | 📊 Signals strong trend continuation or possible reversal | Trending markets | Clear market conviction, easy to identify |
| Three White Soldiers and Three Black Crows | ⭐⭐⭐⭐ High – strong trend continuation indication |
🔄 Moderate – requires observing three candles | ⚡ Moderate – confirmation with volume advisable | 📊 Confirms strong momentum and trend continuation | Emerging or developing trends | Highly reliable, visually distinct pattern |
Level Up Your Trading with Candlestick Mastery
This article has equipped you with a foundational understanding of eight essential candlestick patterns for beginners: the Doji, Hammer, Hanging Man, Engulfing, Morning Star, Evening Star, Shooting Star, Inverted Hammer, Harami, Marubozu, Three White Soldiers, and Three Black Crows. These patterns provide valuable insights into market sentiment and potential price reversals, allowing you to anticipate market movements and make more informed trading decisions. Mastering these candlestick patterns for beginners is a cornerstone of effective technical analysis, helping you identify key support and resistance levels and ultimately improve your trading accuracy.
The most significant takeaway is that these patterns are not standalone signals. Their power is amplified when combined with other technical indicators and a comprehensive trading strategy. Consistent practice and analysis are crucial for correctly identifying these patterns and interpreting their implications within the broader market context. Whether you’re a novice just starting, an intermediate trader seeking consistency, or an experienced professional refining your skills, understanding these patterns empowers you to make smarter, more strategic trades and work towards location-independent, flexible income.
Don’t stop here! Want to delve deeper into price action trading and master advanced candlestick techniques? Colibri Trader offers comprehensive educational resources and proven strategies to unlock your full trading potential, building upon the candlestick patterns for beginners you’ve learned here.
Learn one Price Action strategy that works. No experience needed. Start today