Master the Bullish Pin Bar: Key Trading Strategies
The Anatomy of a Powerful Bullish Pin Bar
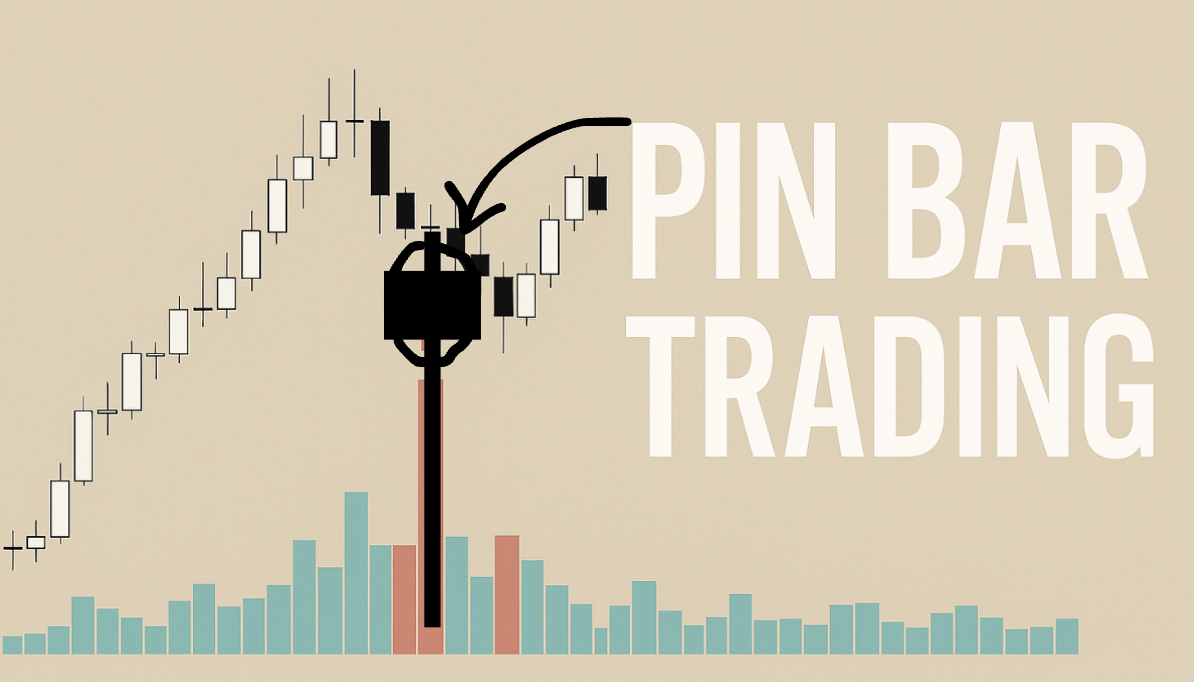
A bullish pin bar is a powerful price action pattern suggesting a potential reversal from bearish to bullish momentum. It’s a single candlestick with a distinct visual signature that tells a story of rejected lower prices. This pattern is important because it offers traders insight into the underlying market psychology.
Deconstructing the Bullish Pin Bar
The key elements of a bullish pin bar are:
- Long Lower Shadow (or Wick): This represents the initial downward push in price, where sellers initially held control. This selling pressure, however, was ultimately rejected. This rejection is the cornerstone of the bullish pin bar formation. The longer the shadow, the stronger the rejection, and the more significant the potential reversal.
- Small Real Body: The small real body, representing the difference between the opening and closing prices, shows that the price recovered considerably from its lows. It typically closes near its opening price. This demonstrates the increasing strength of the buyers who stepped in and drove prices upward.
- Minimal or Absent Upper Shadow: A short or non-existent upper shadow further emphasizes the buyers’ increasing dominance. This indicates that once buyers took control, there was minimal selling pressure left.

The Psychology Behind the Pattern
The bullish pin bar often signals a shift in market sentiment. Imagine an auction where sellers attempt to lower the price. Buyers then aggressively step in, rejecting these lower prices, and bidding the price back up. This suggests a potential turning point in the market.
Traders sometimes refer to this activity as “smart money” entering the market. This doesn’t guarantee future price increases, but it does highlight a notable shift in buying and selling pressure. The appearance of a bullish pin bar, especially in conjunction with other confirming indicators, can provide valuable context for trading decisions.
Identifying Bullish Pin Bars Across Timeframes
Bullish pin bars appear across various timeframes, from short-term charts like the 5-minute to longer-term daily charts. While the basic anatomy remains consistent, their interpretation can vary. On a daily chart, a bullish pin bar might form over a 24-hour period, while on a 5-minute chart, it forms within just 5 minutes.
Recognizing the pattern across different timeframes is crucial. Consider the pin bar’s size relative to the surrounding price action. A larger pin bar generally implies a stronger signal. Even smaller pin bars can be significant if they appear at key support levels or within established trends.
Bullish Pin Bars Through Market History
The bullish pin bar is a familiar sight on trading charts. It has subtly shaped trading decisions for generations, long before the advent of online trading platforms. Its history dates back centuries, possibly originating with Japanese rice traders.
These early traders, acutely aware of price fluctuations, likely understood the importance of sharp price rejections, a concept that foreshadows our modern interpretation of the bullish pin bar. This historical perspective highlights the enduring nature of market psychology and the persistent relevance of price action.
From Rice Paddies to Digital Screens
As financial markets evolved, the bullish pin bar remained significant. This consistency speaks to the core principles it embodies – the ongoing struggle between buyers and sellers and the subsequent changes in market sentiment. From the vibrant trading floors of the past to today’s electronic exchanges, the pattern has served as a remarkably reliable signal.
This continuity underscores the fundamental market dynamics at play – the interaction between buyers and sellers and the resulting momentum shifts.
Bullish Pin Bars at Key Moments
Analyzing historical market bottoms across different assets reveals the bullish pin bar’s presence at critical junctures. For instance, following market crashes, the appearance of this pattern often signaled the start of substantial recoveries, presenting lucrative opportunities for those who recognized and acted on these signals.
During the 2008 global financial crisis, many markets suffered steep declines followed by periods of rebound. Traders who identified and traded on bullish pin bars capitalized on substantial price swings as markets stabilized and began to recover. Discover further insights about bullish pin bars here. This historical performance emphasizes the pattern’s ability to identify high-probability trading opportunities.

The Continuing Significance of the Bullish Pin Bar
By appreciating the bullish pin bar’s resilience through different market conditions—bubbles, crashes, and everything in between—traders can gain confidence in its ongoing value. While it isn’t a foolproof predictor of future price movements, its historical persistence suggests it’s still a useful tool for traders.
Learning to recognize and interpret these patterns can provide a significant edge in understanding today’s markets. This knowledge equips traders to make more informed choices based on an understanding of past market activity.
Spotting High-Probability Bullish Pin Bar Setups
Not all bullish pin bars are created equal. Some shine with profit potential, while others flicker like false signals. This section helps you discern the difference, transforming a simple candlestick pattern into a powerful trading signal.
Context is King: Location, Location, Location
A bullish pin bar’s location matters. Imagine a support zone as prime real estate. A bullish pin bar appearing there carries significant weight compared to one found in a ranging market’s “no man’s land.” Support zones anticipate strong buying pressure, making reversals more likely.
The dominant trend direction also plays a crucial role. In a downtrend, a bullish pin bar hints at a potential reversal. Conversely, in an uptrend, it likely signals a temporary pullback.
Confirmation Through Volume
Volume acts like a market amplifier. Increased volume during a bullish pin bar’s formation, especially in the upward move creating the small real body, shows aggressive buyers entering the market. This volume surge validates the price rejection indicated by the long lower shadow.
Pin Bar Proportions: The Ideal Shape
A pin bar’s shape also matters. The lower shadow’s length relative to the real body indicates the price rejection’s strength. A lower shadow at least two to three times longer than the real body is ideal. A minimal or absent upper shadow, suggesting limited selling pressure after the rejection, further strengthens the signal.
Using the Bullish Pin Bar Decision Tree
To visually guide your evaluation of bullish pin bars, we’ll use the following decision tree. It simplifies pin bar analysis into a clear, actionable framework, visualizing decision criteria and outcomes.
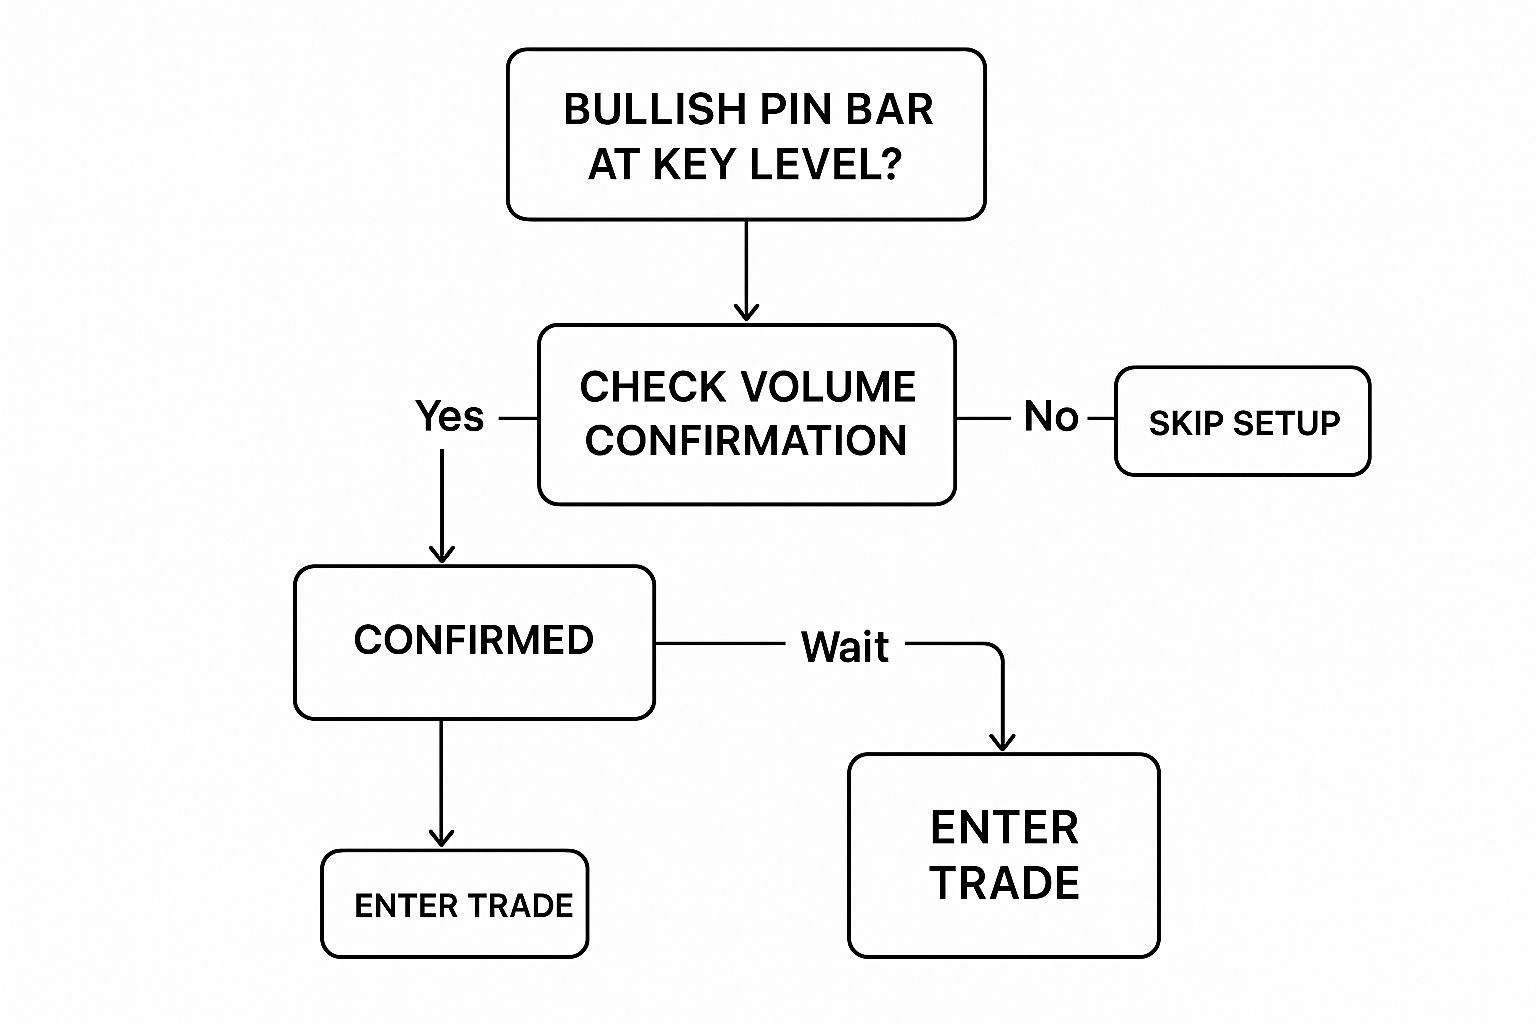
This decision tree streamlines the evaluation process. Starting at the top, each decision point leads to a specific outcome, ultimately judging the pin bar’s potential. Following the tree helps systematically analyze any bullish pin bar, determining its likelihood of success. For instance, a pin bar at a support level, aligned with the dominant trend, and showing confirming volume is likely a high-probability setup. Conversely, the infographic helps identify lower probability opportunities, avoiding potentially unprofitable trades.
To further clarify the characteristics of different quality pin bars, let’s examine this comparison table:
Bullish Pin Bar Quality Assessment Criteria
This comparison table shows the key characteristics that differentiate high-probability bullish pin bars from lower-quality formations.
| Characteristic | High-Quality Pin Bar | Medium-Quality Pin Bar | Low-Quality Pin Bar |
|---|---|---|---|
| Location | At major support or resistance | Within a minor pullback or consolidation zone | In the middle of a ranging market or against the prevailing trend |
| Volume | Significantly increased volume during pin bar formation | Moderate volume increase | Low or decreasing volume |
| Lower Shadow Length | At least 2-3 times the length of the real body | Approximately equal to the real body length | Shorter than the real body |
| Upper Shadow | Minimal or absent | Short upper shadow present | Long upper shadow, indicating selling pressure |
| Trend Alignment | Aligns with the dominant trend direction or signals a potential reversal | May align with short-term trend but not long-term | Against the dominant trend direction |
As this table summarizes, the strongest bullish pin bar signals occur where several positive factors converge.
Entry, Exit, and Money Management With Bullish Pin Bars
This section connects the dots between spotting bullish pin bars and actually profiting from them. We’ll delve into how seasoned traders turn pattern recognition into consistent wins. This involves grasping multiple entry methods, setting precise stop-loss orders, and using smart profit-taking strategies.
Entry Strategies: Timing Your Move
Several different entry methods exist for trades based on bullish pin bars. Each one caters to different risk appetites and market situations.
- Aggressive Entry: Jump into the market right as the pin bar closes, expecting an immediate price surge upwards. This maximizes potential profits but also increases risk. It works best in strong trending markets.
- Conservative Entry: Wait for the next candle to close above the pin bar’s high. This added confirmation lowers the risk of false signals, but you may miss out on some profit. Ideal for uncertain or range-bound markets.
- Breakout Entry (Retest): Occasionally, the price dips slightly after a pin bar forms, retesting the pin bar’s high. This provides a lower-risk entry point with the potential for larger gains and increased confirmation.
Stop-Loss Placement: Protecting Your Capital
A clearly defined stop-loss order is crucial for managing risk. It limits potential losses if the trade moves against you. Place your stop-loss just below the low of the pin bar’s lower shadow, where the price rejection happened.
For instance, if a bullish pin bar forms with a low of $10, set your stop-loss slightly below, perhaps at $9.95. This buffer accounts for standard market fluctuations.
Profit-Taking Methods: Securing Your Gains
Just as important as entries and stop-losses, profit-taking strategies help you lock in profits. Here are some common methods:
- Fixed Target: Set a predetermined profit target based on technical analysis or a specific risk-reward ratio. If your stop-loss is 5 cents below the pin bar low, you might target 15 cents above the pin bar high for a 3:1 risk-reward ratio.
- Trailing Stop: A trailing stop automatically moves upward as the price increases, locking in profits during the trade. This method can help you capture more of a significant price movement.
- Support/Resistance Levels: Using established support and resistance levels as profit targets aligns with broader market dynamics, increasing the likelihood of a reversal or price consolidation at those points.
Chart-Based Walkthroughs: Applying the Concepts
Let’s look at a hypothetical example. Picture a bullish pin bar forming on the daily chart of a stock at a significant support level. A conservative trader might wait for the next candle to close above the pin bar’s high before entering long. Their stop-loss would sit just below the pin bar’s low, while their profit target could be a known resistance level above the entry point. This demonstrates a well-constructed bullish pin bar strategy.
By understanding these entry, exit, and money management principles, you can trade bullish pin bars with increased confidence. This knowledge translates pattern recognition into consistent profitability.
Creating A Bullish Pin Bar Trading System
The true power of bullish pin bars comes into play when combined with other technical analysis tools. Professional traders recognize this and build robust, multi-factor systems to improve their win rates and profit potential. This layered approach filters out weaker setups and identifies exceptional opportunities. This section will show you how to create your own customized bullish pin bar trading system designed for your personal risk tolerance and trading style.
Combining Bullish Pin Bars With Other Indicators
Several combinations can enhance the reliability of bullish pin bar signals. Let’s examine some of the most effective strategies:
- Fibonacci Retracement Levels: Bullish pin bars appearing at key Fibonacci retracement levels, like 38.2%, 50%, or 61.8%, often indicate strong potential reversals. These levels represent areas where price retracements may find support or resistance. A bullish pin bar at these junctures suggests buyers are entering the market at these established levels.
- Momentum Divergence: Momentum oscillators, such as the Relative Strength Index (RSI) or the stochastic oscillator, can confirm bullish pin bar signals. If the price creates a lower low while the RSI forms a higher low, it signifies bullish divergence, indicating weakening bearish momentum. A bullish pin bar during this divergence adds to the potential for a price reversal.
- Moving Average Interactions: Price interacting with key moving averages, like the 20-day, 50-day, or 200-day moving averages, gives additional context to bullish pin bars. A bullish pin bar forming after a pullback to, or bounce off of, a key moving average can signal a trend continuation.
- Volume Analysis: Volume confirms price action. Increased volume as a bullish pin bar’s real body forms validates price rejection and shows strong buying pressure. This lends additional weight to the signal.

Case Studies: Confluence of Factors
Traders look for a confluence of factors using these tools to boost the overall signal strength. A bullish pin bar at the 50% Fibonacci retracement level, combined with bullish momentum divergence and rising volume, creates a high-probability setup. This combination indicates underlying buying pressure and a likely price reversal.
Another example is a bullish pin bar near the 200-day moving average, with confirming volume and a preceding “hammer” candlestick pattern. This confluence suggests a potential long-term reversal or a continued uptrend. Multi-factor setups increase the chance of a successful trade.
To help understand these confirmation tools, let’s take a look at the following table:
Bullish Pin Bar Confirmation Tools
This data table presents various technical indicators that can be combined with bullish pin bars to strengthen trading decisions.
| Confirmation Tool | What It Measures | Ideal Confirmation Signal | Reliability Rating (1-5) |
|---|---|---|---|
| Fibonacci Retracement Levels | Support/Resistance Areas | Bullish Pin Bar at 38.2%, 50%, or 61.8% levels | 4 |
| Momentum Divergence (RSI, Stochastic) | Momentum Shifts | Bullish Divergence with Lower Price Low and Higher Oscillator Low | 3 |
| Moving Average Interactions | Trend Direction and Support/Resistance | Bullish Pin Bar bouncing off a key Moving Average (20, 50, 200-day) | 3 |
| Volume Analysis | Buying/Selling Pressure | Increased Volume during Bullish Pin Bar formation | 5 |
This table summarizes how various indicators can be used to confirm bullish pin bar signals, offering traders different perspectives for analyzing potential trades. The reliability rating is a subjective assessment of how often these tools provide accurate confirmation.
Building Your Custom System
Construct your own bullish pin bar system by combining these elements. Think about your individual risk tolerance and trading style. Are you a conservative or aggressive trader? Do you prefer short-term or longer-term trades? Your answers will guide you towards the tools and combinations that best suit you. A conservative trader might prefer Fibonacci confluence and volume confirmation, while a more aggressive trader might focus on momentum divergence and moving average interactions. Try different strategies and backtest them to discover the optimal approach for your trading objectives.
Avoiding The Costly Mistakes With Bullish Pin Bars
Even seasoned traders can stumble when trading bullish pin bars. This section helps you avoid these common pitfalls through practical analysis. We’ll explore neglecting the broader market, improper position sizing, and psychological biases that can derail even the best plans.
Ignoring The Bigger Picture
One of the biggest mistakes is focusing solely on the bullish pin bar without considering the overall market. A bullish pin bar forming during a strong downtrend might be a bull trap, luring traders into long positions right before the price drops further. Always consider the prevailing trend and look for confirmation from other indicators before entering a trade.
Also, failing to consider major news or economic releases can lead to losses. A seemingly perfect setup can be quickly invalidated by unexpected market volatility. Staying informed about potential market-moving events is critical.
Position Sizing: Walking the Tightrope
Even with a high-probability setup, incorrect position sizing can wipe out profits. Oversizing, or risking too much capital on a single trade, amplifies losses. Imagine risking 10% of your account on one trade. One bad trade could be devastating.
Conversely, undersizing, or risking too little, limits profit potential. Finding the right balance is essential. A common rule is to risk no more than 1-2% of your trading capital on any single trade.
Psychological Pitfalls: Mastering Your Mind
Trading psychology is crucial for success. Fear and greed can lead to costly mistakes. Fear might cause you to exit a winning trade too early, while greed can tempt you to hold onto a losing trade, hoping for a reversal.
Another psychological trap is confirmation bias. This is the tendency to favor information that confirms your existing beliefs while ignoring contradictory evidence. For example, a trader might overemphasize the bullish pin bar signal and downplay other indicators suggesting a continued downtrend.
Learning From Mistakes: Post-Mortem Analysis
Analyzing past trades, both wins and losses, is crucial for improvement. Ask yourself: What went wrong? Did I ignore warning signs? Did emotions influence my judgment? Honest self-assessment helps refine your strategy and avoid repeating mistakes.
For example, imagine entering a long trade based on a bullish pin bar near a resistance level. The price reverses, triggering your stop-loss. Post-trade analysis might reveal you overlooked the resistance level, focusing only on the pin bar. This insight can prevent similar future mistakes.
By understanding and addressing these pitfalls, you can trade bullish pin bars with more discipline and consistency, leading to improved trading performance and long-term profitability.
Ready to elevate your trading?
Master This Little-Known Price Action Trading Strategy Today