




10 Best Indicators for Swing Trading You Should Know
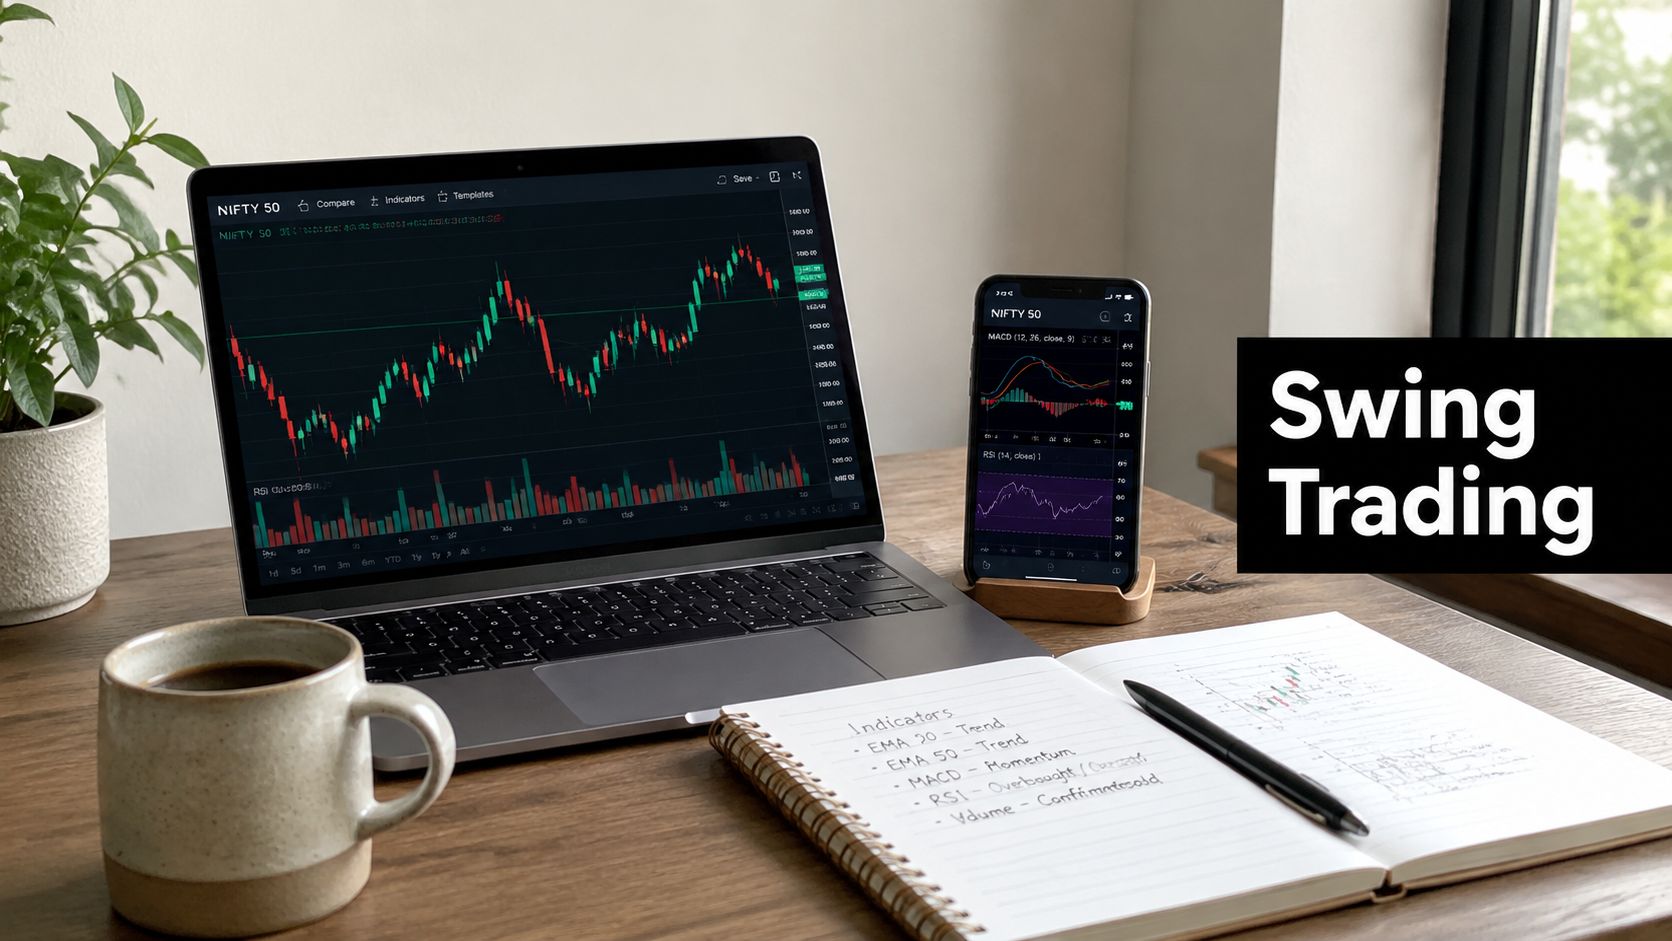
You're probably looking at a chart right now, adding indicators one by one, and wondering why the setup gets less clear instead of more useful. That's a common stage in swing trading. New traders often think the answer is to stack more tools. In practice, the best indicators for swing trading usually help when each one has a specific job.
Swing trading works best when you treat indicators as filters, not fortune tellers. One tool can help you define trend. Another can help you judge momentum. A third can help you manage volatility or confirm whether a breakout has real participation behind it. That's a lot more practical than searching for one perfect signal.
A useful starting point is simple. Major trading education sources consistently include moving averages, volume, RSI, MACD, and the stochastic oscillator among the core tools for swing trading because the method is about catching smaller moves inside broader trends, not predicting every turn in advance. IG's guide to swing trading indicators explains that moving averages smooth price data, EMA reacts faster than SMA, and MACD tracks the relationship between moving averages.
If you're still learning chart structure, it helps to pair indicators with raw candles and price zones. This guide on understanding crypto candlesticks is a good companion before you start combining signals.
1. Relative Strength Index (RSI)
RSI is one of the first indicators swing traders learn, and for good reason. It's simple to read, it moves on a fixed scale from 0 to 100, and it gives you a quick sense of whether momentum is stretched. In common practice, RSI is read as overbought above 70 and oversold below 30 when traders look for possible swing entries or exits, not guaranteed reversals. Forex Tester's overview of swing indicators notes those thresholds as part of the classic momentum-oscillator approach.

A practical example helps. Suppose a stock pulls back into a support zone after several up days. Price prints a rejection candle, and RSI dips below 30 before curling back up. That doesn't mean you buy just because the indicator reached an extreme. It means you now have momentum exhaustion lining up with a place on the chart where buyers may step in.
How to use RSI without getting trapped
The biggest beginner mistake is treating RSI extremes as automatic reversal signals. In a strong trend, RSI can remain high or depressed longer than generally anticipated. That's why swing traders usually get better results when they combine RSI with structure.
- At support: Look for RSI weakness to appear where price has already reached a prior demand area.
- At resistance: If RSI pushes above 70 while price is running into old highs, be more cautious about chasing.
- On divergence: If price makes a higher high but RSI makes a lower high, momentum may be fading.
A lot of traders use divergence in trading as the true edge with RSI, not just the overbought and oversold labels.
Practical rule: RSI works better as a timing tool inside a chart idea you already trust.
2. Moving Average Convergence Divergence (MACD)
MACD is useful when you want to see both trend direction and momentum shift in one view. It compares two moving averages and shows whether momentum is strengthening, weakening, or crossing from one side of the market to the other. Traders often watch the signal-line crossover, the histogram, and the zero line together.
This indicator is especially helpful when a market has already been trending and you want to judge whether a pullback is ending or whether a trend is losing energy. A bullish crossover near support after a measured pullback can be a cleaner swing entry than buying a random green candle in the middle of a move.
What MACD is really good at
MACD tends to shine when price is moving with some structure. If a stock has been stair-stepping higher and then pauses near the 21 EMA, a fresh bullish crossover can support a continuation trade. If price is pressing into resistance while the histogram starts shrinking, that can warn you that upward momentum is fading even before a full reversal shows up.
Try reading MACD in layers:
- Crossover: Shows a possible momentum shift.
- Histogram: Shows whether momentum is accelerating or slowing.
- Zero line: Helps frame the broader side of the market.
Here's a realistic scenario. A market breaks above a consolidation range, pulls back, then forms a higher low. MACD turns up again and the histogram expands. That's often more useful than taking the first breakout candle, because the pullback gives you a clearer invalidation point.
MACD is less helpful in messy, sideways price action. In choppy markets, it can flip back and forth and create a string of weak signals.
3. Bollinger Bands
Bollinger Bands help you read volatility, not just direction. The bands expand when price becomes more volatile and contract when price quiets down. That makes them useful for two very different swing-trading jobs. One is spotting potential breakouts from compression. The other is finding stretched moves that may snap back toward the middle band.

A common setup looks like this. Price trades in a tight range for several sessions, and the bands narrow. Then volume expands, price breaks the range, and the bands start widening. That change in volatility can support a swing entry if the breakout also clears a clean resistance level.
Two ways traders use Bollinger Bands
Some traders use the bands as a mean-reversion tool. Others use them for breakout timing. Both can work, but only if the chart context fits.
- Mean reversion: Price touches or pierces the outer band at a major support or resistance zone, then fails to continue.
- Breakout trading: Bands contract during consolidation, then expand as price leaves the range.
- Targeting: The middle band often becomes a reference point during pullbacks or snapback trades.
If you want practical examples, these Bollinger Band strategies show why the bands are most useful when they're tied to structure, not used in isolation.
A good example is a lower-band touch at a weekly support area after a fast selloff. If the next candle reclaims part of the range and volume improves, that may offer a swing long. But if price keeps riding the lower band in a hard downtrend, fading it too early can be expensive.
4. Stochastic Oscillator
The stochastic oscillator is another momentum tool, but it behaves a bit differently from RSI. It compares the closing price to a recent price range and is commonly interpreted as overbought above 80 and oversold below 20. Those levels are widely used by swing traders to spot possible turning points, especially when price is already at an important chart zone.
Stochastic is often sharper and more reactive than RSI. That can be a benefit when you want earlier warnings. It can also be a drawback in noisy charts because it may produce more frequent turns that never lead to a meaningful move.
Where stochastic fits best
This indicator tends to work well in swing ranges and orderly pullbacks. If a market has been moving between clear support and resistance, stochastic can help you time entries closer to the edge of that range instead of chasing the middle.
A realistic example would be a currency pair rallying into prior resistance. Price stalls, prints a rejection wick, and stochastic is already above 80 and curling down. That doesn't force a short trade, but it strengthens the case that upside momentum may be tiring at a logical resistance zone.
Use it with restraint:
- Look for location first: Support or resistance should matter more than the oscillator itself.
- Wait for turns from extremes: A cross in the middle of the range is often less useful.
- Watch divergence: If price extends but stochastic doesn't confirm, momentum may be weakening.
Because stochastic can be sensitive, it's often better as a timing aid than as your main reason for taking a trade.
5. Average True Range (ATR)
ATR doesn't tell you whether price will go up or down. That's exactly why it's so useful. It measures volatility, which makes it one of the best indicators for swing trading if your real problem is bad stop placement, oversized positions, or entering when the market is too wild for your plan.
Many traders focus only on entries. ATR helps with the part that often matters more. Where should the stop go so normal price movement doesn't knock you out? If a stock's daily swings have expanded, a tight stop that worked last month may now sit in the middle of ordinary noise.
ATR improves trade management
Suppose you buy a breakout after a period of tight consolidation. If ATR starts increasing, that tells you price is beginning to move with more range. You might still take the trade, but you'd size it more carefully and place the stop where normal volatility won't trigger it too quickly.
Here's where ATR earns its place:
- Stop placement: It helps you place stops beyond normal fluctuations instead of at random round numbers.
- Position sizing: Higher volatility usually calls for smaller size.
- Breakout context: Rising ATR can confirm that a quiet market is waking up.
A practical example is a swing setup on a strong earnings gap continuation. The chart may look bullish, but if ATR is high, entering with your usual size can expose you to larger swings than your account can comfortably handle. ATR won't fix a bad setup, but it can stop a decent setup from becoming a poorly managed trade.
6. Volume Profile and Volume Rate of Change
Volume answers a different question from momentum indicators. It asks whether traders are participating in the move. That matters in swing trading because breakouts with weak participation often fail, and reversals with no real interest behind them can fade just as quickly.
Volume Profile shows where the heaviest trading happened across price levels. Volume Rate of Change, or VROC, helps you see whether current volume is increasing or cooling compared with a recent baseline. Together, they help you judge both location and urgency.
A simple example: price approaches a level where heavy trading happened in the past. That area often acts like a decision zone because many traders already did business there. If price breaks through it and VROC expands, the move may have better odds of following through than a breakout on quiet volume.
Here's a visual explainer worth watching before you try to use these tools live:
What volume adds that oscillators don't
Volume won't tell you the exact turning point, but it can tell you whether a move has conviction.
- High-volume nodes: These can act as support or resistance because many traders transacted there.
- Low-volume areas: Price may move more quickly through these zones.
- Breakout confirmation: Rising volume often makes a breakout more credible than price movement alone.
A useful real-world scenario is a stock pressing against resistance for several sessions. If it finally closes above resistance with expanding volume, that breakout is often more interesting than one that barely clears the level on quiet participation.
7. Fibonacci Retracement Levels
Fibonacci retracement levels are popular because they give traders a structured way to think about pullbacks. They don't predict where price must reverse. They help you map areas where a retracement may end and the main trend may resume.
Swing traders usually draw Fibonacci from a meaningful swing low to swing high in an uptrend, or from swing high to swing low in a downtrend. Then they watch whether the pullback aligns with prior support, prior resistance, a moving average, or a recognizable price pattern.
Why Fibonacci works best as a zone
The mistake is treating each level like a laser-precise price. Markets rarely reverse to the exact tick and then politely move away. It's better to treat Fibonacci as an area of interest.
A practical example is an uptrend that breaks a major resistance level and then pulls back. If the retracement lands around a common Fibonacci zone and that same area was prior resistance, now potential support, you have confluence. Add a strong candle rejection there, and the setup becomes much more actionable.
You can use Fibonacci in several ways:
- Pullback entries: Look for trend continuation after a retracement into a key area.
- Confluence: Give more weight to levels that overlap with support, resistance, or moving averages.
- Targets: Extension levels can help frame where a completed swing might run.
Fibonacci is less about magic ratios and more about organizing your attention around likely reaction areas.
8. Ichimoku Cloud
Ichimoku Cloud can look intimidating because it puts several lines and a shaded cloud on the chart at once. But the logic is cleaner than it first appears. It helps you read trend, momentum, and support or resistance in one system.
For swing traders, the cloud can be useful when you want a quick answer to a practical question. Is price above value, below value, or stuck in the middle? Price above the cloud generally suggests strength. Price below it suggests weakness. Price inside it often means conditions are mixed.
How swing traders simplify Ichimoku
You don't need to use every line equally. Many traders focus on three things:
- Price versus the cloud: This gives broad trend context.
- Tenkan-sen and Kijun-sen: Their cross can hint at momentum shifts.
- Cloud thickness: Thicker cloud zones can act as stronger support or resistance areas.
A practical example is a market that has been ranging, then breaks above the cloud while the faster line crosses above the base line. That can support a swing long if the breakout also clears a prior resistance zone. On the other hand, if price is trapped inside the cloud, many traders wait because the market hasn't shown clear direction.
Ichimoku is often best for traders who like one cohesive framework instead of combining several separate indicators.
9. Support and Resistance Levels
Support and resistance aren't optional in swing trading. They're the map. Most indicators make more sense only after you've marked the zones where price has previously reacted.
Support is an area where buyers have stepped in before. Resistance is where sellers have shown up before. These aren't always exact lines. They're often zones. That matters because swing trades usually fail when traders expect perfect precision in an imperfect market.

Why these zones matter more than any indicator
A support zone gives context to an oversold RSI reading. A resistance zone gives context to a weakening MACD histogram. Without those zones, many indicator signals are just random wiggles on a chart.
A very common swing setup looks like this. Price breaks above resistance, runs for a bit, then pulls back to test the breakout area. If that former resistance now acts as support and buyers defend it, the retest can offer a cleaner entry than the original breakout candle.
For traders still learning the basics, this guide on how to identify support and resistance is directly relevant because these levels anchor almost every indicator-based decision.
The market doesn't need to reverse at your exact line. It only needs to react in your zone.
10. Price Action Patterns
Price action patterns aren't indicators in the platform menu, but they belong in any serious discussion of the best indicators for swing trading because they often tell you when an indicator signal is significant. A stochastic cross at random is weak. A stochastic cross that forms during a double bottom at support is a different story.
Patterns translate crowd behavior into repeatable structures. Flags often show brief pauses in trend. Triangles can show compression before expansion. Double tops and double bottoms can show failed attempts to continue. Head and shoulders can show trend exhaustion.
Patterns give you trade structure
A good pattern does three useful things at once. It gives you an entry trigger, an invalidation point, and a logical target area. That's why many swing traders eventually lean more on pattern recognition and use indicators only for confirmation.
A practical example is a triangle forming under resistance during an uptrend. If price keeps making higher lows while sellers repeatedly defend the same ceiling, pressure can build. A breakout with volume and supportive momentum can create a swing entry with the opposite side of the pattern acting as a risk reference.
Patterns to focus on first:
- Break and retest: One of the clearest continuation setups.
- Double bottom or top: Useful around major support or resistance.
- Flags and wedges: Good for trend continuation and exhaustion reads.
- Head and shoulders: Often watched for reversal structure.
New traders often try to memorize dozens of patterns. It's better to get very good at a small group and read them in context.
Top 10 Swing Trading Indicators Comparison
| Tool / Indicator | Complexity 🔄 | Resource needs ⚡ | Expected outcomes 📊 | Ideal use cases 💡 | Key advantages ⭐ |
|---|---|---|---|---|---|
| Relative Strength Index (RSI) | Low, single oscillator, easy to implement | Low, price data only; available on all platforms | Momentum shifts, overbought/oversold signals and divergences | Swing reversals at S/R; confirming price action setups | Simple, widely available, effective in ranges and trends |
| Moving Average Convergence Divergence (MACD) | Low–Medium, multiple EMAs and histogram interpretation | Low, common indicator on most terminals | Trend direction, momentum shifts, crossover signals | Timing entries/exits in trending swings and breakout confirmation | Clear crossover/histogram cues; good trend confirmation |
| Bollinger Bands | Low, SMA + std deviation bands, straightforward | Low, needs historical price; standard on platforms | Volatility detection, squeezes, breakout/mean-reversion clues | Volatility breakouts, squeeze setups, mean-reversion entries | Visual volatility channel; identifies breakout potential |
| Stochastic Oscillator | Low, two-line oscillator, easy to read | Low, price history only; common on charts | Overbought/oversold extremes, crossovers and divergences | Momentum reversals at S/R and supply/demand zones | Clear extreme readings and early divergence warnings |
| Average True Range (ATR) | Low, single-line volatility metric | Low, requires high/low/close; lightweight | Volatility sizing, stop-loss distance guidance, breakout confirmation | Risk management, position sizing, stop placement | Essential for adaptive stops and sizing based on actual volatility |
| Volume Profile & VROC | Medium–High, profile construction and VROC analysis | High, needs volume-by-price tools and advanced charting | Identifies institutional S/R, confirms breakouts via volume spikes | Validating supply/demand zones and breakout reliability | Volume-based S/R and confirmation; reveals institutional activity |
| Fibonacci Retracement Levels | Low, draw between swings; rule-based ratios | Low, only swing points and price history required | Probable retracement and extension zones for entries/targets | Entry timing on retracements; projecting profit targets | Objective math-based levels that often coincide with market behavior |
| Ichimoku Cloud | High, five components, multi-factor interpretation | Medium, standard data but requires learning to read | Comprehensive trend, dynamic S/R, and momentum context | All-in-one trend analysis on higher timeframes and confirmations | Multi-faceted view combining trend, momentum, and S/R zones |
| Support and Resistance Levels (S/R Zones) | Low–Medium, subjective zone identification | Low, price history, optionally volume for confirmation | Core entry/exit zones, role reversals, clear stop/profit areas | Foundation for all swing trading setups and pattern trades | Fundamental, universal framework for objective trade placement |
| Price Action Patterns (Chart Patterns) | Medium, recognition skill and multi-timeframe context | Low, price charts and practice; no indicators required | Repetition-based reversal/continuation signals with defined risk | Trading patterns at S/R: break-and-retest, flags, H&S, triangles | Objective structure with clear stops/targets when validated |
Final Thoughts
The best indicators for swing trading don't work because they're popular. They work when each one solves a specific problem on your chart. RSI and stochastic can help with timing. Moving averages and MACD can help with trend confirmation. ATR can help with risk. Volume can help confirm whether a breakout or reversal has real participation behind it. Support, resistance, and price patterns tie all of it together.
That's also why using too many tools usually makes trading worse, not better. One practical guideline from market education sources is to keep the chart to two or three indicators so you don't create redundant signals or overfit your decisions. Lakshmishree's swing trading indicator guide also points to a practical combination many traders use: a trend filter such as an EMA pair like 21 and 55, paired with RSI(14) for short-term exhaustion.
There's another issue many articles skip. A lot of content lists RSI, MACD, moving averages, Bollinger Bands, and stochastic as the “best” tools without showing which ones hold up after trading costs and false signals are considered across different conditions. VectorVest's discussion of indicator usefulness highlights that gap clearly. That matters because many indicators are derivative and lag price, and they behave very differently in trends than they do in sideways markets.
One more detail is worth keeping in mind. A quantitative backtest cited by Forex Tester ranked Williams %R as the best of the tested swing-trading indicators on a risk-adjusted basis and noted that it had the lowest average max drawdown among the indicators evaluated, ahead of Stochastics and IBS as a more stable choice. I didn't include it in the main ten because most beginners get more practical mileage first from RSI, MACD, moving averages, volume, and support-resistance work. But it's a reminder that “popular” and “best in every market” aren't always the same thing.
If you're building a swing-trading process, keep it simple. Mark the trend. Mark the key zones. Add one momentum tool and one volatility or volume tool. Then study how those signals behave in real charts. If you prefer a price-action-first approach, Colibri Trader is one relevant place to continue learning because its educational material focuses heavily on chart structure, support and resistance, and practical execution.
If you want to sharpen your chart reading and build a cleaner swing-trading process, Colibri Trader offers price-action based education that can help you connect indicators, support and resistance, and real trade execution without overcomplicating your charts.