


Best Chart Patterns for Day Trading: Top Strategies for 2025
Unlocking Day Trading Profits with Chart Patterns
Want to improve your day trading success? This listicle reveals six of the best chart patterns for day trading, helping you spot profitable setups and navigate volatile markets. Learning to identify these patterns is key to making informed trading decisions. We'll cover the Bull Flag, Double Bottom, Triangles (Symmetrical, Ascending, Descending), Head and Shoulders, Cup and Handle, and Engulfing Candlestick patterns, providing you with practical tools to enhance your day trading strategy. Master these best chart patterns for day trading and start seeing improved results.
1. Bull Flag Pattern
The Bull Flag pattern is a powerful continuation pattern frequently used by day traders to identify potential breakouts in an ongoing uptrend. It signifies a brief pause in a strong upward price movement, offering an opportunity to enter a trade with the prevailing trend. This pattern gets its name from its resemblance to a flag on a pole – a sharp vertical rise (the flagpole) followed by a period of consolidation (the flag). This consolidation often appears as a downward sloping or sideways channel, representing a temporary equilibrium between buyers and sellers before the uptrend potentially resumes. This makes it a valuable tool for those looking to capitalize on “best chart patterns for day trading.”

The Bull Flag pattern is characterized by several key features. First, a significant price increase, the "flagpole," establishes the initial upward momentum. This is followed by the "flag," a period where the price consolidates within a relatively narrow range. The flag usually slopes downwards or sideways, counter to the preceding uptrend. Critically, trading volume typically diminishes during the flag formation, indicating a decrease in selling pressure. The pattern is considered complete when the price decisively breaks above the upper resistance line of the flag, signaling a potential resumption of the uptrend.
This pattern's strength lies in its ability to offer clear entry and exit points, often accompanied by favorable risk-to-reward ratios. For day traders, its relatively quick formation (within minutes or hours) makes it highly applicable. Moreover, the Bull Flag pattern can be observed across various timeframes and markets, enhancing its versatility. For instance, a tech stock might experience a 3% jump in the first hour of trading on positive earnings news (the flagpole), then consolidate for 30-45 minutes (the flag) before breaking higher. Similarly, a currency pair like EUR/USD could make a strong upward move following positive economic data, then form a tight consolidation before continuing its upward trajectory.
However, like any trading pattern, the Bull Flag has its drawbacks. False breakouts, where the price breaks above the flag but fails to sustain the upward movement, can occur. Therefore, confirming the breakout with increasing volume is crucial. Additionally, distinguishing a Bull Flag from a potential reversal pattern in its early stages can be challenging. Furthermore, the pattern's success rate tends to diminish in choppy or ranging markets.
To effectively utilize the Bull Flag pattern, consider these tips: Enter a long position when the price breaks above the flag's upper resistance line, accompanied by a surge in volume. Place stop-loss orders below the flag's lower support line to limit potential losses. Profit targets can be estimated by measuring the height of the flagpole and projecting that distance from the breakout point. Finally, look for decreasing volume during the flag's consolidation phase and a significant increase in volume upon breakout.
The Bull Flag pattern earns its place among the best chart patterns for day trading due to its clear structure, potential for quick profits, and applicability across various markets. Learn more about Bull Flag Pattern for further insights into pullback trading strategies. By understanding its features, benefits, and limitations, traders can effectively integrate this pattern into their day trading strategies.
2. Double Bottom Pattern
The Double Bottom pattern is a powerful tool in the arsenal of day traders looking for reliable reversal signals. As one of the best chart patterns for day trading, it indicates a potential shift from a downtrend to an uptrend. This pattern, resembling the letter "W," forms when the price of an asset drops to a certain level twice, creating two distinct bottoms at approximately the same price, with a peak (called the neckline) forming in between. It signals that selling pressure might be weakening and buying interest could be re-emerging. Day traders utilize this pattern to pinpoint potential buying opportunities as a downtrend loses momentum.
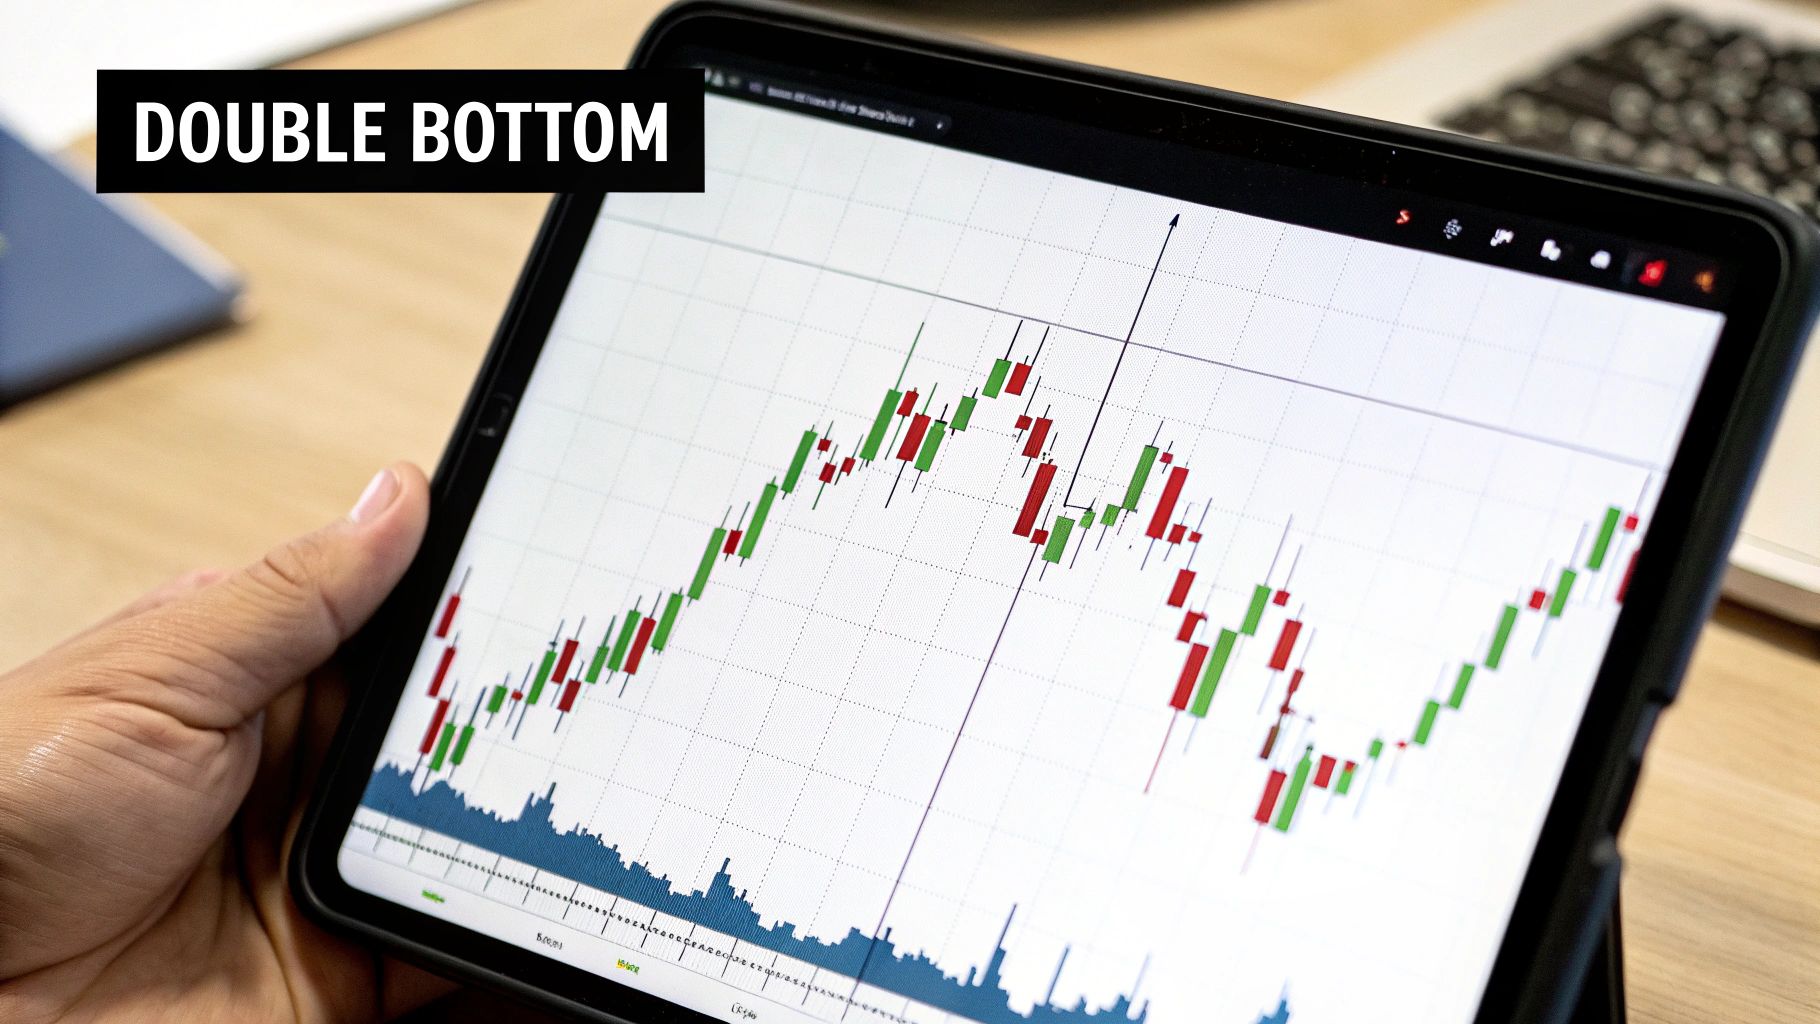
The Double Bottom pattern is formed after a significant downtrend, signifying a potential exhaustion of sellers. The two bottoms represent support levels where buyers stepped in to prevent further price decline. The neckline represents resistance that needs to be broken for confirmation of the reversal. A breakout above the neckline, accompanied by increased trading volume, is crucial for validating the pattern and signaling a potential upward movement. This pattern's inherent characteristics provide day traders with clear entry and exit points, making it a valuable tool for managing risk and maximizing profit potential.
For example, imagine the SPY ETF experiencing a morning selloff, forming a double bottom pattern before reversing course for afternoon gains. Or consider Apple stock testing a key support level twice during a trading session, bouncing off it each time before finally rebounding. These scenarios illustrate the practical application of the Double Bottom pattern in real-time trading.
Pros:
- Strong Reliability: When confirmed with a volume-backed breakout, the Double Bottom offers a high probability of a successful trade.
- Clear Risk Management: The second bottom serves as a well-defined stop-loss level, limiting potential losses.
- Significant Upward Movement: Successful breakouts often lead to substantial price increases.
- Increased Reliability with Time: The longer the pattern takes to form, the more reliable it becomes.
Cons:
- Time-Consuming Formation: Development can sometimes extend beyond a single trading day.
- False Breakouts: Breakouts without sufficient volume confirmation can lead to misleading signals.
- Ineffectiveness in Volatility: The pattern's clarity diminishes in highly volatile market conditions.
- Difficulty in Differentiation: Can be mistaken for consolidation patterns, requiring careful analysis.
Tips for Utilizing the Double Bottom Pattern:
- Volume Confirmation: Always confirm the pattern with a breakout above the neckline accompanied by a surge in trading volume.
- Stop-Loss Placement: Position stop-loss orders just below the second bottom to minimize risk.
- Price Target Projection: Measure the distance between the bottoms and the neckline and project that same distance upward from the neckline to estimate a potential price target.
- Diminishing Volume: Look for decreasing volume on the second bottom compared to the first, indicating weakening selling pressure.
The Double Bottom pattern's effectiveness has been documented by technical analysts like Thomas Bulkowski and is featured in classic texts such as "Technical Analysis of Stock Trends" by Edwards and Magee. Learn more about Double Bottom Pattern This pattern deserves a prominent place among the best chart patterns for day trading due to its strong reversal signal, clear risk management parameters, and potential for significant profits. It’s a valuable tool for traders of all levels, from novices learning price action to experienced professionals seeking consistent returns.
3. Triangles (Symmetrical, Ascending, Descending)
Triangle patterns are among the best chart patterns for day trading because they offer a potent combination of frequency, clear entry and exit points, and the potential for substantial price moves within a single trading session. These consolidation formations occur when price action narrows, creating a distinct triangle shape on the chart. This narrowing represents decreasing volatility and suggests a build-up of energy that often precedes a significant breakout. Day traders value triangles as they provide a structured approach to anticipating and capitalizing on these explosive price movements.
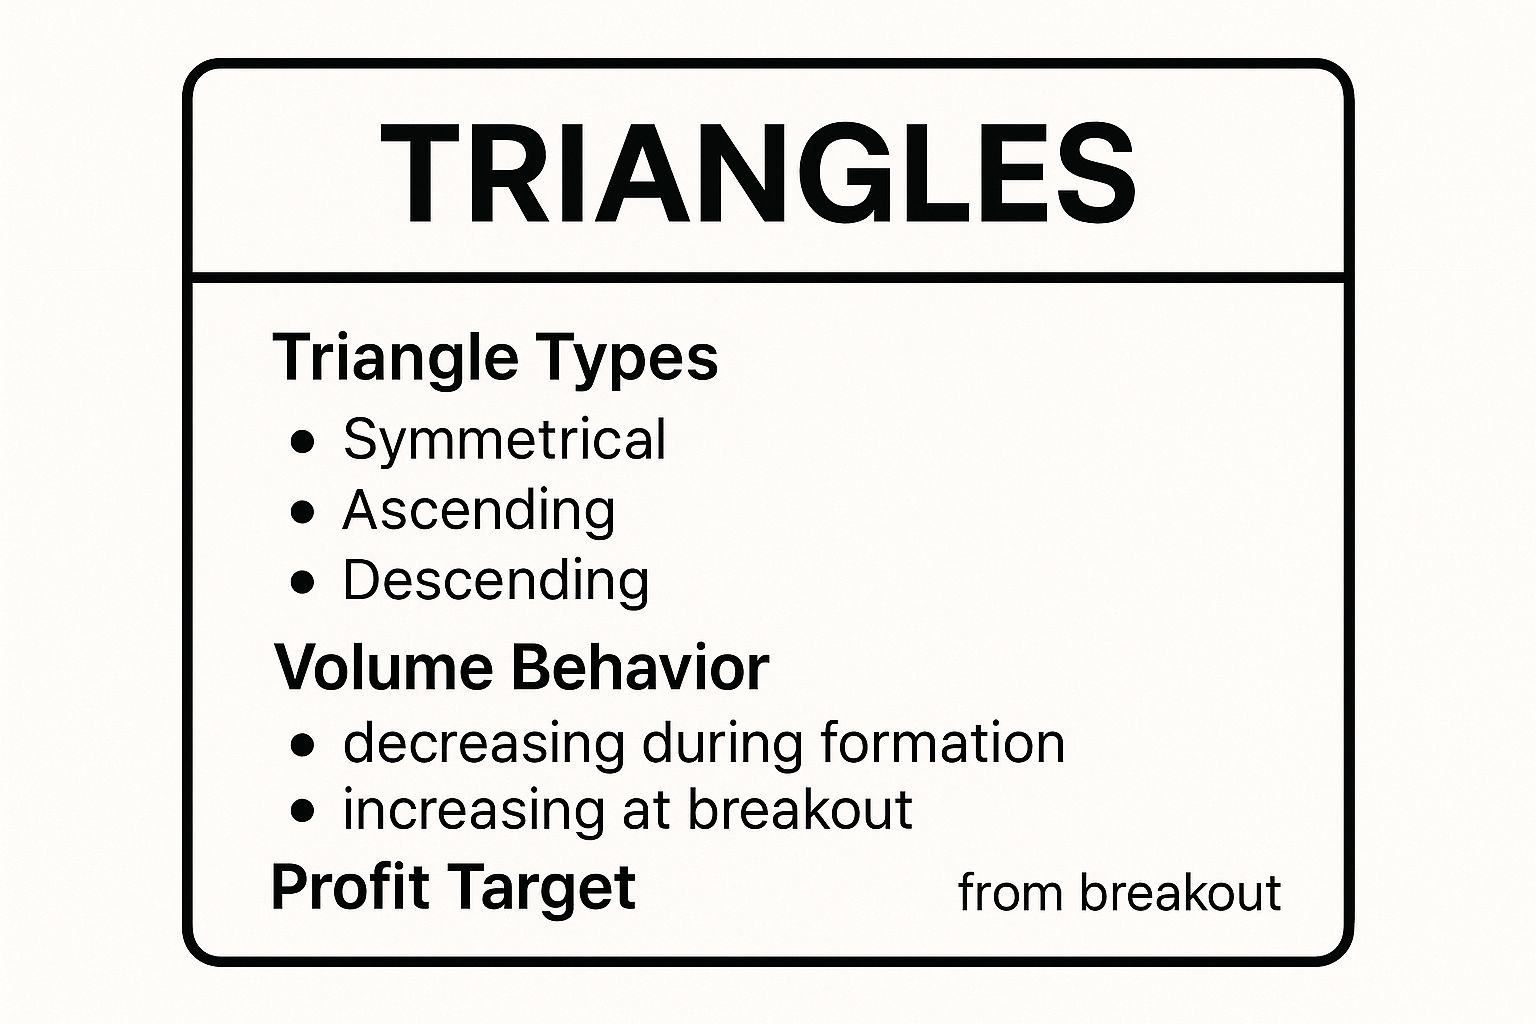
The infographic above provides a quick reference guide to the three main types of triangles. As you can see, each type features distinct trendlines and implies different underlying market dynamics. Understanding these nuances is crucial for accurate interpretation and successful trading.
There are three primary types of triangles: symmetrical, ascending, and descending. Each has unique characteristics:
- Symmetrical Triangle: Converging trend lines with similar slopes suggest a balance between buying and selling pressure. The breakout direction is less predictable in this type of triangle.
- Ascending Triangle: A horizontal upper resistance line combined with a rising lower support line typically indicates accumulation and suggests a potential upward breakout.
- Descending Triangle: A horizontal lower support line coupled with a declining upper resistance line usually indicates distribution and points towards a possible downward breakout.
All triangle patterns are characterized by decreasing volume during formation and a surge in volume upon breakout, confirming the move's validity.
Pros:
- Frequent Occurrence: Triangles appear frequently across various markets and timeframes, providing ample trading opportunities.
- Clear Entry and Exit Points: The breakout from the triangle's boundaries offers well-defined entry points, while the opposite side of the triangle provides a logical stop-loss placement.
- Predictive Potential: Triangles can signal both continuation and reversal patterns, adding flexibility to trading strategies.
Cons:
- False Breakouts: Triangles, especially symmetrical ones, are susceptible to false breakouts, particularly near the apex.
- Uncertain Breakout Direction: Predicting the breakout direction can be challenging, especially with symmetrical triangles.
- Low-Momentum Moves: Sometimes, breakouts can lack momentum, resulting in minimal profit potential.
Examples:
- Tesla stock consolidating mid-day, forming a symmetrical triangle, before breaking higher on increased volume.
- USD/JPY forming an ascending triangle at a key resistance level before breaking through during active trading hours.
Tips for Trading Triangles:
- Confirm Breakout with Volume: Enter trades only when the price breaks definitively beyond the triangle's boundary with a corresponding increase in volume.
- Strategic Stop-Loss Placement: Position your stop-loss order just inside the opposite side of the triangle to minimize risk.
- Project Price Targets: Measure the height of the triangle at its widest point and project that distance from the breakout point to estimate a potential price target.
- Optimal Formation Stage: Look for triangles that are 50-75% complete for the highest probability of a reliable breakout.
- Apex Caution: Exercise caution when breakouts occur near the apex of the triangle, as false signals are more common in this area.
Popularized By:
Triangle patterns were initially identified by Charles Dow, a pioneer of technical analysis. John Murphy later elaborated on these patterns in his influential works on the subject.
This video provides a visual walkthrough of trading triangle patterns, offering further insights into identifying and capitalizing on these powerful formations. Triangles deserve a prominent place on the list of best chart patterns for day trading due to their regular appearance, well-defined parameters for entry and exit, and the potential for significant price movements within a single trading day. They are a valuable tool for traders of all levels seeking to improve their market timing and profit potential.
4. Head and Shoulders Pattern
The Head and Shoulders pattern is a classic chart pattern prized by traders for its potential to predict trend reversals. Among the best chart patterns for day trading, it stands out for its clear structure and relatively straightforward application. This powerful pattern, when identified correctly, offers valuable insights into shifting market sentiment and provides opportunities for both entering short positions and exiting long positions. It works by visually representing a waning uptrend, where buying pressure weakens and eventually gives way to selling pressure.

The pattern is characterized by three distinct peaks: two shoulders (left and right) of approximately equal height, flanking a higher peak called the "head." A "neckline" is drawn by connecting the lows between the head and shoulders. Confirmation of the pattern occurs when the price breaks decisively below this neckline after forming the right shoulder, often accompanied by an increase in trading volume. This breakdown signals a potential shift from bullish to bearish momentum. Volume typically decreases as the pattern forms, reflecting the diminishing buying interest, and then spikes on the breakdown, confirming the sellers are taking control.
This pattern deserves a place on the list of best chart patterns for day trading because of its reliability and clear trading signals. It offers well-defined entry, stop-loss, and target levels. The entry point is typically the breakdown below the neckline. The stop-loss can be placed just above the right shoulder, limiting potential losses if the pattern fails. Profit targets are often calculated by measuring the vertical distance between the head and the neckline and projecting that same distance downwards from the neckline breakout point.
Pros:
- Highly recognizable and reliable: Its distinct shape makes it easy to identify, and its historical performance lends it credibility.
- Clear trading signals: Provides clear entry, stop-loss, and profit target levels.
- Significant price movements: Often precedes substantial price declines, offering good profit potential.
- Intraday application: Can form and complete within a single trading day on shorter timeframes.
Cons:
- Timeframe limitations: Might take too long to form on higher timeframes for effective day trading.
- False signals: Can generate false signals in choppy or sideways markets.
- Limited downside: Sometimes the price move following the breakdown is smaller than anticipated.
- Requires patience: Traders must wait for confirmation before entering a trade.
Examples: Imagine Bitcoin rallying throughout the morning but then forming a head and shoulders pattern just before a sharp afternoon decline. Or consider Netflix stock hitting resistance during a trading session, forming a head and shoulders top before retracing its gains. These are typical scenarios where this pattern can provide valuable insights for day traders.
Tips for Using the Head and Shoulders Pattern:
- Confirmation is key: Enter short positions only after the price breaks below the neckline with increased volume.
- Protect your capital: Place stop-loss orders just above the right shoulder.
- Calculate price targets: Project the head-to-neckline distance downwards from the breakout point.
- Look for divergence: Divergence between price and momentum indicators (like RSI or MACD) during the right shoulder formation can strengthen the signal.
- Aggressive entries (with caution): More aggressive traders might consider a partial entry as the right shoulder forms, but with very tight stop-losses.
The Head and Shoulders pattern is a valuable tool for day traders. Popularized by technical analyst Alexander Elder and extensively documented by Edwards and Magee, its enduring presence in trading literature underscores its significance in technical analysis. By understanding its characteristics and applying these practical tips, traders can enhance their ability to identify potential trend reversals and capitalize on profitable shorting opportunities.
5. Cup and Handle Pattern
The Cup and Handle pattern is a classic bullish continuation pattern that earns its place among the best chart patterns for day trading due to its potential for reliable breakouts and clear entry and exit points. Resembling its namesake, this pattern signals a pause in an upward trend (the cup) followed by a slight pullback (the handle) before the price potentially surges higher. It's a favorite among day traders looking for opportunities to capitalize on renewed upward momentum.
How it Works:
The Cup and Handle pattern unfolds in two distinct phases. First, the "cup" forms. This is a U-shaped price movement where the price initially declines, finds a bottom, and then gradually recovers to its previous high. This represents a period of consolidation where selling pressure subsides and buyers begin to regain control. The cup's shape can range from a shallow saucer to a deeper, more rounded bowl.
Next, the "handle" develops. This is a smaller pullback that occurs after the cup has formed. The handle resembles a short, downward-sloping flag or pennant. Crucially, the handle should not retrace more than roughly one-third of the cup's depth. This pullback represents a final shakeout of weaker holders before the anticipated breakout.
Confirmation and Breakout:
The key to successfully trading the Cup and Handle pattern lies in confirmation. A valid breakout occurs when the price decisively breaks above the resistance line formed by the cup's rim, ideally accompanied by a surge in trading volume. This increased volume indicates conviction from buyers and reinforces the likelihood of a sustained upward move.
Examples:
Imagine Amazon stock experiencing a morning dip, then slowly recovering to its opening price, forming the "cup." In the early afternoon, a small pullback creates the "handle." Finally, the price breaks above the morning high with increased volume, signaling a potential entry point for day traders. Similarly, Gold futures might form a cup and handle at a key resistance level intraday, suggesting a potential breakout above that resistance.
Tips for Day Trading with the Cup and Handle:
- Entry: Enter a long position when the price breaks above the cup's rim (or the handle's resistance line) with increased volume.
- Stop-Loss: Place your stop-loss order below the lowest point of the handle. This minimizes potential losses if the breakout fails.
- Price Target: Measure the depth of the cup from rim to bottom and project that distance upwards from the breakout point to estimate a potential price target.
- Volume Analysis: Look for decreasing volume during the cup formation and increasing volume during the handle and, most importantly, the breakout.
- Handle Placement: The ideal handle forms in the upper half of the cup.
Pros:
- Strong Reliability: When properly formed and confirmed, the Cup and Handle offers a high probability of a successful breakout.
- Clear Entry and Exit Points: The pattern provides well-defined points for entering and exiting trades, enhancing risk management.
- Sustained Price Movements: Successful breakouts from Cup and Handle patterns can often lead to substantial price gains.
- Suitable for Day Trading: The pattern can form and complete within a day trading timeframe, especially on shorter timeframes like 5-minute or 15-minute charts.
Cons:
- Timeframe Dependence: On higher timeframes, the pattern may take too long to develop for day trading.
- Handle Extension: The handle can sometimes extend longer or retrace deeper than expected, leading to false breakouts.
- Subjectivity: Identifying the exact rim of the cup can be somewhat subjective.
- Pattern Recognition: Distinguishing the Cup and Handle from other consolidation patterns in the early stages can be challenging.
Popularized By:
The Cup and Handle pattern was popularized by William O'Neil, founder of Investor's Business Daily, and is a key component of his CANSLIM investing strategy. This adds to its credibility among traders.
By understanding the nuances of the Cup and Handle pattern, day traders can add a powerful tool to their arsenal for identifying and capitalizing on potential breakout opportunities. This pattern's combination of reliability, clear entry and exit points, and potential for significant price gains makes it a worthy inclusion in any list of the best chart patterns for day trading.
6. Engulfing Candlestick Pattern
The Engulfing Candlestick Pattern is a cornerstone of price action trading and rightfully earns its place among the best chart patterns for day trading. Its straightforward nature, quick formation, and potent predictive capabilities make it a favorite among traders of all experience levels, from novices just beginning their journey to seasoned professionals. It signals a potential reversal in the prevailing trend, offering day traders a valuable edge in fast-moving markets.
This pattern consists of just two candlesticks. The defining characteristic is the second candle completely "engulfing" the real body of the preceding candle. Note that the engulfing candle doesn't necessarily need to encompass the shadows (wicks) of the previous candle, just the body. There are two types of engulfing patterns:
-
Bullish Engulfing: Forms during a downtrend. A smaller bearish (red or black) candle is followed by a larger bullish (green or white) candle that engulfs the previous candle's body. This suggests that buyers have overwhelmed sellers, potentially signaling an upward reversal.
-
Bearish Engulfing: Forms during an uptrend. A smaller bullish candle is followed by a larger bearish candle that engulfs the previous candle's body. This suggests that sellers have taken control, potentially signaling a downward reversal.
The power of the Engulfing pattern is amplified when it appears at key support/resistance levels, trend lines, or after extended moves. For example, an S&P 500 E-mini futures contract forming a bearish engulfing pattern at resistance after a morning rally could present a lucrative shorting opportunity. Similarly, a bullish engulfing pattern forming on EUR/USD at a support level during the London-New York session overlap could signal a good time to enter a long position.
Pros:
- Speed and Simplicity: Forms quickly, making it ideal for day trading timeframes and easy to identify visually without needing complex indicators.
- Clear Signals: Provides readily apparent trade signals.
- Versatility: Works across various markets and timeframes.
- Synergy with Indicators: Can be combined with other technical indicators (like RSI or volume) for higher probability setups.
Cons:
- False Signals: Can generate false signals, especially in choppy or ranging markets.
- Confirmation Needed: Less reliable without confirmation from volume or other indicators.
- Size vs. Strength: The size of the engulfing candle doesn't always directly correlate with the strength of the subsequent move.
- Context Matters: Its reliability diminishes when it forms in the middle of a range.
Actionable Tips:
- Confirmation is Key: Wait for the second candle to close completely before taking action. This ensures the pattern is valid.
- Stop-Loss Placement: Place stop-loss orders beyond the high/low of the engulfing candle to manage risk.
- Volume as Validation: Look for increased volume on the engulfing candle as it strengthens the signal.
- Strategic Locations: Prioritize engulfing patterns that form at key support/resistance levels or trend lines.
- Indicator Confluence: Combine with momentum indicators like the Relative Strength Index (RSI) for added confirmation.
- Size Matters (Sometimes): While not always the case, a considerably larger engulfing candle relative to the previous candle can indicate a stronger potential move.
Learn more about Engulfing Candlestick Pattern
This pattern was popularized by Steve Nison, who introduced Japanese candlestick patterns to Western traders in his influential book Japanese Candlestick Charting Techniques. The Engulfing Candlestick Pattern is a powerful tool that can enhance the arsenal of any day trader seeking to capitalize on short-term market reversals. Whether you’re a beginner learning the ropes or an experienced trader refining your edge, mastering this pattern can significantly contribute to your success in the dynamic world of day trading.
Top 6 Day Trading Chart Patterns Comparison
| Pattern | Implementation Complexity 🔄 | Resource Requirements 💡 | Expected Outcomes 📊 | Ideal Use Cases 💡 | Key Advantages ⭐⚡ |
|---|---|---|---|---|---|
| Bull Flag Pattern | Moderate – requires volume confirmation and breakout validation | Low – primarily price and volume data | Continuation of strong uptrend | Day trading, trending markets | Clear entry/exit, good risk-reward, quick identification ⭐⚡ |
| Double Bottom Pattern | Moderate – needs neckline breakout and volume confirmation | Low – price and volume monitoring | Reliable trend reversal from downtrend | Identifying reversals after declines | High reliability, clear risk levels, strong reversal signal ⭐ |
| Triangles (Sym., Asc., Desc.) | Moderate to High – multiple triangle types, breakout direction uncertain | Medium – needs pattern recognition and volume | Breakout moves, continuation or reversal | Consolidation breakouts in various markets | Frequent formation, clear stops, flexible pattern ⭐ |
| Head and Shoulders Pattern | High – requires confirmation of neckline breakdown and pattern maturity | Medium – price, volume, and momentum indicators | Trend reversal, mostly bearish | Reversal identification, exit/short signals | Highly reliable reversal, clear targets, recognized widely ⭐ |
| Cup and Handle Pattern | Moderate to High – needs full cup and handle formation and breakout | Medium – volume and price monitoring | Bullish continuation after consolidation | Trending markets, continuation entries | Strong reliability, clear stops/targets, sustained moves ⭐ |
| Engulfing Candlestick Pattern | Low – only two candles, fast formation | Low – candlestick charts and volume | Short-term reversal signals | Quick reversals, any timeframe | Quick to identify, immediate signals, versatile across markets ⭐⚡ |
Ready to Trade with Confidence?
Mastering the best chart patterns for day trading, such as bull flags, double bottoms, triangles (symmetrical, ascending, and descending), head and shoulders, cup and handle, and engulfing candlestick patterns, is crucial for consistent success in the market. These patterns provide valuable insights into potential price movements, allowing traders to anticipate breakouts, reversals, and continuations with greater accuracy. Understanding these six key patterns you've just learned about is a significant step towards building a robust trading strategy. But remember, these are just a few pieces of the puzzle. Proper risk management, emotional discipline, and continuous learning are equally important for long-term success. For day traders seeking to enhance their understanding of market trends and patterns, conducting a thorough backlink analysis can be highly beneficial. This analysis, inspired by the principles outlined in Backlink Analyse: Der Weg zum perfekten Linkprofil from CSW.AGENCY, provides insights into how different websites and information sources are interconnected, revealing potential influences on stock prices and overall market sentiment. By combining technical analysis with a broader understanding of market dynamics, traders can make more informed decisions and improve their overall performance. These skills can empower you to navigate the markets effectively, generating consistent returns and achieving financial freedom. Take control of your financial future and unlock the potential of price action trading. Ready to dive deeper? Colibri Trader offers comprehensive price-action based training programs designed to help you master these and other essential techniques for profitable day trading. Visit Colibri Trader and start your journey towards consistent trading success today.