Partial Profit Taking: The Hidden Maths of a 10R Trade
In my last video, I left you with a question.
If I take half my position off at 1R, let the other half run, and close that second half at 10R, have I really made 10R?
No.
And that’s where the maths behind asymmetric trading becomes far more interesting than the headline.
It’s easy to look at a 10R or 15R move on a chart and think: of course the numbers work, you’re making ten times what you risked. But that isn’t how I manage the trade, and it isn’t what the account actually receives.
So for this article, forget the exciting charts for a moment. If you want to trade this way, you need to understand what happens to the numbers once you include everything: the full losses, the trades that reach 1R and come all the way back, and the occasional runner that keeps going.
Because if asymmetry only works when you cherry-pick the best trade, it doesn’t really work.
How partial profit taking works
Here’s the structure I use, in its simplest form:
- I risk 1R on the full position.
- When price reaches +1R, I close 50% of the position.
- The other 50% stays open as a runner, with the original stop still in place.
That’s it. The interesting part isn’t the rules. It’s what they do to your results over a series of trades.
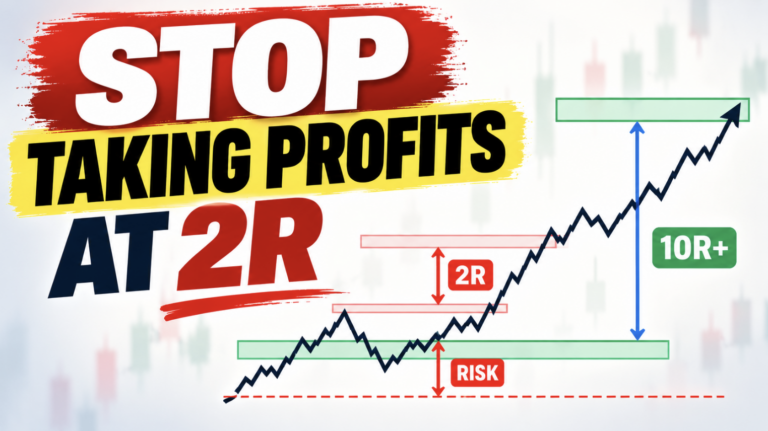
If you’d like the reasoning behind this structure, I explain why I stopped taking profits at 2R in a separate article. This one is about the maths.
Why a 10R trade doesn’t pay 10R
Once you’ve closed half at 1R, only half of your original position is still running. So everything the runner earns counts at half weight.
Total return = (0.5 × 1R) + (0.5 × runner exit)
If the runner exits at 10R:
(0.5 × 1R) + (0.5 × 10R) = 0.5R + 5R = 5.5R
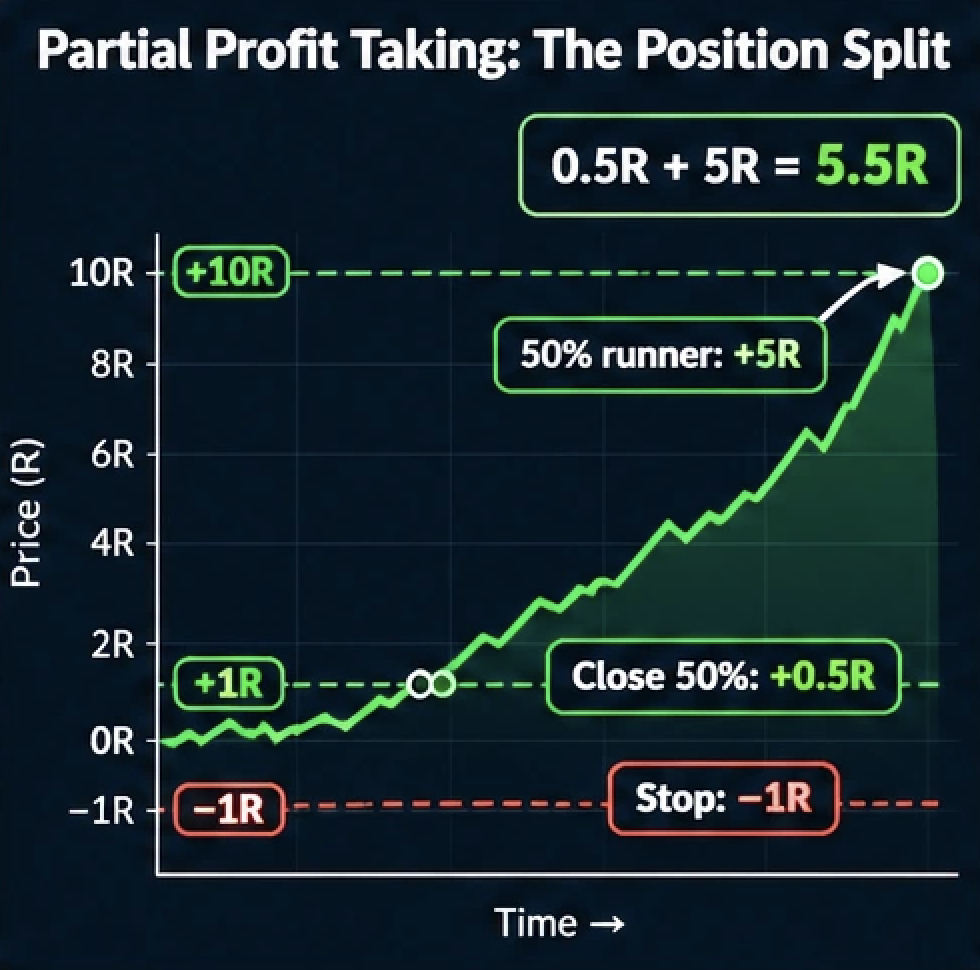
That’s 5.5R on your original risk, not 10R.
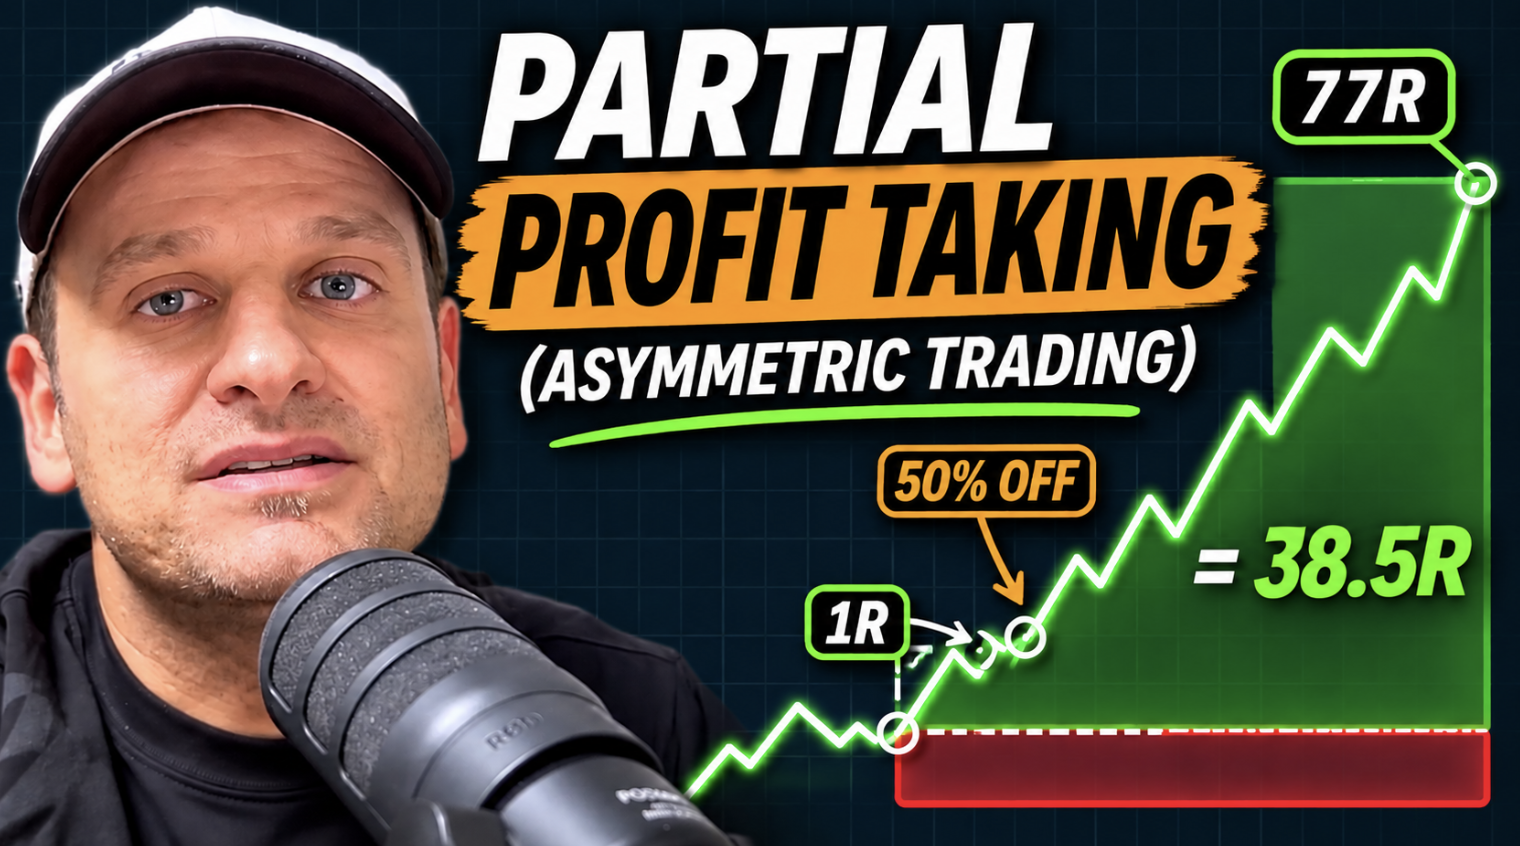
The same applies to bigger moves. One of my best trades travelled 77R. On the whole original position, that’s 39R, not 77R:
(0.5 × 1R) + (0.5 × 77R) = 39R
A remarkable result, and an exceptional one, but still about half of the headline number.
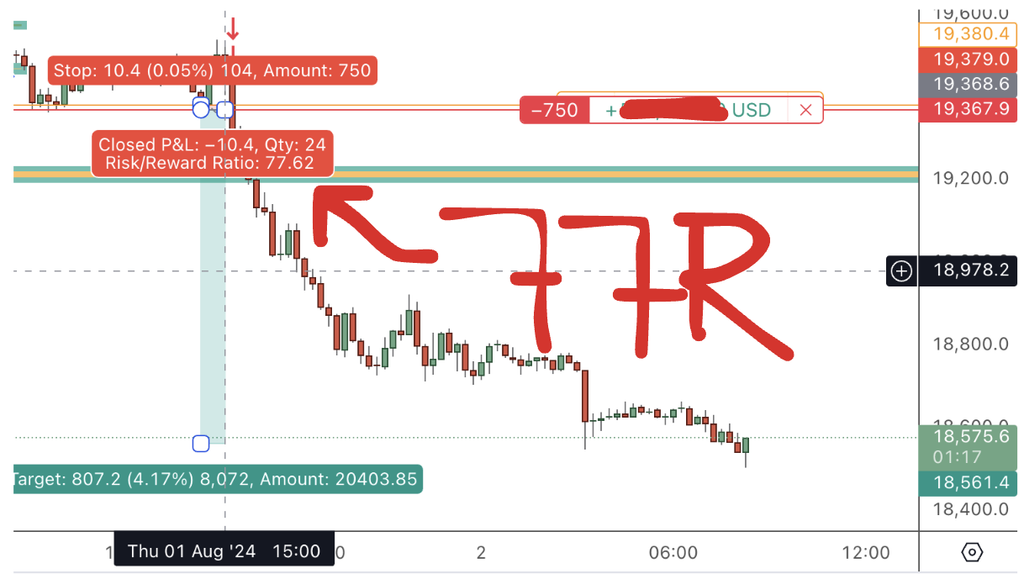
A remarkable result, but half of the headline number. When you read about large R trades, always ask whether the figure describes how far price moved or what the full position actually made.
Five trades, four losses, still profitable
Let’s start with something deliberately uncomfortable.
Imagine five trades. The first four all lose the full 1R.
| Trade | What happens | Result |
|---|---|---|
| 1 | Hits the stop | −1R |
| 2 | Hits the stop | −1R |
| 3 | Hits the stop | −1R |
| 4 | Hits the stop | −1R |
| 5 | Half closed at 1R, runner exits at 10R | +5.5R |
| Total | +1.5R |
That’s four losses in a row. This is usually the point where traders start questioning everything. Is something wrong? Do I need another confirmation? Should I switch strategies?
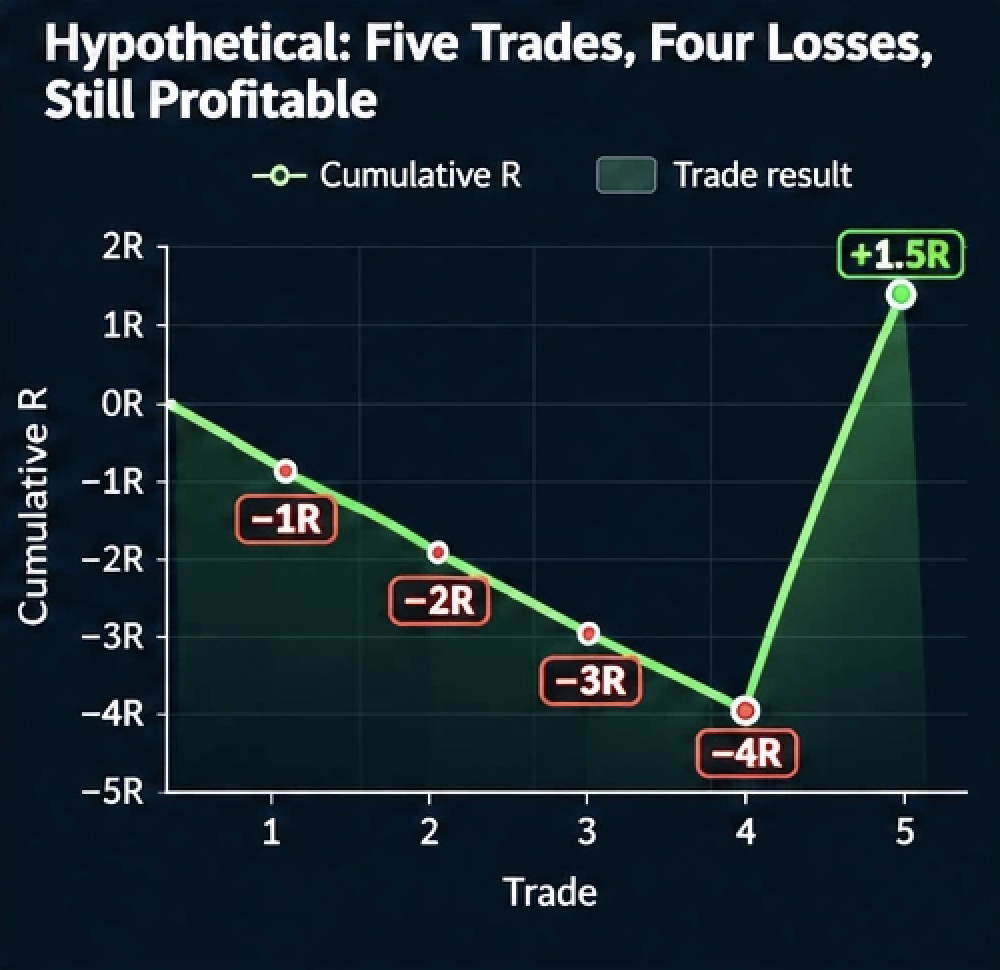
Then trade five reaches 1R. I bank half, which locks in +0.5R. The runner goes on to 10R, adding another +5R.
You lost four times. You had one meaningful winner. And you still finished ahead.
Not because you predicted the market particularly well. Not because of an impressive win rate. But because the relationship between the losses and the exceptional winner was asymmetric.
This is a simplified, hypothetical sequence before trading costs. It shows how the arithmetic works, not what any trader should expect.
The trade most traders overlook: break-even
Real trading isn’t just a string of full losses followed by a big winner. There’s a third type of trade that matters enormously in my approach.
Price reaches 1R. I close half. Then the market turns around and comes all the way back to my original stop.
- First half: +0.5R, already banked
- Runner: −0.5R, stopped out on half the position
Result: 0R. A break-even trade, before costs.
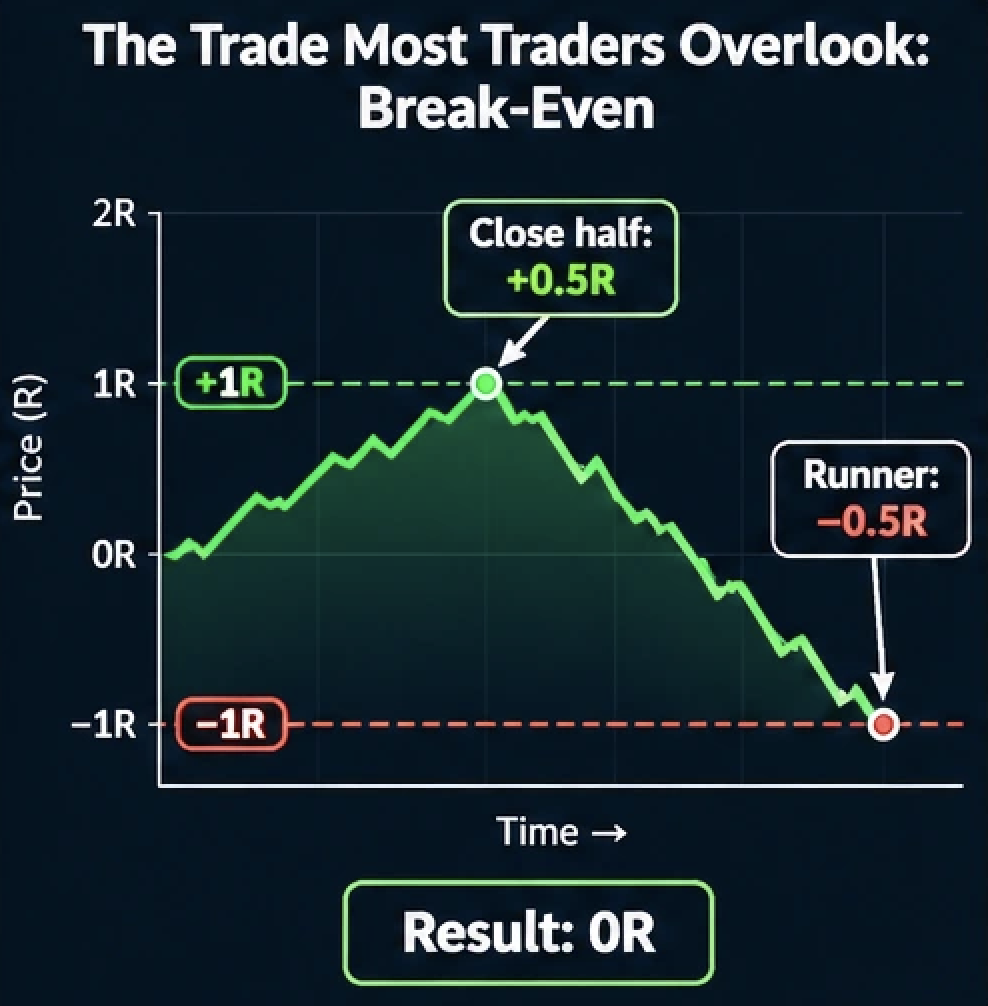
I think this is one of the most misunderstood parts of the framework. I don’t need every trade that reaches 1R to become exceptional. Many of them will do nothing afterwards, and that’s fine.
In my own day trading, a large share of my trades finish around break-even. By my count, it’s roughly 80%. That changes the whole distribution, because it means a big part of my trading neither earns nor costs much, while the full losses and the occasional runner decide the result.
I’ve written about this side of asymmetry in more depth in why break-even trades matter more than you think.
The hidden cost of taking half off
I don’t want to make partial profit taking sound free. It isn’t.
Closing half at 1R changes two things at once:
- Trades that reach 1R and reverse improve from −1R to 0R.
- Trades that run earn about half as much as they would on the full position.
Look at what that means over the same ten trades, managed two different ways. In both cases the stop stays at its original level.
| Ten hypothetical trades | Hold the full position | Take half at 1R |
|---|---|---|
| 4 full losses | −4R | −4R |
| 5 reach 1R, then hit the stop | −5R | 0R |
| 1 runner exits at 10R | +10R | +5.5R |
| Total | +1R | +1.5R |
Here, taking half off wins, because five trades came back after reaching 1R.
Now remove those five trades:
| Five hypothetical trades | Hold the full position | Take half at 1R |
|---|---|---|
| 4 full losses | −4R | −4R |
| 1 runner exits at 10R | +10R | +5.5R |
| Total | +6R | +1.5R |
Now holding the full position wins easily.
So partial profit taking isn’t automatically better. It pays off when a meaningful number of trades reach 1R and then fail. It costs you when most of your winners keep running. The only way to know which describes your trading is to look at your own trade history.
How big does a runner need to be?
Here’s a question worth answering before you trade this way:
If I take half off at 1R, how far must one runner go to cover my losses?
Each full loss costs 1R. One runner earns 0.5R + (0.5 × its exit). To cover L losses, the runner must exit at:
Runner exit needed = (2 × L) − 1
| Full losses to cover | Runner must exit at |
|---|---|
| 1 | 1R |
| 2 | 3R |
| 4 | 7R |
| 6 | 11R |
| 10 | 19R |
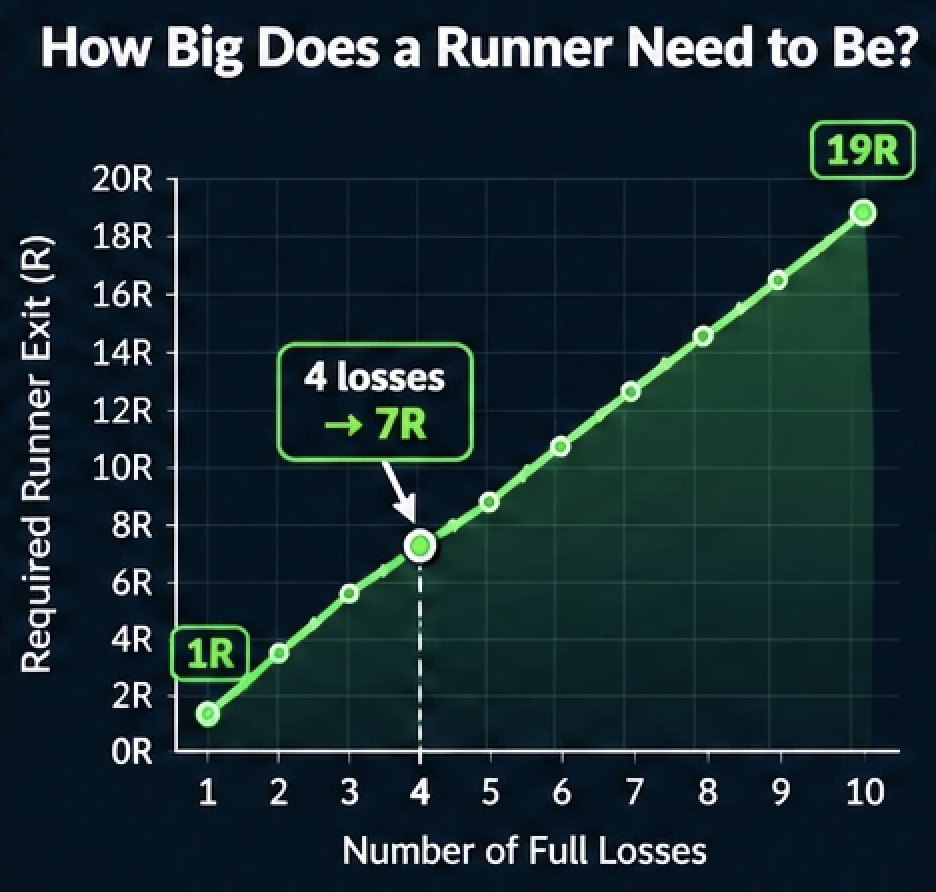
So with four full losses, one runner has to reach 7R just to bring you back to zero, before costs. At 10R, you make a modest profit. That’s why I care far more about how far my runners can go than about how often I win.
It also shows why break-even trades matter. A trade that reaches 1R and comes back costs you roughly nothing, so it doesn’t add to the number of losses your next runner needs to repay.
Think in distributions, not single trades
A casino doesn’t need to win every hand. That isn’t its business model. It needs the mathematics across thousands of hands to work in its favour.
Traders often think completely differently. We judge ourselves trade by trade.
One win: I’m good.
One loss: I did something wrong.
Another win: the strategy works.
Three losses: the strategy is broken.
Once I started thinking in distributions rather than individual outcomes, trading became a very different thing for me. I’m not asking one trade to prove that I’m right. I’m asking whether the mathematics of the process makes sense over a series of trades.
Why win rate tells you so little
This is why I stopped obsessing over win rate a long time ago.
If I told you I win 20% of my trades, would you know whether I’m profitable?
No.
If I told you I win 30%, would you know whether I’m losing money?
Also no.
You need the other half of the equation: what happens when you’re wrong, and what happens when you’re right. That relationship is what I care about. I’ve covered it in more detail in why win rate became the wrong obsession for me.
The whole framework in one picture
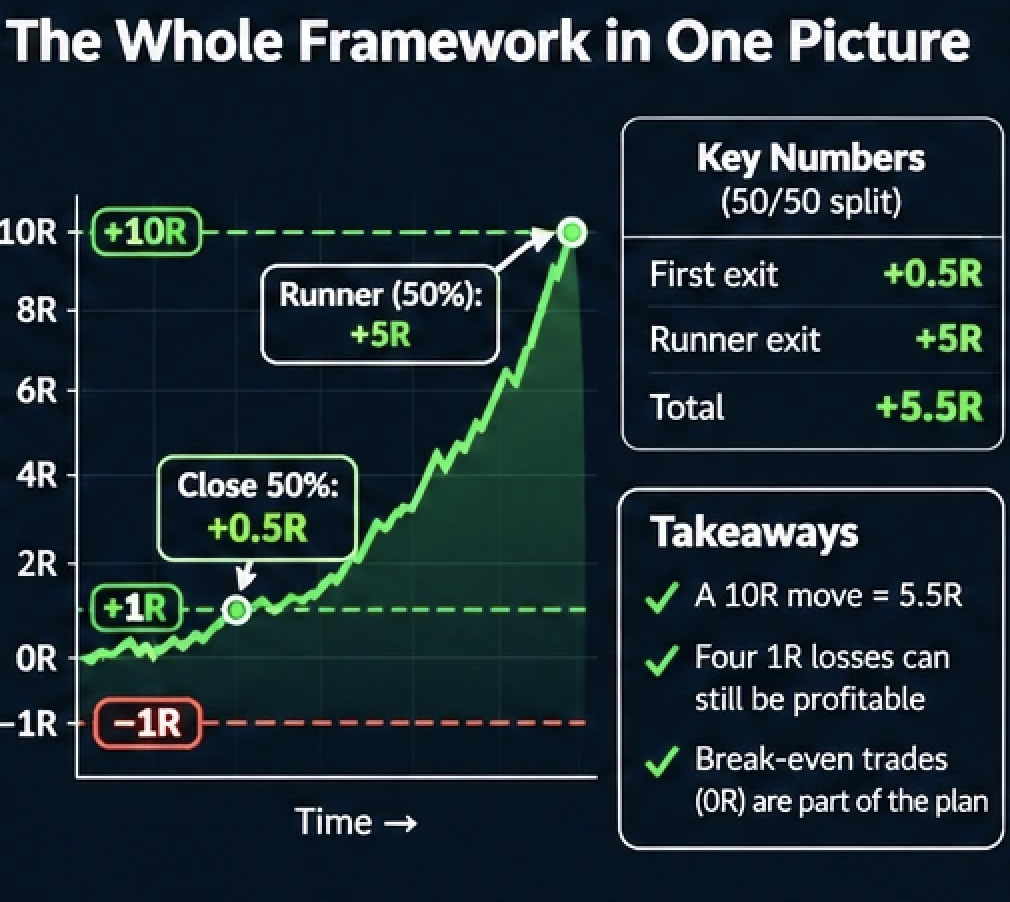
Every trade ends in one of three ways:
- Price hits the stop first: −1R, a full loss.
- Price reaches 1R, then comes back: I’ve taken half, so the trade finishes around break-even.
- Price reaches 1R and keeps going: the runner becomes an asymmetric trade.
That’s the entire idea.
I’m not trying to eliminate losing trades. I’m not expecting every winner to become a 10R trade. And I’m certainly not pretending that a 10R move means I made 10R on my original position.
I’m doing something much simpler:
- I know what I’m prepared to lose.
- Once the market gives me 1R, I lock something in.
- Then I leave part of the position exposed to something I can’t predict: how far the market is actually willing to go.
Most of the time, it won’t be extraordinary. Occasionally, the market moves 30R, 40R or even 70R. I can’t predict which trade that will be, and I don’t need to.
Every so often, a trade doesn’t come back. My job is to still be in it when that happens.
Frequently asked questions
What is partial profit taking in trading?
Partial profit taking means closing part of a position at a profit while leaving the rest open. In my approach, I close half at +1R and let the remaining half run with the original stop, so I bank some profit while keeping exposure to a larger move.
If a trade moves 10R, how much do you make with partial profits?
If you close half at 1R and the other half at 10R, you make 5.5R on the original position: (0.5 × 1R) + (0.5 × 10R). The move on the chart is 10R, but only half the position captured it.
Does partial profit taking increase profits?
Not automatically. It turns trades that reach 1R and then reverse into roughly break-even trades, but it also halves what your runners earn. Whether it helps depends on how often your trades reverse after 1R and how far your winners typically run.
How far must a runner go to cover losing trades?
If you take half off at 1R, one runner must exit at (2 × losses) − 1 to cover your full losses, before costs. To cover four 1R losses, the runner must reach 7R.
Is a break-even trade really free?
Not quite. Before costs it nets about 0R, but spreads, commissions and slippage mean many break-even trades finish slightly negative. Over many trades, those small costs add up, so include them when you test the approach.
Next steps
If you want to apply this, don’t start by copying my numbers. Start with your own trade history:
- How many trades lost the full 1R?
- How many reached 1R and then came back?
- How far did your winners actually travel after 1R?
Those three answers tell you far more about whether partial profit taking suits you than any single impressive trade.
If you’d like to see how I put this into practice in live markets, you can learn more about my Asymmetric Day Trading Programme.
Trading involves risk, and losses are possible. All examples in this article are hypothetical and before trading costs, unless stated otherwise. This article is for educational purposes only and isn’t financial advice.