

Supply and Demand vs Support and Resistance Explained
The popular advice to treat supply and demand as support and resistance with wider rectangles skips the question that matters: what evidence justifies expecting another reaction? A previous turning point proves that traders reacted there before. It doesn't prove that buy or sell orders remain available now.
The comparison between supply and demand vs support and resistance is therefore more useful when you separate observation from inference. Both frameworks can organize a chart, but neither deserves your money because the drawing looks convincing.
Side-by-Side Comparison at a Glance
Support and resistance marks where price has reacted before, while supply and demand marks where an apparent order imbalance produced a strong move and may still contain unfilled interest. That last possibility is a hypothesis, not something a candlestick chart can verify.
Support and resistance vs supply and demand on the same criteria
| Feature | Support and resistance | Supply and demand |
|---|---|---|
| Core idea | Prices where buying or selling previously interrupted or reversed price | Areas where an imbalance of buying or selling pressure drove a sharp move |
| How it is drawn | Horizontal line or narrow band at prior turning points | Broader zone spanning the base candles before a strong departure |
| Evidence basis | Repeated reactions at the same price | Strength of departure and limited prior retesting |
| Economic origin | Behavioral reference, not a quantity supplied or demanded | Conceptually tied to supply-and-demand imbalance |
| Question it answers | Where might price pause or reverse? | Where did the imbalance originate, and could interest remain? |
| Typical weakness | Excessive precision and false breaks | Overly wide zones and uncertainty about remaining orders |
What each drawing actually means
Support is an area where buying previously interrupted a decline; resistance is an area where selling interrupted an advance. On a hypothetical chart, a horizontal band connecting repeated rebounds identifies support without explaining who bought or whether those participants will buy again.
A demand zone is the proposed origin of an upward displacement, while a supply zone is the proposed origin of a downward displacement. For example, a compact consolidation followed by an explosive rally gives a trader a candidate demand zone around that consolidation.
These drawings often overlap. A rally's origin can later become a repeatedly tested support band, giving traders different reasons to monitor the same area.
The distinction isn't just line versus rectangle. Support and resistance can sensibly be drawn as bands, and a supply-and-demand zone can be narrow. The evidence claim, rather than the drawing tool, separates the approaches.
The inference that needs checking
An empirical analysis published in Scientific Reports supports treating support and resistance as conditional price references, not universal reversal signals. Its relevance is that historical reactions can contain information without establishing a permanent barrier.
A strong departure also leaves unanswered questions. Were orders left unfilled, subsequently executed, or cancelled? A chart alone doesn't resolve that uncertainty.
Evidence rule: A past reaction is observable. Remaining buying or selling interest must be inferred or measured.
One framework records historical behavior at a price. The other proposes an explanation for a move's origin and asks whether the conditions behind it might persist.
How to Mark Levels and Zones on Your Chart
Use a consistent drawing protocol before judging either approach. Otherwise, you can keep adjusting boundaries until every historical reversal looks obvious, a method that's impossible to reproduce.
The following chart-marking process separates historical turning points from candidate imbalance zones.
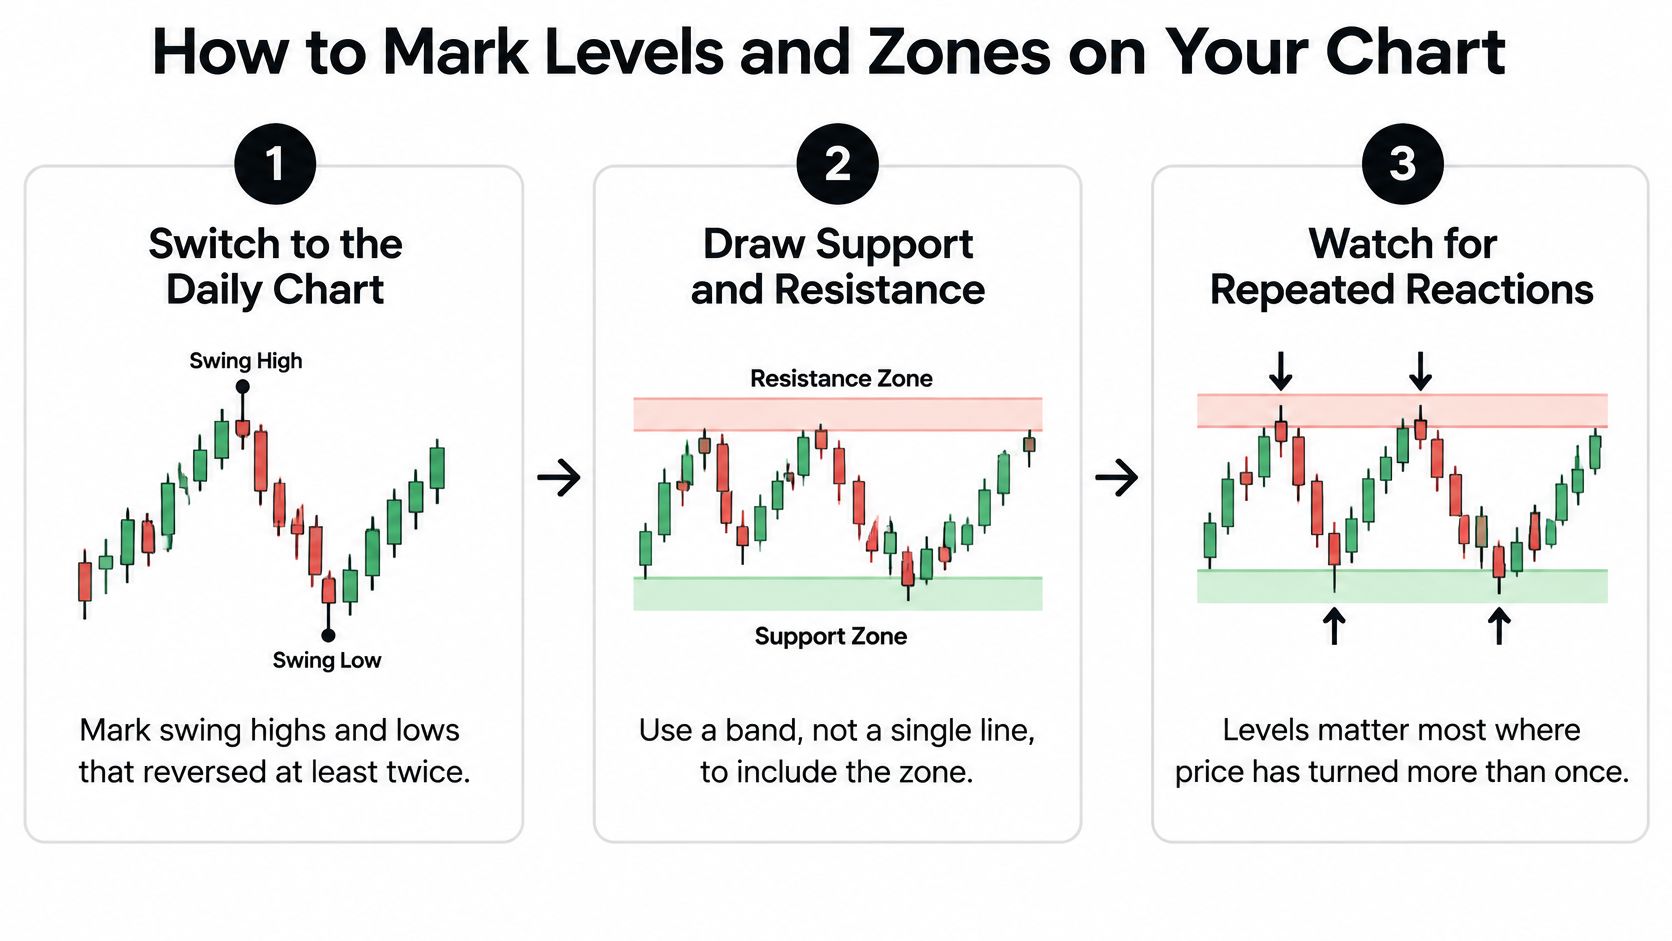
Build the historical reference map
Start with the daily chart. Mark swing highs and lows where price has reversed repeatedly, using the same lookback window for each instrument. Don't treat every isolated turn as an established level, although it can remain a provisional reference.
Draw a horizontal band through the relevant candle-body cluster, extending it across subsequent price action. When wicks disagree, use a documented boundary rule rather than forcing all extremes onto a single price; the common mistake is creating false precision.
Audit the reactions. Count distinct approaches and departures, not neighboring candles within the same sideways episode. Remove weak candidates from your active map rather than treating every intraday wick as independent confirmation.
For examples of how to organize those references, use our guide to support and resistance levels. Keep the drawing rules fixed when comparing examples, because changing the rules changes what you're testing.
Identify the origin of displacement
Find the base before a decisive departure. Look for a compact consolidation immediately preceding the directional move, not a convenient rectangle somewhere along it. Reject a base that requires absorbing unrelated price swings to make the pattern fit.
Set the proximal edge, the boundary closest to returning price, around the relevant base bodies, and the distal edge at the farthest relevant wick. Record this convention before testing; widening a zone after a losing trade hides invalidation rather than improving analysis.
Inspect the departure. Prefer a clear expansion with large directional candles and limited overlap as your operational definition of displacement. A slow drift doesn't satisfy that rule, but a dramatic candle still doesn't prove institutional participation or surviving orders.
Record every revisit and classify the zone's retest history separately from its departure quality. Treat freshness as a variable to test, not a guarantee that an untouched zone must outperform a revisited one.
For forex selection, you can compare relative strength across forex currencies using MyFundedCapital before choosing which pairs to inspect. That adds a selection lens, not confirmation that a particular zone will hold.
Finish with a sparse working chart containing only the clearest nearby references. Keep discarded candidates in your journal so you can examine whether your selection rules excluded useful signals or merely removed clutter.
Why Levels Hold or Break Economics and Order Flow
Economic supply and demand determine equilibrium price and quantity. When available supply changes, participants may need to transact at substantially different prices, regardless of where traders previously drew support or resistance.
Crude oil provides a concrete example of why chart structure must be interpreted alongside changing market conditions.

A supply shock is not a chart pattern
After OAPEC introduced an embargo and production cuts beginning October 19, 1973, the benchmark U.S. oil price rose from $2.90 per barrel before the embargo to $11.65 in January 1974, according to Federal Reserve History's account of the oil shock. The mechanism was a reduction in available supply, not a price pattern requiring another technical confirmation.
This example doesn't establish which particular chart levels failed. It establishes why previously observed prices cannot impose an economic ceiling when the conditions governing transactions change.
That distinction also prevents a common category error. A rectangle beneath a rally isn't an economic demand curve: it contains no direct measurement of consumption, quantities sought at alternative prices, or outstanding purchase commitments.
Our explanation of the supply and demand principle provides a conceptual foundation. For trading decisions, keep the economic mechanism separate from the chart-based approximation.
Where liquidity enters the explanation
A limit-order book organizes resting buy and sell orders by price and time. Unlike a historical candle, it provides observable information about currently displayed liquidity, although participants can alter or cancel those orders.
An order-book study hosted by the Wharton Rodney L. White Center found that chart-derived support and resistance levels were cointegrated with price levels containing high cumulative limit-order depth. That finding gives some horizontal references a liquidity interpretation, but it doesn't establish that every visible line has meaningful depth behind it.
Use the following checks where suitable order-book information is available:
- Cumulative depth: Examine available liquidity across nearby prices, not just at the best bid or offer.
- Spread behavior: Check whether execution conditions deteriorate as price approaches the area.
- Cancellations and replenishment: Distinguish orders that disappear from liquidity that remains or returns after trading.
- Post-touch response: Look for absorption followed by movement away from the area, rather than counting a touch alone.
Absorption means incoming aggressive orders execute without producing proportionate progress through the area. Replenishment adds evidence that participants continue supplying liquidity rather than merely displaying it briefly.
The accompanying video offers another way to examine the relationship between price behavior and these chart concepts.
If your feed doesn't expose relevant market depth, label the chart signal as a proxy, not direct observation of the entire market's orders. Inventory reports, production announcements, central bank decisions, and news gaps should trigger a fresh assessment of whether the original trade premise still applies.
Trade Setups Built on Each Approach
Consider the same hypothetical currency pair approaching a prior buying area. A support trader and a demand-zone trader may both consider buying, but their triggers and invalidation rules need not match.
The comparison below illustrates alternative execution plans, not evidence that either plan has positive expectancy.
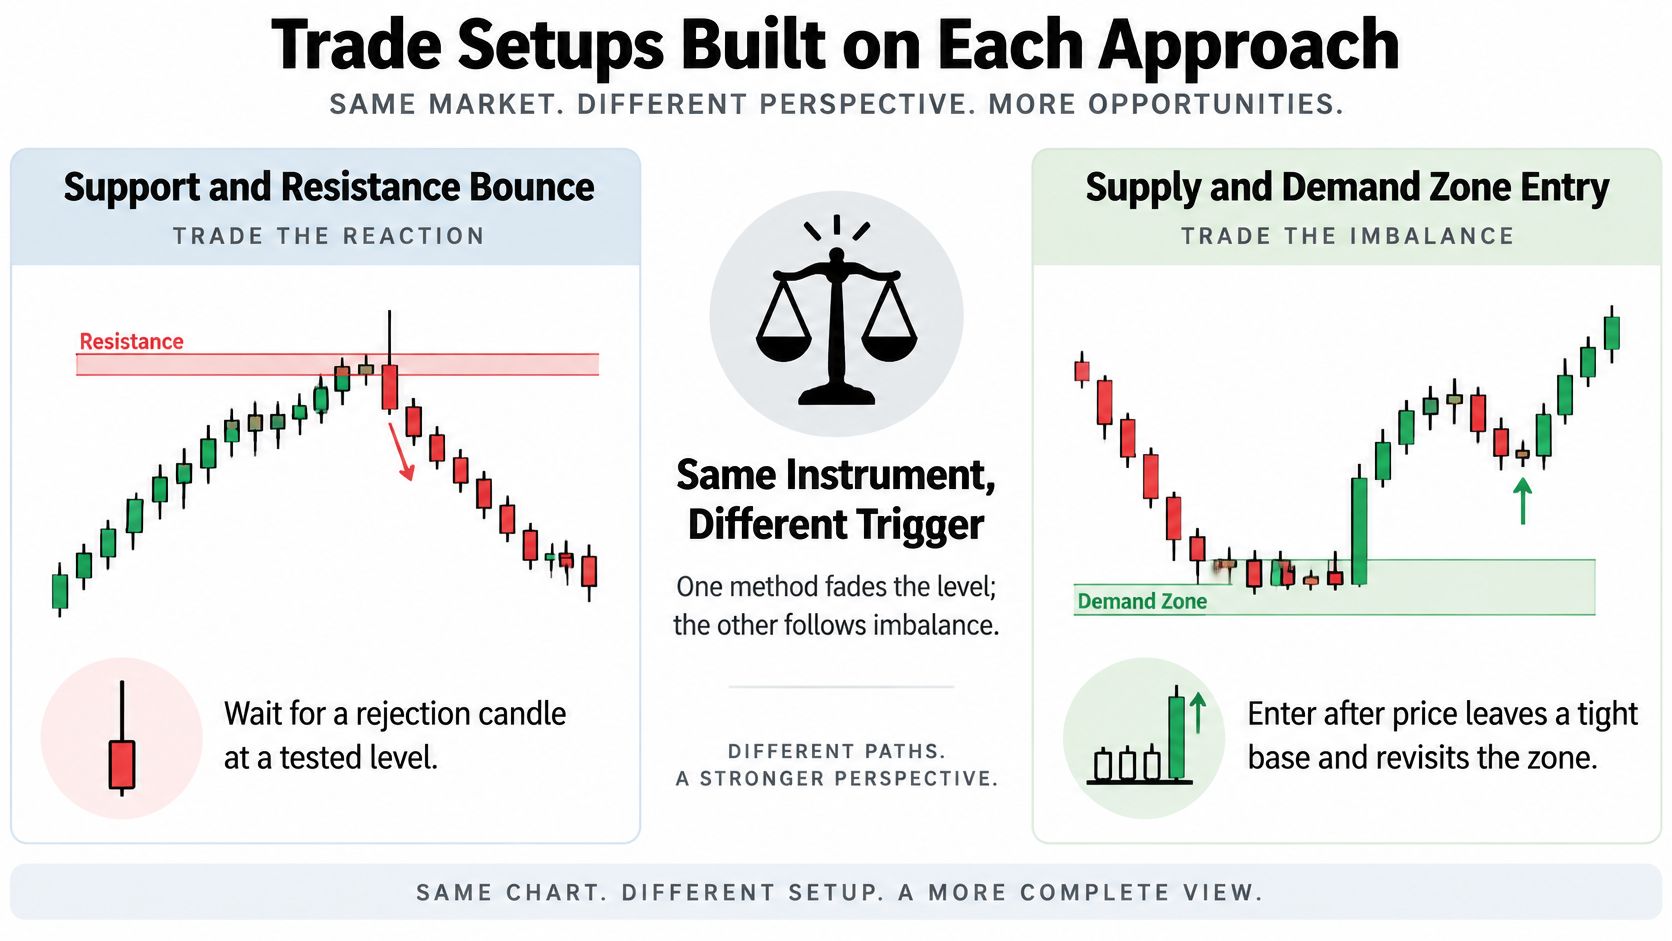
Parallel entries with different commitments
The bounce trader waits for a rejection candle at tested support, then enters only if the chosen confirmation rule completes. The stop sits beyond the band with a predefined allowance for spread and ordinary price fluctuation.
The zone trader focuses on the base that preceded displacement. A resting limit order near the proximal edge prioritizes entry price but risks immediate exposure without confirmation; waiting for a confirming candle prioritizes observed response but may produce a later entry or no trade.
Trade setup components for each approach
| Setup component | Support or resistance bounce | Supply or demand zone entry |
|---|---|---|
| Entry trigger | Rejection candle or lower-timeframe structure break at the level | Return to the proximal edge followed by a confirming candle |
| Stop placement | Beyond the level plus a predefined buffer | Beyond the distal edge |
| Target | Next opposing level | Next opposing zone, checked for reward-to-risk |
| Invalidation | Clean close beyond the level | Close through the distal edge |
| Breakout case | Evaluate a retest as new support or resistance | Reject the broken zone and assess fresh structure |
Targets should follow available market structure, not a desired payoff written into the chart. If the next opposing area leaves no meaningful margin over the planned loss after costs, skip the setup.
Give the failure case its own plan
A Federal Reserve Bank of New York staff report on support and resistance found predictive value for intraday trend interruptions, with results differing by exchange rate and publishing source. An interruption, however, is not a promise of a sustained reversal.
For this hypothetical plan, define a clean break as a completed candle close beyond the relevant boundary, rather than a wick through it. That's an operational rule to test, not a universal definition of breakout validity.
If support breaks, close the failed long according to its predetermined risk controls. A subsequent retest from below can become a separate short candidate only if its own trigger, stop, and target qualify; don't automatically reverse the position.
A broken level creates a new decision. It doesn't justify enlarging the old trade.
A demand-zone failure likewise removes the original buying premise. Wait for new structure instead of averaging into the rectangle, and remember that stop execution can differ from the requested price when liquidity is inadequate. Execution quality belongs in the setup, not just in the post-trade explanation.
How Each Approach Holds Up in Testing
Predicting a reaction and earning a tradable return are different achievements. A price pause can count as a successful forecast while producing too little movement to cover trading costs.
A study of horizontal rules using roughly two decades of adjusted NYSE and NASDAQ prices found that support predicted trend interruptions better than resistance, but the rules didn't generate excess returns over buy-and-hold, according to the Applied Economics study. That result challenges the leap from a visually respected level to a standalone investment edge.
Test the trade rather than the drawing
A useful backtest must specify what happens after identification: the entry order, fill assumptions, stop, exit, and treatment of overlapping signals. Otherwise, you're evaluating attractive chart locations rather than an executable strategy.
Don't assume that evidence about horizontal rules validates every supply-and-demand method. A zone strategy requires its own reproducible definitions, especially for base selection, displacement, boundaries, and retests.
Metrics for benchmarking zone and level setups
| Metric | What it shows | How to use it in comparison |
|---|---|---|
| Expectancy | Average net result per trade | Compare approaches on the same market and period |
| Win rate | Share of winning trades | Read alongside payoff size, never alone |
| Average reward-to-risk | Typical win relative to typical loss | Check whether payoff size offsets the loss frequency |
| Maximum drawdown | Worst peak-to-trough loss | Assess capital requirements and tolerable losses |
| Net Sharpe ratio | Return per unit of risk after costs | Compare risk-adjusted results using consistent calculations |
| Out-of-sample result | Performance on data not used to define the rules | Assess whether performance survives beyond development |
For the payoff comparison, distinguish planned reward-to-risk from the realized average win relative to average loss. Early exits, partial fills, and slippage can make the realized relationship different from the chart's initial projection.
Protect the comparison from hindsight
Freeze your rules before evaluating unseen data. Use our guide to walk-forward testing to structure repeated development and evaluation windows without redesigning the strategy around every disappointing result.
- Include transaction costs: Model spread, commissions, and plausible slippage.
- Keep conditions comparable: Use matching instruments, periods, and risk allocation.
- Track turnover: Frequent trading can change net results even when gross signals look similar.
- Retain failed signals: Don't remove breached zones or redraw them after seeing the outcome.
Compare each method with a suitable baseline, including buy-and-hold where that makes sense for the instrument. A strategy that trades infrequently also needs an exposure-aware comparison rather than an assumption that lower drawdown automatically means superior performance.
The defensible conclusion is narrower than either marketing extreme: these frameworks can filter where to investigate, but a profitable execution rule still has to earn its place through testing.
Choose the Approach That Fits Your Market
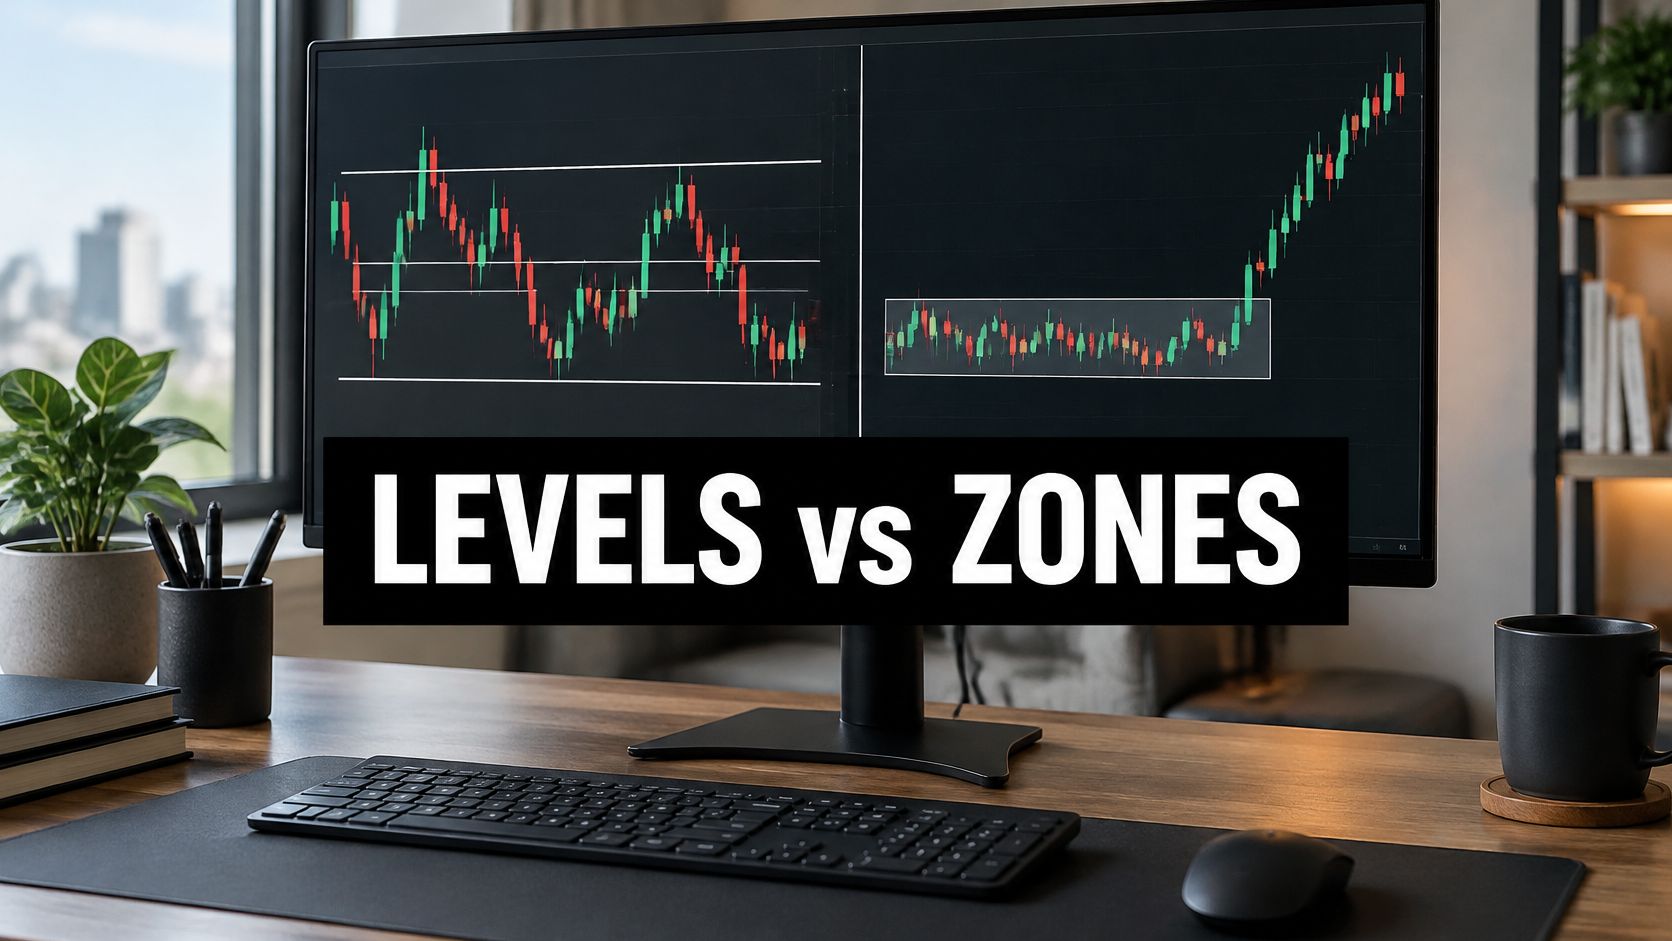
Use support and resistance for repeated range behavior, investigate supply and demand for clear displacement origins, and rely on neither alone during fundamental repricing. This is a situation-based choice, not a ranking of one framework as universally more advanced.
Which approach fits each market situation
| Market situation | Lean toward | Reason |
|---|---|---|
| Clear range with repeated turns | Support and resistance | Reactions at prior extremes are straightforward to count and test |
| Strong impulsive moves from a tight base | Supply and demand | Displacement identifies a candidate imbalance origin |
| Thin or fast-moving market | Either, with volatility-aware stops or no trade | Require confirmation and reassess execution risk |
| Macro shock or news repricing | Neither alone; wait for structure | Previous references may no longer describe current conditions |
| Learning to read price | Support and resistance first | Fewer zone-selection decisions to standardize |
The visual summary gives a practical starting point for matching your method to the chart.
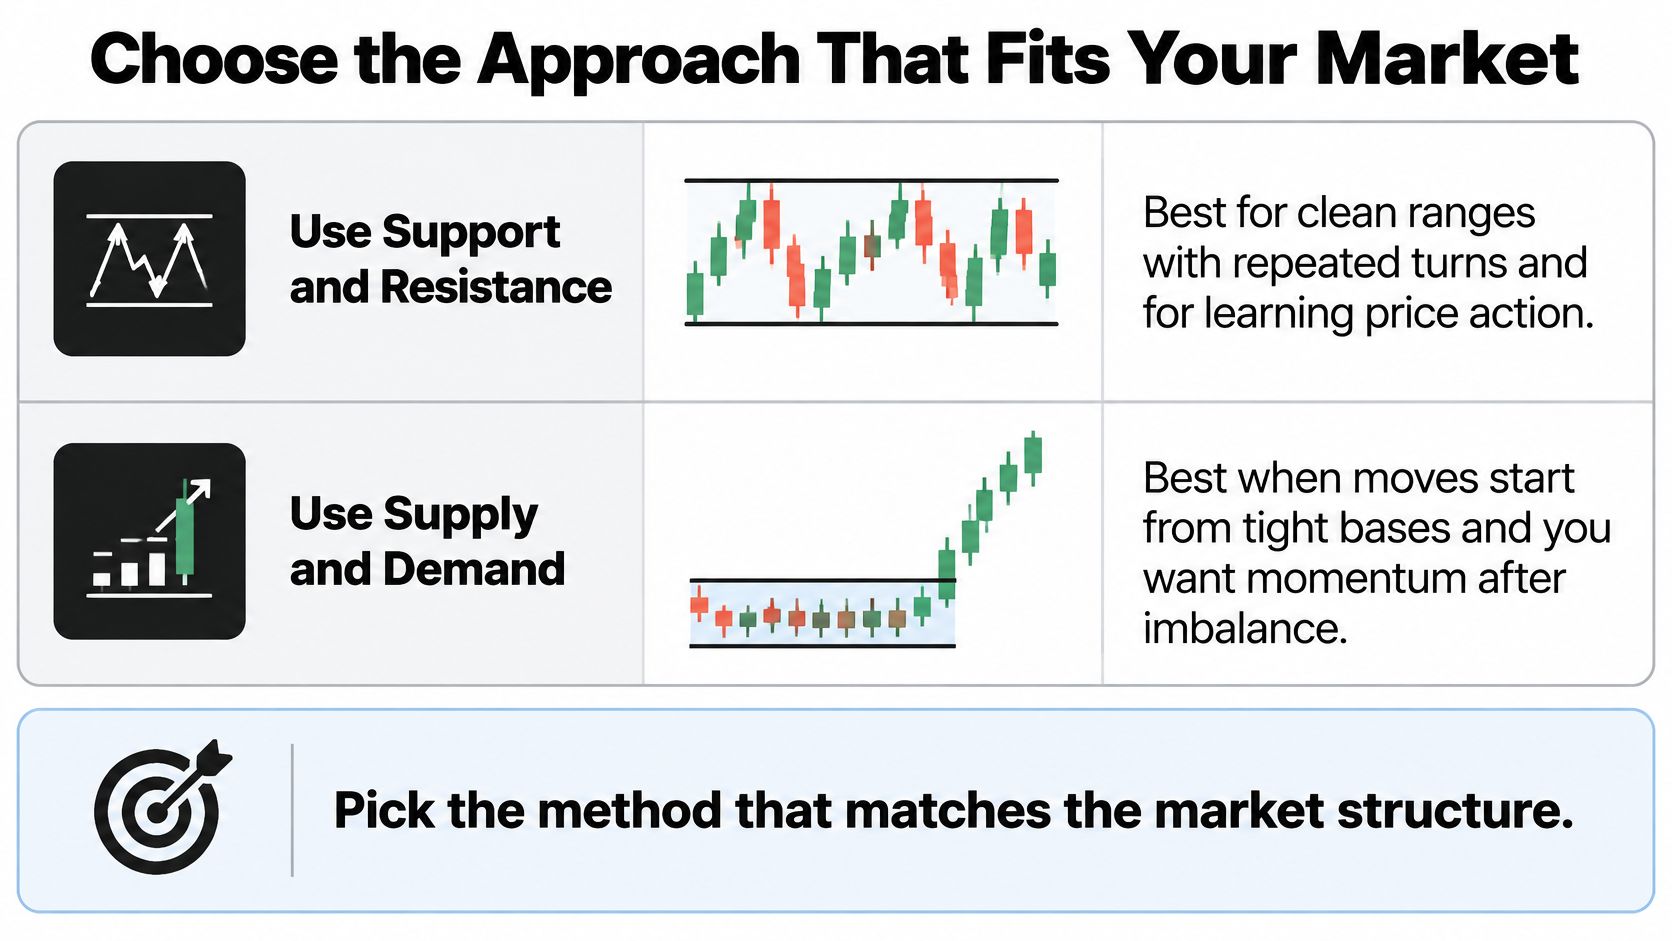
Choose a process you can reproduce
A range trader can build a rule set around reactions at established extremes. A trader studying momentum origins can instead standardize compact bases and directional departures, provided the selection doesn't depend on knowing the eventual outcome.
Pick a primary framework and test it across changing conditions on the same instruments before adding the other. Combining them immediately makes it harder to identify which rule helped and which merely added discretion.
Risk check: If wider boundaries require a wider stop, reduce position size to preserve the planned cash risk. Don't widen an existing stop merely to avoid accepting failure.
In thin or fast conditions, a confirming close can be a useful entry requirement, but it cannot guarantee a fill or prevent slippage. Sometimes the appropriate adjustment is to pass.
All content from Colibri Trader Limited is strictly for educational and informational purposes and does not constitute financial, investment, legal or tax advice. Past performance of a trading system or methodology is not necessarily indicative of future results.
This week, mark an instrument with both frameworks before price returns to your chosen areas. Save the chart, write each expected response and invalidation rule, then compare the subsequent outcome without moving the boundaries.
Our Ultimate Supply and Demand Course teaches the fundamentals of Supply and Demand Trading, offering a structured starting point for studying the zone-based approach. Visit Colibri Trader to explore the course and price-action education, then apply a consistent marking and testing process to your own charts.