
Gold Price Analysis: Two XAUUSD Scenarios Around $3,900–$4,000
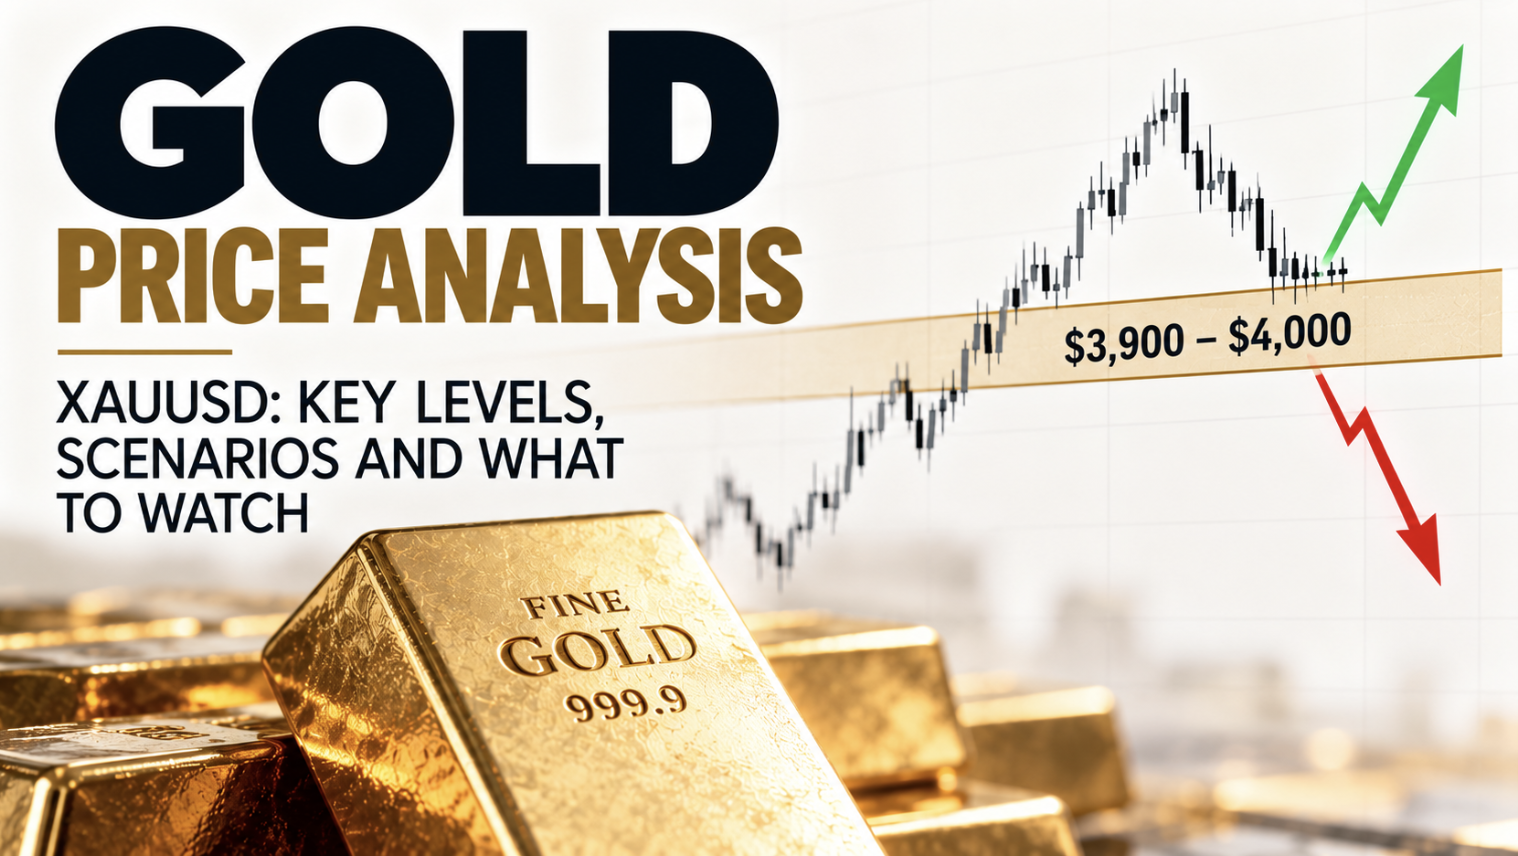
Gold Price Analysis: XAUUSD Tests the $3,900 Demand Zone
Gold has reached the lower boundary of an important daily demand zone. The next move could offer an opportunity in either direction, but I’m waiting for confirmation on the four-hour chart before considering a trade.
As of 30 October 2026, gold (XAUUSD) is trading around $3,900.
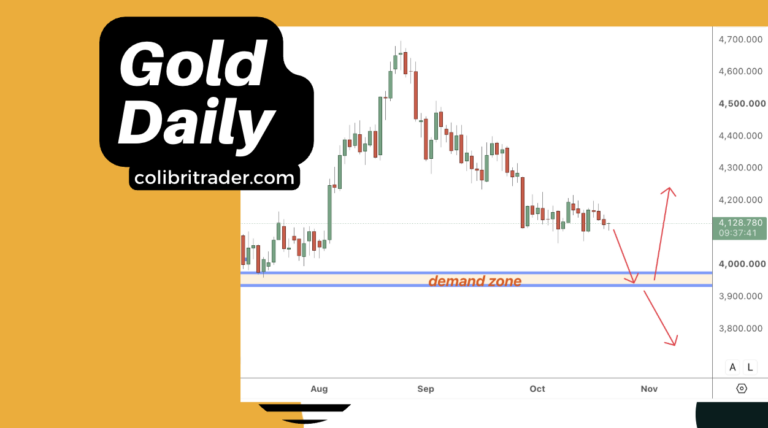
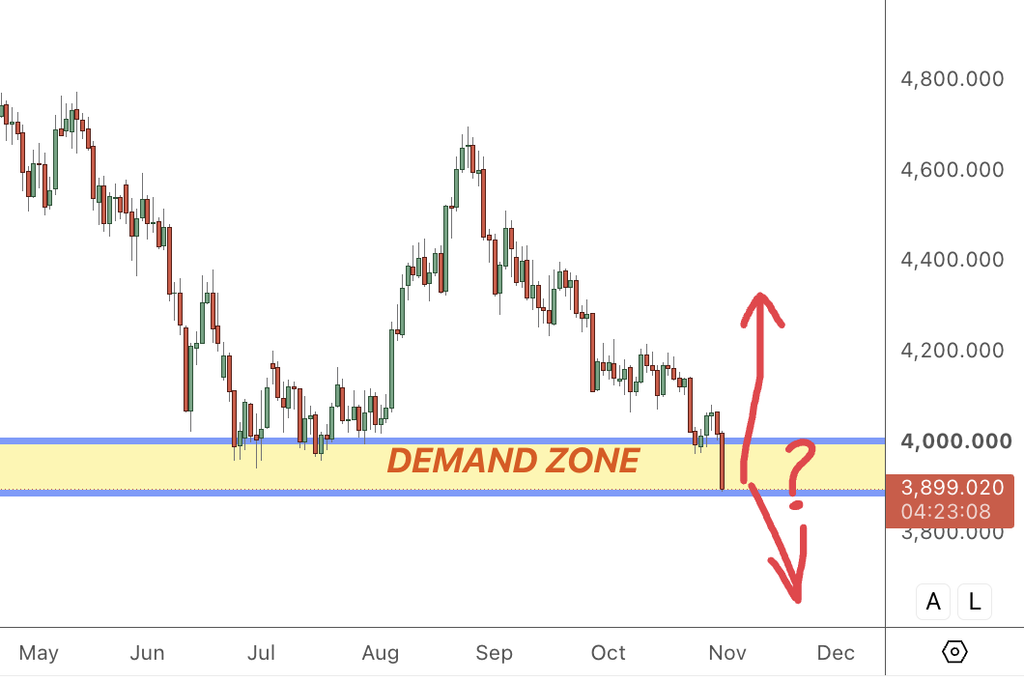
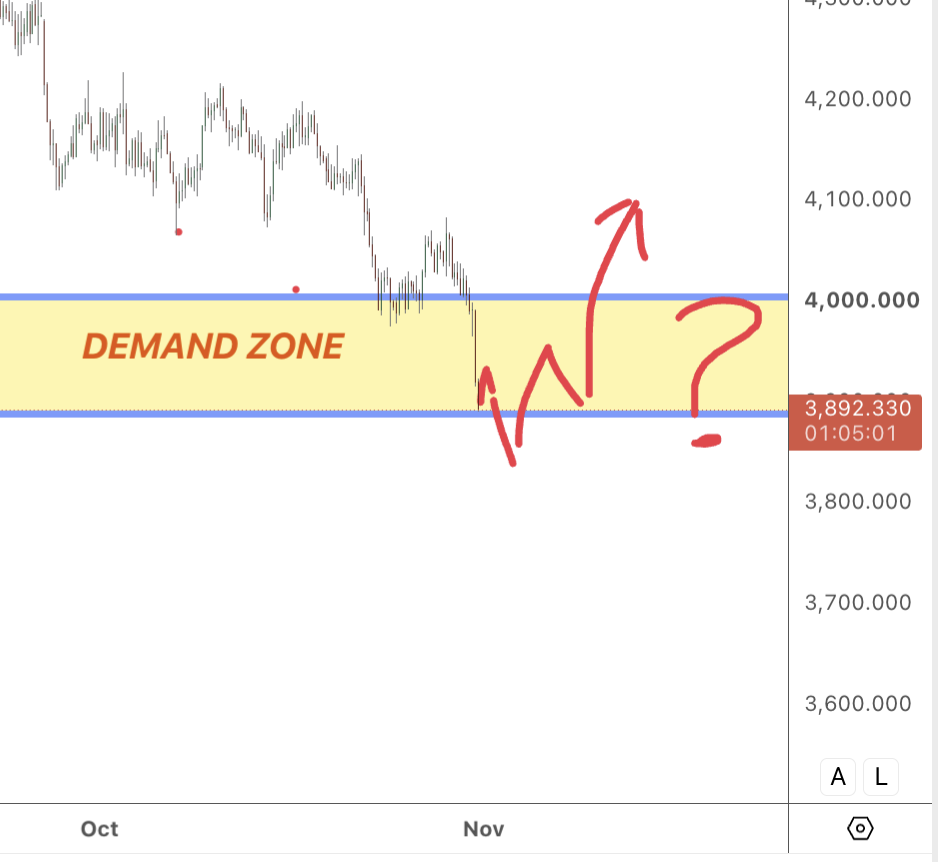
Looking at the daily chart, gold has now tested the lower boundary of the $3,900–$4,000 demand zone I’ve been monitoring.
In my previous gold price analysis, I identified the $3,900–$4,000 area as a potential demand zone. Gold has now reached its lower boundary, and I’m watching the 4H chart for confirmation.
This is an important development because price is no longer approaching the area. It’s already there, testing whether buyers are prepared to defend it.
I’m not trying to predict the direction. What interests me now is whether gold can recover above $3,900 and hold the demand zone, or whether sellers will push price decisively below it.
In both cases, I’ll be watching the four-hour chart for confirmation before considering a position.
Key Takeaways
- Current price: Gold is trading around $3,900, at the lower boundary of the daily demand zone.
- Key zone: $3,900–$4,000 remains the main area I’m monitoring.
- Bearish scenario: A firm daily close below $3,900, followed by a retest from underneath and bearish confirmation on the 4H chart.
- Bullish scenario: Buyers reject the move below $3,900, price recovers into the demand zone, and the 4H chart confirms buying pressure.
- No confirmation, no trade: Reaching a demand zone isn’t enough on its own to justify an entry.
Gold Technical Analysis: Why the $3,900–$4,000 Zone Matters
When analysing gold, I start with the daily chart. It gives me a clearer picture of where buyers and sellers may respond, without getting distracted by every smaller price movement.
I don’t treat support and resistance as exact prices. Markets rarely reverse at a perfectly defined number. Instead, I look for areas where buying or selling pressure could change the direction of price.
These are often referred to as supply and demand zones.
The $3,900–$4,000 zone has already been tested several times on the daily chart, with previous reactions showing buying interest around this area.
Now gold has returned to its lower boundary, and the latest daily candle is testing the $3,900 level.
In my previous analysis on 21 October, gold was trading around $4,129 and I was focused on the $3,930–$3,975 demand zone. Since then, gold has dropped to the 3,900 area. That’s why I’m now treating the whole $3,900–$4,000 region as the decision zone.
The question is whether buyers will defend the area again.
Repeated tests of support don’t guarantee that it will hold. Eventually, a demand zone can fail if selling pressure overwhelms the remaining buying interest.
That’s why I’m particularly interested in what happens next, rather than assuming another bounce is inevitable.
Scenario 1: Bearish Gold – Breakdown, Retest and Potential Short
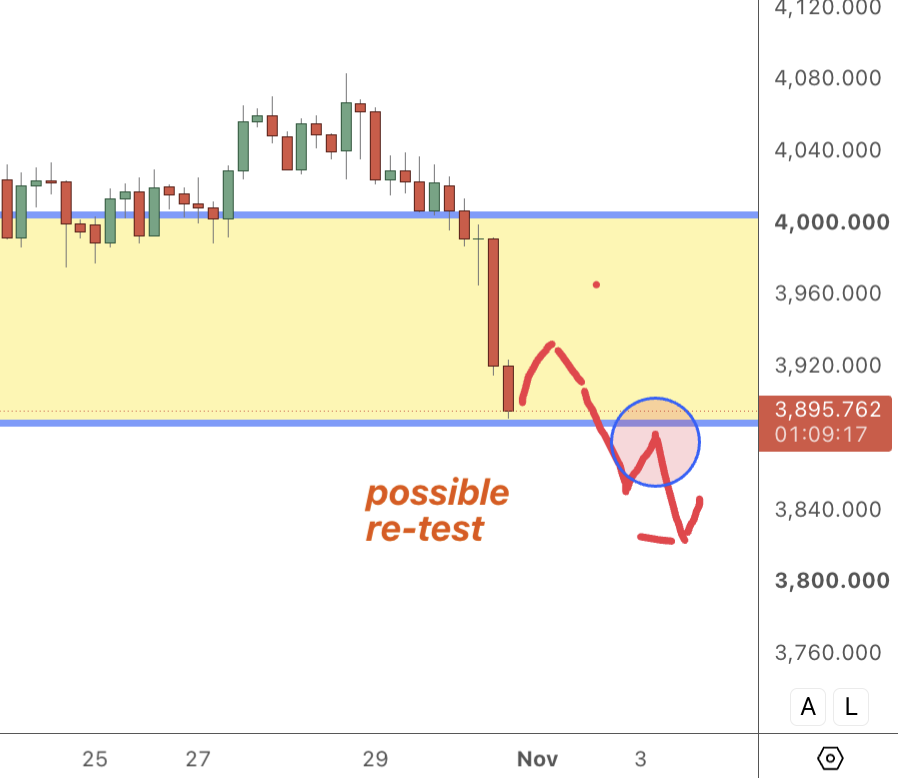
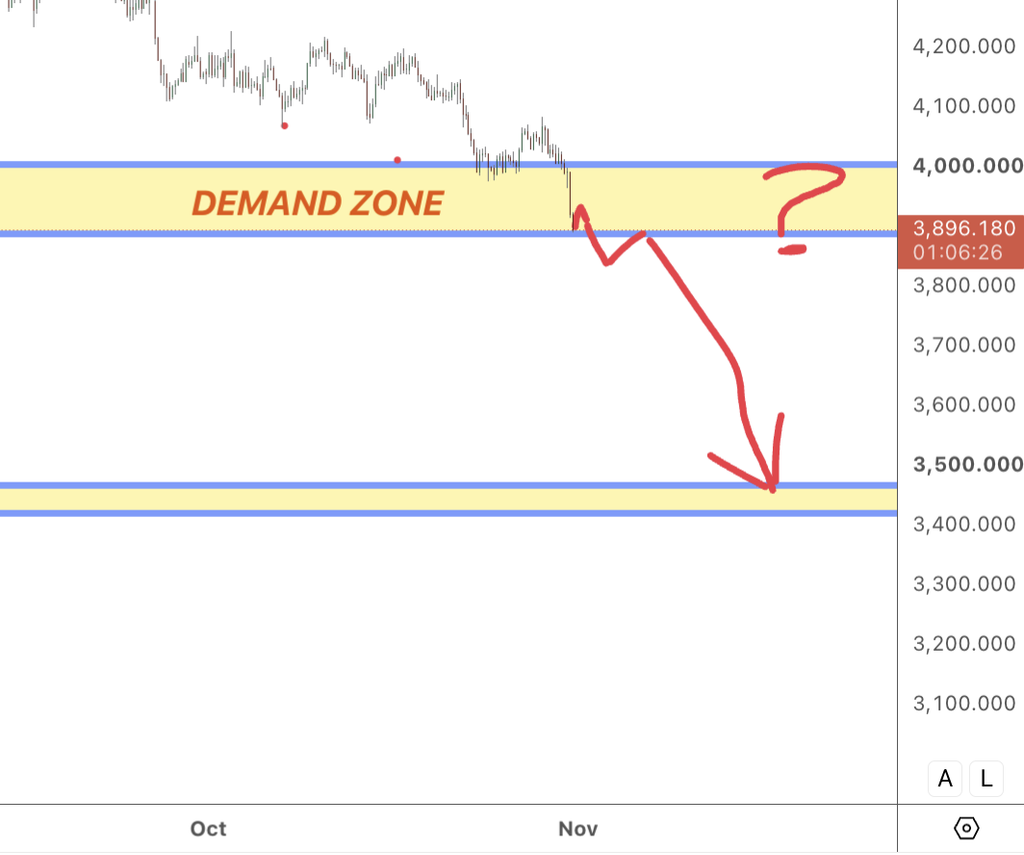
My first scenario involves gold breaking decisively below $3,900.
The latest chart shows price testing this level, but a move below support during an unfinished daily candle isn’t sufficient confirmation of a breakdown.
I’d prefer to see three things:
- A firm daily close below $3,900. I want price to close convincingly beneath the entire demand zone, rather than briefly trading below it.
- A retest of the broken zone. Ideally, gold would recover towards $3,900–$4,000 but struggle to reclaim it.
- Bearish confirmation on the four-hour chart. I would then look for evidence that sellers are defending the former support area.
If those conditions line up, I’d consider a short position.
I don’t need to catch the first move below support. I’d rather see the market confirm that the breakdown has some substance before putting capital at risk.
Bearish Confirmation on the 4H Chart
Two candlestick formations would catch my attention.
Bearish engulfing candle
A bearish engulfing pattern forms when a bearish candle’s real body completely engulfs the previous bullish candle’s real body.
If this appears during a retest of the broken $3,900–$4,000 zone, it could suggest that sellers are stepping back in.
I’d want the four-hour candle to close before assessing the signal. An engulfing pattern that looks convincing halfway through its formation can look very different by the close.
Bearish pin bar or shooting star
The second possibility is a bearish pin bar, sometimes called a shooting star when it appears after an upward move.
It typically has a long upper wick, a relatively small body and a close towards the lower part of its range.
That would suggest buyers tried to push gold higher but couldn’t hold those prices.
If either formation appears during a clean retest, I’ll assess the entry, stop-loss and potential reward before deciding whether to sell.
Invalidation and Risk – Bearish Scenario
Before entering, I need to know where the bearish idea stops making sense.
If gold breaks below support but then reclaims the zone and starts closing convincingly above it, that would weaken the case for selling.
For the stop-loss, I’d look at the structure created by the retest. Depending on the formation, the stop could sit above the high of the bearish confirmation candle or beyond the upper boundary of the resistance zone.
I wouldn’t choose a stop simply because it gives me an attractive reward-to-risk ratio. It needs to sit where the original trading idea would be invalidated.
For a potential target, I’d examine the next daily demand zone at 3,500
I’d then calculate the available reward against the initial risk. If the next demand area is too close to offer an acceptable ratio, I’d leave the trade alone.
A convincing bearish candle doesn’t automatically make it a good trade.
Scenario 2: Bullish Gold – Support Holds and Buyers Return
The second scenario is particularly relevant now that gold has reached the lower boundary of the demand zone.
For a bullish opportunity, I want to see buyers respond around $3,900 and push price back into the $3,900–$4,000 area.
A temporary move below $3,900 wouldn’t necessarily invalidate the bullish scenario, provided price quickly recovers and the daily chart shows a convincing rejection of lower levels.
Ideally, I’d like to see gold reclaim $3,900, remain above it and begin building a recovery.
But I wouldn’t buy simply because price has reached support.
The next step is to look for confirmation on the four-hour chart.
Bullish Confirmation on the 4H Chart
There are two formations I’ll be watching for.
Bullish engulfing candle
A bullish engulfing pattern forms when a bullish candle’s real body completely engulfs the previous bearish candle’s real body.
If gold forms this pattern around $3,900 after rejecting lower prices, it could suggest that buyers are stepping back in.
I’d prefer to see the candle close convincingly, ideally with price recovering into the demand zone.
Bullish pin bar or hammer
A bullish pin bar, or hammer when it forms after a decline, typically has a long lower wick and a relatively small body near the top of its range.
It shows that sellers pushed price lower during the candle, but buyers managed to reject those levels.
Given that gold is already testing the lower boundary, this is one of the formations I’ll be paying particular attention to.
A bullish rejection around $3,900, supported by a strong four-hour close, could provide the confirmation I need to consider buying.
However, neither formation guarantees a rally. I still need a sensible entry, an invalidation level and enough room for the trade to develop.
Invalidation and Risk – Bullish Scenario
The bullish idea would weaken if gold failed to reclaim $3,900 and continued closing decisively below the demand zone.
For stop placement, I’d examine the low of the bullish confirmation candle and the wider support structure.
Depending on the setup, the stop could sit below the confirmation candle or beyond the lower boundary of the zone. The decision would depend on where the bullish case is actually invalidated.
For a potential target, I’d identify the next daily supply zone at 4,200
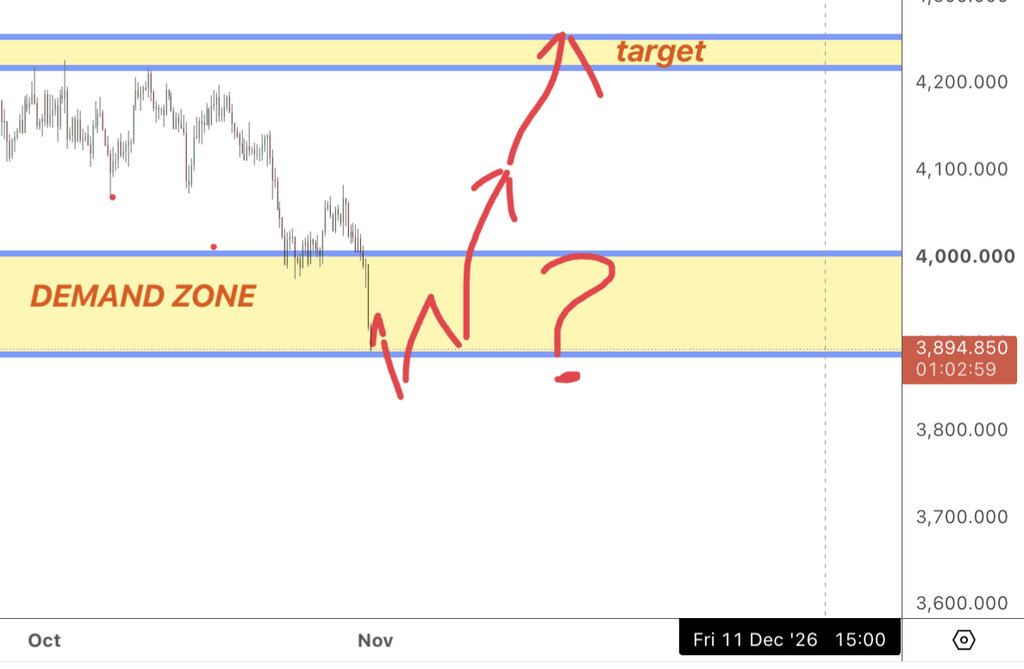
That gives me a reference point for assessing the available upside.
I want the potential reward to justify the risk before entering. My approach to asymmetric trading also means leaving room for a larger move when market conditions support it, rather than automatically closing every position at a fixed reward multiple.
That doesn’t mean expecting every trade to produce an exceptional return.
If the next supply zone is too close, or the required stop makes the trade unattractive, I’ll wait for something better.
Why I’m Combining the Daily and Four-Hour Charts
If you want to see the broader approach behind this analysis, I explain how I trade gold in this video:
The two timeframes have different jobs.
The daily chart has already brought gold to an area worth monitoring. Now the four-hour chart can help me assess whether buyers are defending it or sellers are preparing for a further decline.
The location matters more than the candlestick pattern.
A bullish engulfing candle around $3,900 after a clear rejection of lower prices tells me something different from the same formation appearing in the middle of a trading range.
Likewise, a bearish engulfing candle after a confirmed breakdown and retest would carry more weight than an isolated bearish candle.
This is why I don’t trade candlestick formations in isolation.
Waiting for confirmation has a cost. Sometimes the entry won’t be as attractive as it would have been at the exact turning point. But that additional information can help me avoid acting on a temporary break or an incomplete candle.
I’m comfortable accepting that trade-off.
That’s also how I approach my gold trading strategies: start with a broader plan, identify the relevant price areas and only act when the market offers a suitable opportunity.
When I’d Stay Out
The zones and confirmation rules in this analysis are the core of my Supply & Demand course, where I go through the full process step by step.

There are several conditions where neither scenario would appeal to me.
If gold keeps moving above and below $3,900 without a clear daily close or rejection, I’d rather wait. Choppy price action around the lower boundary can produce convincing-looking signals that quickly fail.
I’d also avoid treating an unfinished daily candle as confirmation of a breakdown.
High-impact economic announcements are another reason to be cautious.
Federal Reserve interest-rate decisions, US Consumer Price Index (CPI) releases and Non-Farm Payrolls (NFP) can create sharp moves in gold.
I prefer not to initiate a position immediately around those announcements, particularly when the volatility could undermine an otherwise reasonable technical setup.
There will always be another opportunity.
Gold Price Outlook: What Would Change My View?
Gold has now reached the $3,900 lower boundary of the daily demand zone, so the next reaction matters.
A firm daily close below $3,900, followed by a failed retest and bearish confirmation on the four-hour chart, would support the short scenario.
A rejection of lower prices, recovery above $3,900 and bullish four-hour confirmation would make the long scenario more attractive.
For now, I’m watching the 4H chart closely for a bullish or bearish engulfing candle or a clear pin bar rejection.
If neither appears, I’ll wait.
The important part is having a plan for both directions, knowing where each idea is wrong and being prepared to do nothing when the conditions aren’t there.
I’d rather miss the beginning of a move than enter a trade that doesn’t meet my criteria.
Frequently Asked Questions About Gold (XAUUSD)
Is Gold Bullish or Bearish Right Now?
Gold is testing the lower boundary of the $3,900–$4,000 daily demand zone. My view remains conditional: a bullish rejection with 4H confirmation would support a potential long, while a confirmed breakdown and retest would favour a short.
What Is the Key Support Level for Gold?
The main area I’m watching is $3,900–$4,000 on the daily XAUUSD chart. Gold has now reached its lower boundary around $3,900, making the next price reaction particularly important.
How Do You Trade Gold Using Supply and Demand?
I identify supply and demand areas on higher timeframes, then watch how price behaves when it reaches them. I prefer to wait for confirmation rather than automatically buying support or selling resistance, and I assess the potential reward before entering.
What Is the Best Timeframe for Gold Technical Analysis?
For this analysis, I’m using the daily chart to identify the broader price zone and the four-hour chart to assess confirmation. Combining them gives me a clearer view of the setup, although neither timeframe guarantees a successful trade.
Disclaimer: This article is for educational purposes only and does not constitute financial advice. Trading involves risk.