

How to Trade with Precision Using Price Action
You marked the support zone before the session opened. Price returned, printed a convincing rejection, and you clicked buy. Then you adjusted the stop, added size after a losing trade, and closed the eventual winner early. By the end of the session, you were searching for a better entry pattern, even though the entry wasn't your biggest mistake.
Learning to trade with precision means addressing what happens around the signal. Chart reading matters, but so do the price you receive, the exposure you take, and the evidence you collect afterward.
What It Actually Means to Trade with Precision
Consider a hypothetical trader who understands supply and demand. Their charts are tidy, their zones look reasonable, and they can explain why price might react. Yet they enter before confirmation, choose position size by feel, and judge every decision by whether the trade made money.
The problem isn't necessarily a lack of chart knowledge. It's that the trader hasn't turned that knowledge into an executable process. Knowing where a trade might develop isn't the same as knowing exactly what would justify taking it.
Precision means making decisions in advance
Trading precision is consistency across selection, entry, risk, execution, and review. Each decision should have an observable condition attached to it. Another trader should be able to read your notes and understand why you entered, where your idea became invalid, and whether you followed your own rules.
Compare these approaches:
- Discretion without boundaries: Buy because a candle looks strong, then decide how much room to give it.
- Defined discretion: Wait for a specified reaction at a marked level, calculate exposure from the invalidation point, and reject the trade if the available price changes the economics.
Neither approach eliminates uncertainty. The difference is whether you can distinguish a reasonable loss from an avoidable mistake.
Practical rule: A profitable trade can contain poor decisions. A losing trade can still be executed correctly.
Build an environment that supports restraint
Your workspace belongs in the process, too. If messaging apps and social feeds interrupt your analysis, consider removing those distractions during scheduled chart work. TiedSiren's blocking features explained is a resource to examine when deciding whether a blocking tool fits that routine.
Don't confuse a cleaner desktop with a trading edge, though. Environmental controls support a plan; they don't replace one.
The useful definition of precision isn't catching the exact turning point. It's making a decision you can explain before entry and evaluate afterward.
Price Action Setups That Give You a Real Edge
A pattern is a candidate setup, not proof of an edge. Treat the following as operational definitions to test, rather than signals with guaranteed probabilities.
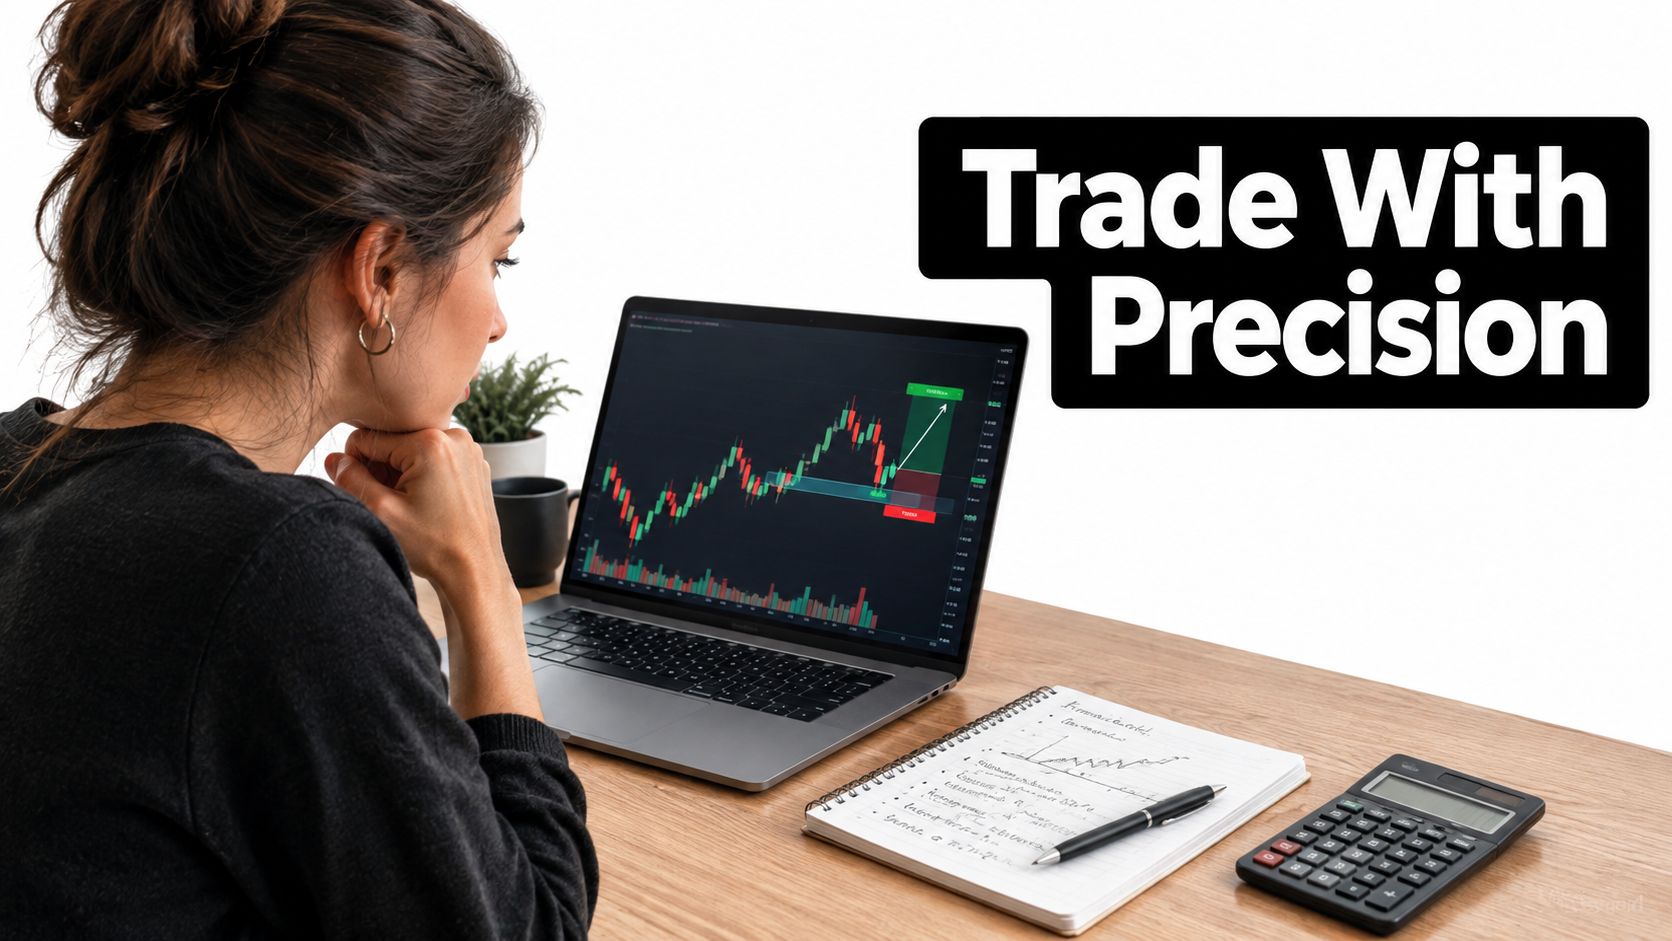
Keep your chart and notebook visible together when practicing these decisions.

Define location before looking for a trigger
For a bullish engulfing on strong support, sometimes shortened to BOSS, mark support before the engulfing candle appears. For this exercise, require the bullish candle's body to engulf the preceding bearish body and close back above the marked support area.
On a hypothetical EURUSD chart, the setup would qualify only after that close. A bullish candle in the middle of an undefined range doesn't qualify. Place invalidation beyond the rejection structure, with an allowance appropriate to the instrument's trading conditions.
For supply and demand, mark the base preceding a decisive departure. Define the boundaries consistently, then wait for a return and a rejection that meets your written trigger. Don't redraw the zone afterward to make a failed trade appear valid.
Separate rejection from confirmation
A pin bar shows rejection within a candle, but its location determines whether it belongs in this exercise. At a previously marked index support level, require the lower wick to extend through the area and the close to return above it.
Choose your confirmation method beforehand. Entering after a completed rejection and waiting for a subsequent break of its high are different methods with different entry prices and missed-trade risks.
Use the video as supporting chart-study material, not as a substitute for written rules.
- Practice one definition: Mark historical examples without looking at the subsequent outcome first.
- Grade compliance: Record location, trigger, and invalidation separately.
- Include failures: Keep valid losing examples rather than collecting only attractive winners.
If continuation structures suit your approach better, study flag pattern trading as a separate setup. Do not combine its rules with a reversal strategy whenever convenient.
A Pre-Trade Planning Checklist You Actually Use
A level you marked yesterday gets hit while you are halfway through a coffee. You have a short window to act. This is when a written checklist proves itself, and when a vague one gets exposed.
A checklist should resolve a decision, not decorate your trading desk. If you can tick every box and still take the same trade you were going to take anyway, the questions are too loose. Write the thesis before the order ticket opens: what price has done, what you are waiting for, what would invalidate the idea. Phrases like "looks ready" and "should bounce" cannot be verified, so they cannot be answered with precision.
Each item on the card has to work as a pass/fail gate. A two-out-of-three permission rule sounds reasonable until it lets you override an absent trigger or unacceptable risk, which are precisely the failures that turn a decent setup into a losing trade.
Location: the area was marked before the signal, opposing structure noted
Trigger: the required candle closed, or the entry condition occurred
Invalidation: the stop sits beyond the structure that disproves the idea
Reward: a plausible exit offers enough return against planned loss and costs
Execution: order type, quantity, and cancellation conditions are written down
Set your minimum acceptable reward during testing, then hold it. Stretching a target past an obvious obstacle to make the ratio look better is how traders talk themselves into trades their own numbers reject.
Impulsive vs Planned Entries
| Criterion | Impulsive Entry | Planned Entry |
|---|---|---|
| Location | Notices a moving candle and searches for justification | Uses an area marked before the trigger |
| Stop placement | Chooses a comfortable cash loss, then squeezes the stop | Identifies structural invalidation before calculating size |
| Follow-through | Improvises when price hesitates | Uses predefined management and cancellation conditions |
One gate stays live after the checklist is complete. If price travels away while you prepare the order, the setup can remain valid while the entry stops being acceptable. Reassess the remaining reward instead of chasing the fill.
Missing an entry is an acceptable outcome. Taking a different trade while pretending it is the original plan is not.
Keep the card next to the ticket. When writing the thesis exposes a contradiction, cancel the preparation and go back to watching. Traders chasing a higher win rate usually hunt for a new pattern. The gap between a 45% and a 60% win rate more often sits in this pause, the willingness to stand down when a gate fails.
Position Sizing and Risk Per Trade
Size the position to the stop, not the stop to the position. Start with the point at which the trade thesis fails. Then calculate how much exposure fits within your chosen loss budget.
A tight stop doesn't make a trade conservative if you compensate with excessive size. Likewise, a wider structural stop doesn't automatically mean greater account risk when you reduce the position appropriately.
Calculate exposure from the loss budget
Use these relationships:
Cash risk budget = account equity × chosen risk fraction
Position quantity = cash risk budget ÷ estimated loss per unit at the stop
For a currency position expressed in lots:
Lot size = cash risk budget ÷ [(stop distance in pips × pip value per lot) + estimated costs per lot]
For a hypothetical EURUSD trade, take the equity and risk fraction from your account plan, measure the distance between the intended entry and structural stop, and obtain the applicable pip value from the broker's contract specifications. Include estimated friction, then round the result down to a tradable increment.
This gives you a calculation you can reproduce without pretending that a generic lot size fits every account. Check account-currency conversion and contract details rather than relying on a remembered pip value.
The position sizing in trading guide provides a related reference for building your own sizing worksheet.
Account for exposure beyond the order
A planned stop is a risk estimate, not a guaranteed maximum loss. Gaps, slippage, and execution conditions can change the realized result, so don't allocate capital you can't afford to lose.
- Aggregate exposure: Check whether open positions depend on substantially the same directional move.
- Session limits: Set daily and weekly loss limits before trading, with a written action when either is reached.
- Drawdown response: Reduce size or return to simulation when execution discipline deteriorates, rather than increasing exposure to recover losses.
Risk boundary: Never widen a stop solely to avoid accepting the loss you already budgeted.
After consecutive losses, inspect compliance before placing another trade. If you broke a rule, stop live execution and rehearse the correction. If the losses followed the plan, assess them within the strategy's broader record rather than changing everything immediately.
The Journaling Routine That Builds Real Skill
The losing trade always looks clearer at dinner: price tagged your level, you entered early, the stop slipped, and the chart suddenly “warned” you all along. A journal matters because memory edits faster than rules improve. It should answer one working question: what should you repeat, change, or stop doing?
Use a spreadsheet, notebook, or dedicated template while the decision is still warm. The trading journal guide is a workable format reference; consistency beats software.
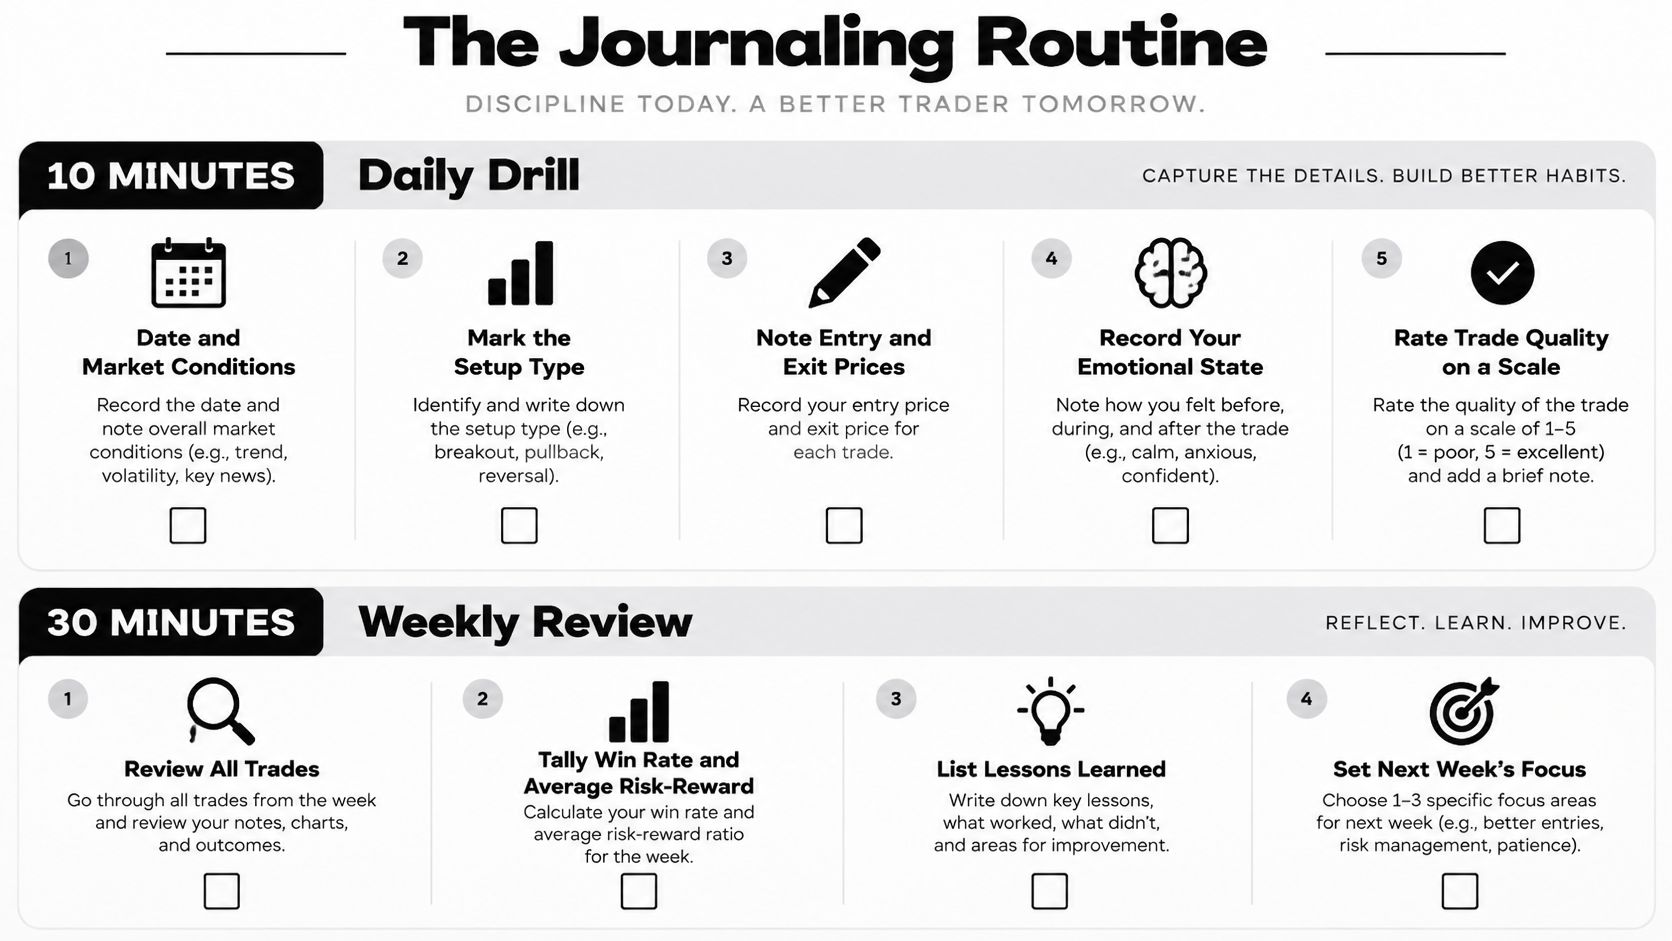
| Field | Record before the next trade | What it exposes |
|---|---|---|
| Context and setup | Instrument, session, conditions, setup type, marked location | Whether the same idea keeps appearing in the same conditions |
| Plan versus fill | Planned entry, actual fill, initial stop, quantity, exit | Early entries, late exits, execution drift |
| Outcome in R | Net result divided by the original cash risk budget | Whether sizing math stayed honest |
| Behavior | Rule followed, plus one sentence on state | Revenge, hesitation, fatigue |
| Evidence | Decision-time chart and exit chart | The story memory tries to rewrite |
Keep the original risk denominator unchanged. A moved stop changes the trade, so the measurement has to keep that change visible.
Review the pattern around the pattern
At week's end, group comparable trades by setup, session, and compliance. The gap between a 45% and 60% win rate often hides there: clean signals with casual sizing, valid setups traded in dead conditions, good entries chased after the confirmation already passed. I tell students to separate rule-following losses from forced trades before touching the strategy.
A losing cluster raises a question before it proves a setup failed. Check whether entry timing, market conditions, or friction changed first. Then convert the observation into one controlled experiment: “skip entries before the confirmation candle closes” is testable; “be more disciplined” is not. Hold the change steady long enough to interpret it, because skill grows from feedback you can attribute, not from a promised monthly improvement rate.
Execution Quality and Hidden Trading Costs
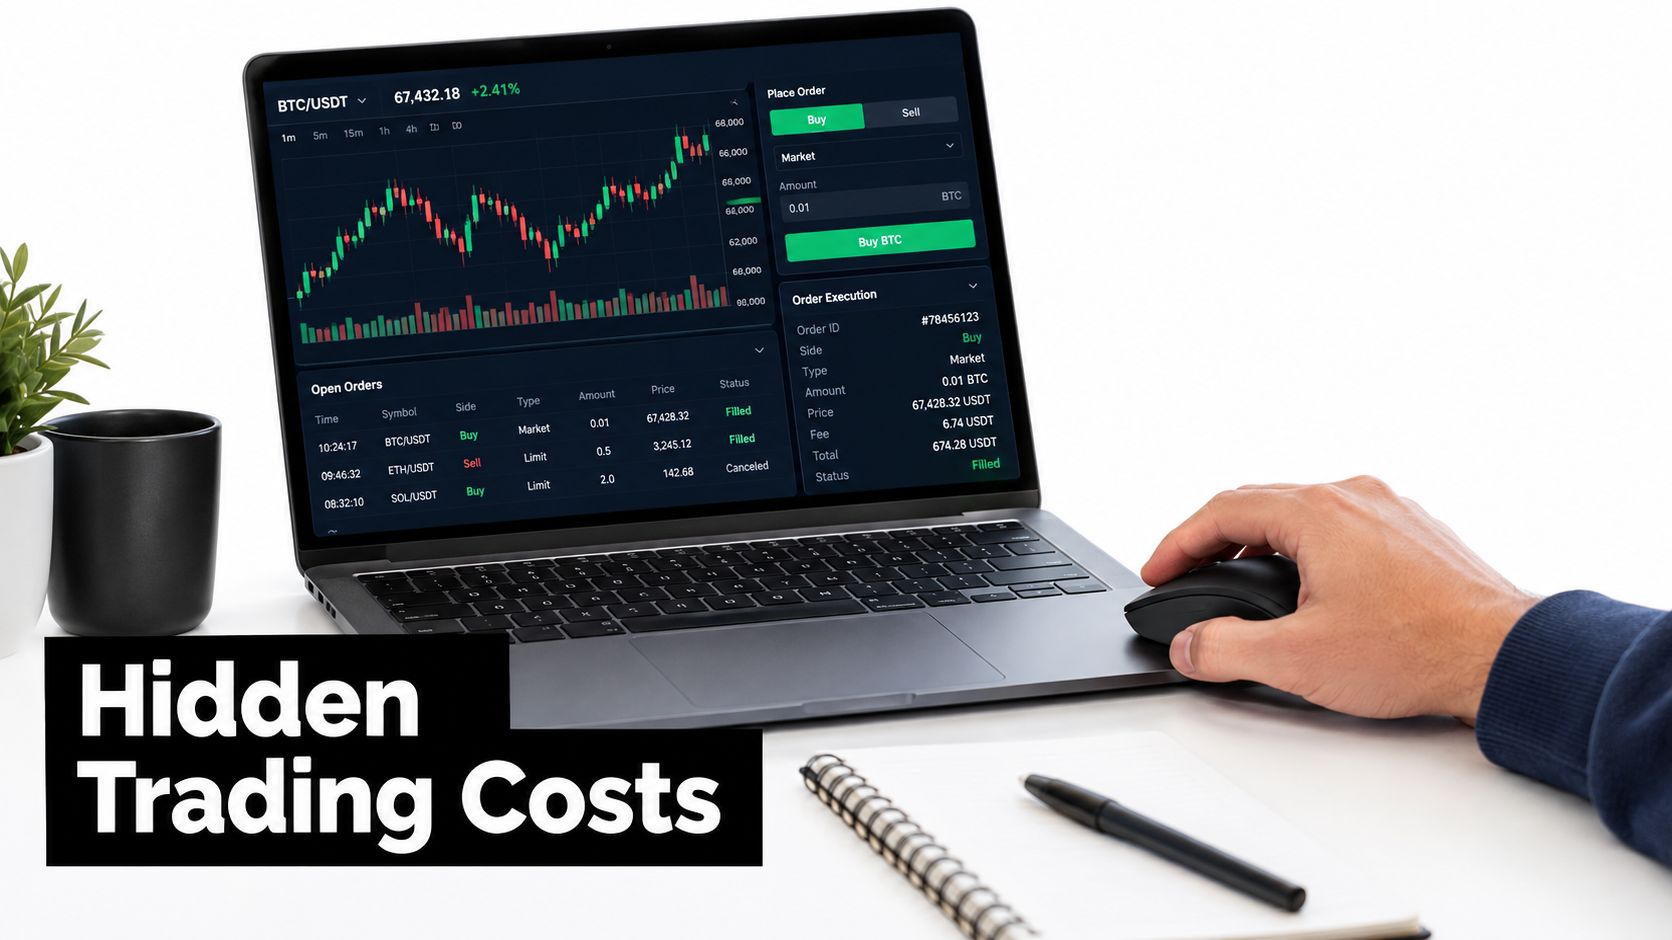
A correct chart decision can still pay for a bad fill. Zero commission doesn't mean zero trading cost, and the quote on screen at the decision moment can differ from the price that lands in the account.
A 2025 Journal of Finance study involving approximately 85,000 simultaneous market orders across five major U.S. retail brokers found average round-trip costs ranging from 7 to 46 basis points, with most dispersion attributed to different pricing by off-exchange wholesalers rather than routing decisions or payment for order flow, according to the retail equity execution study. That evidence concerns U.S. equities, not a universal cost estimate for forex, futures, or cryptocurrency.
Keep the fill record visible alongside the chart when auditing execution.
Price the trade before you take it
Use one benchmark and keep it fixed: the executable quote at the decision timestamp works because it separates market friction from the price you wished you had. Record spread as bid and ask at that moment; record slippage as the gap between fill and that chosen benchmark; record implementation shortfall as intended transaction versus executed result, including explicit costs and any unfilled portion; record partial fills by executed quantity, average price, and what happened to the remainder.
That is where a pattern stops being the whole trade. If expected edge is thin, a wide spread or sloppy fill can turn a valid signal into a marginal bet before sizing even enters the math.
Audit comparable orders, not moods
Export a recent batch of fills and group them by instrument, session, order type, and setup. Look for recurring adverse differences; one ugly fill after a loss proves little.
Market orders choose speed and accept price risk. Limit orders choose price control and accept the chance of no trade. I treat the order type as part of the setup, then reject entries when estimated friction eats too much of the expected advantage. Waiting for better conditions is often the cleaner execution decision.
A 30-Day Practice Plan to Trade with Precision
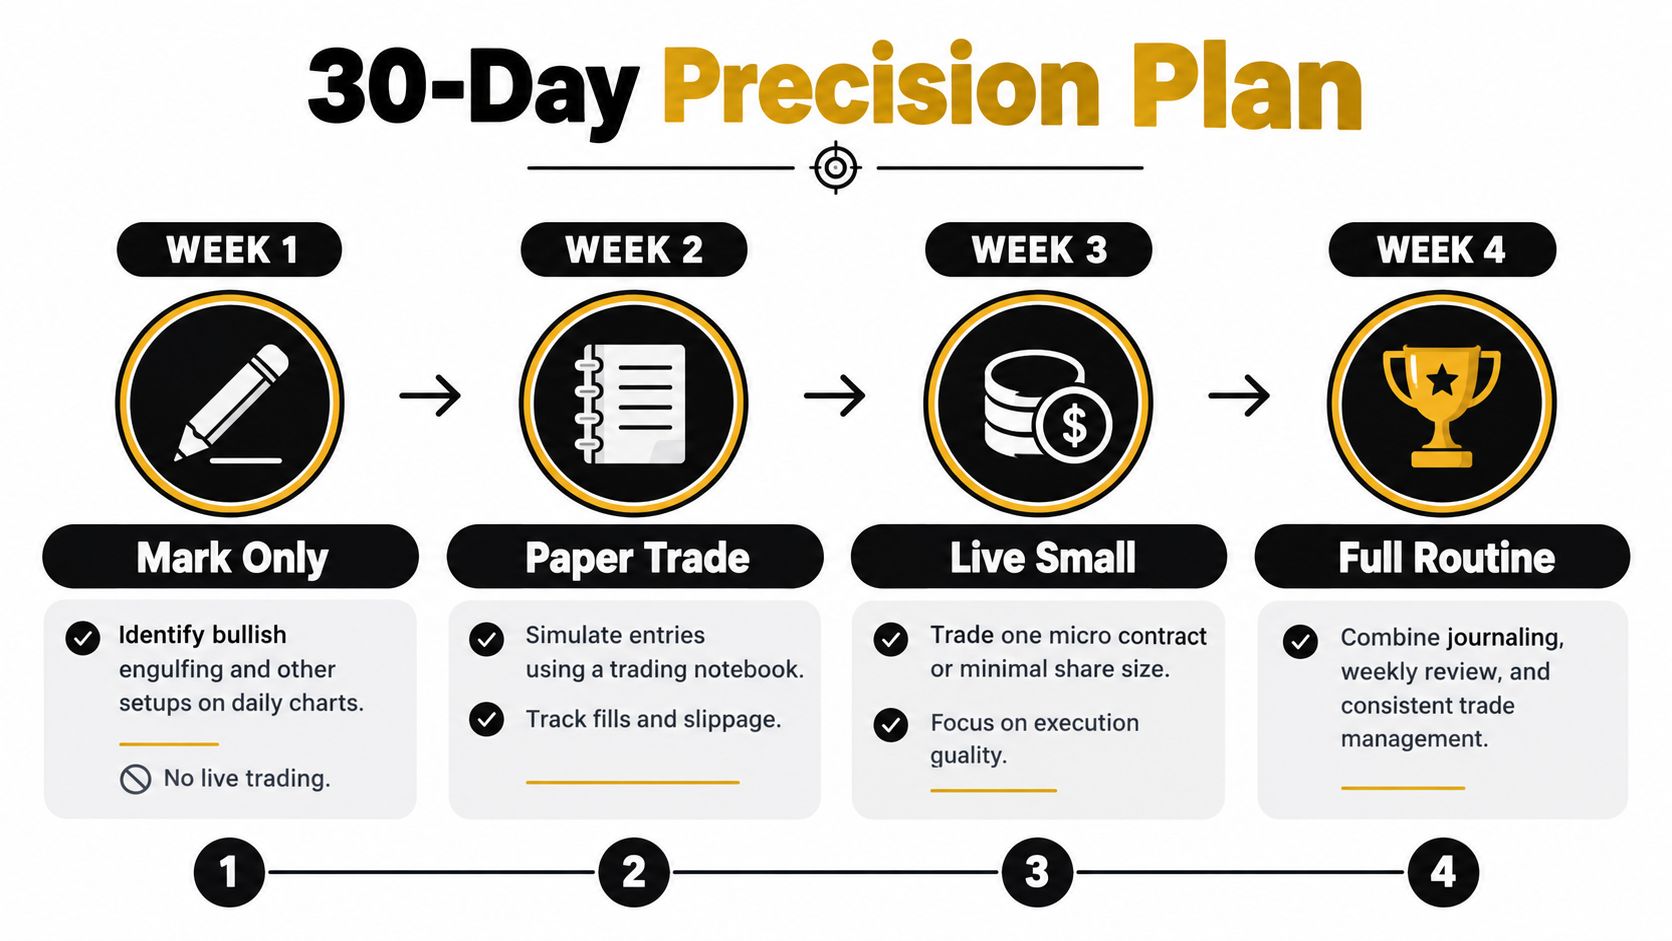
Use the month as a structured practice period, not a deadline for profitability. Progress means producing a more reliable decision record and identifying weaknesses you can test.
Keep the sequence visible, but don't advance merely because the calendar changes.
Begin with recognition and rehearsal
During the opening week, mark setups without trading live. Choose a pattern definition, record qualifying examples and failures, and save charts before revealing subsequent price action. Your milestone is consistent classification, not an attractive hypothetical profit curve.
During the following week, rehearse the checklist in simulation. Prepare orders, record management decisions, and journal rejected opportunities as well as entries. Don't mistake simulated fills for evidence of live execution quality.
Add exposure only when the process holds
For the next stage, use minimal live exposure only if you understand the instrument, can afford the risk, and have followed the rehearsal rules. Remaining in simulation is a valid decision.
Apply the sizing worksheet and loss boundaries without overrides. The milestone is operational competence: correct quantity, intended protection, and an accurate record.
During the final stage, combine the routine with the execution audit. Compare your intended decisions with broker records and investigate discrepancies before increasing exposure.
Evaluate outcomes without overclaiming
Calculate net expectancy in R as total realized net R divided by completed trades. Compare the practice period with your earlier record only when the samples and conditions are reasonably comparable.
- Better results with better compliance: Continue testing before drawing a strong conclusion.
- Better results with worse compliance: Don't treat favorable outcomes as permission to abandon controls.
- Weak results despite compliance: Investigate setup selection, costs, management, and sample limitations.
A short record can't establish a durable edge. It can reveal whether you're following a testable process.
To trade with precision, make your decisions specific enough to inspect. Keep the useful rules, challenge the unsupported assumptions, and change what the record gives you reason to change.
Colibri Trader offers price-action education, supply-and-demand courses, and learning resources focused on discipline and money management. Visit Colibri Trader to explore the free Trading Potential Quiz and choose a learning path that addresses the weakest part of your trading process.