




Piercing Line Candle Pattern Rules

Most guides describe the piercing line candle pattern as a bullish buy signal. That advice is incomplete and often expensive. A two-candle shape doesn't create an edge by itself, especially when it appears inside sideways price action, directly beneath resistance, or during a disorderly sell-off.
Treat the formation as a conditional price-action setup. The prior trend, the location of the pattern, the quality of the second candle, participation, confirmation, and the payoff available before resistance all matter. A trader who memorizes the picture but ignores those conditions is trading appearance, not supply and demand.
The evidence is less flattering than popular candlestick summaries suggest. In a peer-reviewed foreign-exchange study covering 112,792 daily candles across 24 currency pairs, mechanical trading of the piercing line together with dark cloud cover under a 1:1 reward-to-risk framework produced 1,652 trades, with a combined win rate of approximately 49.2%. Only 11 of the 24 pairs produced positive results under that specification. The result doesn't make the pattern useless. It shows why context and trade construction matter more than recognition alone (peer-reviewed foreign-exchange research).
Why Most Traders Fail With the Piercing Line
The piercing line fails when traders treat recognition as a trade decision. A red candle followed by a strong green candle may show that selling pressure is weakening, but it does not prove that buyers can control the next leg.
Context decides whether the formation deserves attention. After a meaningful decline, it can mark a shift in short-term pressure. Inside a range, the same two candles may reflect routine rotation. Beneath overhead resistance, the rebound may have little room to develop. During a broad sell-off, the bullish candle may result from short covering rather than sustained demand.
The mechanical signal has a problem
A textbook definition identifies the candle shape, but it does not resolve entry timing, stop placement, target selection, spread, slippage, or position sizing. Those choices determine whether the setup offers a workable trade or only an attractive chart pattern.
Practical rule: A piercing line earns attention first. It earns a trade only after location, follow-through, and risk have been assessed.
Experienced price-action traders ask questions that go beyond the label:
- Where did the decline begin? A clear sequence of lower highs and lower lows provides stronger reversal context than a brief dip.
- What caused the recovery? A forceful response from a well-defined demand area carries more weight than a bounce in empty space.
- What price must hold? Set the invalidation level before entry. If price breaks it, the bullish thesis has failed.
- Where is the next obstacle? Nearby resistance can leave too little room for a favorable reward relative to the planned risk.
- What happens after the signal? Follow-through, not candle color, shows whether buyers are still willing to lift price.
Volume can help separate participation from a temporary reaction. A bullish close supported by noticeably stronger activity deserves more scrutiny than the same close formed on thin participation. Volume is not proof by itself, especially in fragmented markets, but ignoring it removes useful information about commitment.
Recognition is only the first filter
The pattern compresses a short-term change in control into two sessions. Sellers first drive price lower, then buyers recover more than half of the prior bearish body. That shift can identify a possible change in supply and demand, while offering no guarantee that the move will last.
Rank formations instead of treating them as merely valid or invalid. A piercing line after sustained selling, at established support, with credible participation and open space toward the next resistance zone deserves more attention than the same shape in a choppy mid-range. The visual pattern remains unchanged. The available trade, including its timing, confirmation, and risk-to-reward balance, does not.
Anatomy and Strict Recognition Rules
A piercing line has a narrow definition. If traders loosen the rules until every bullish rebound qualifies, the name stops providing useful information.
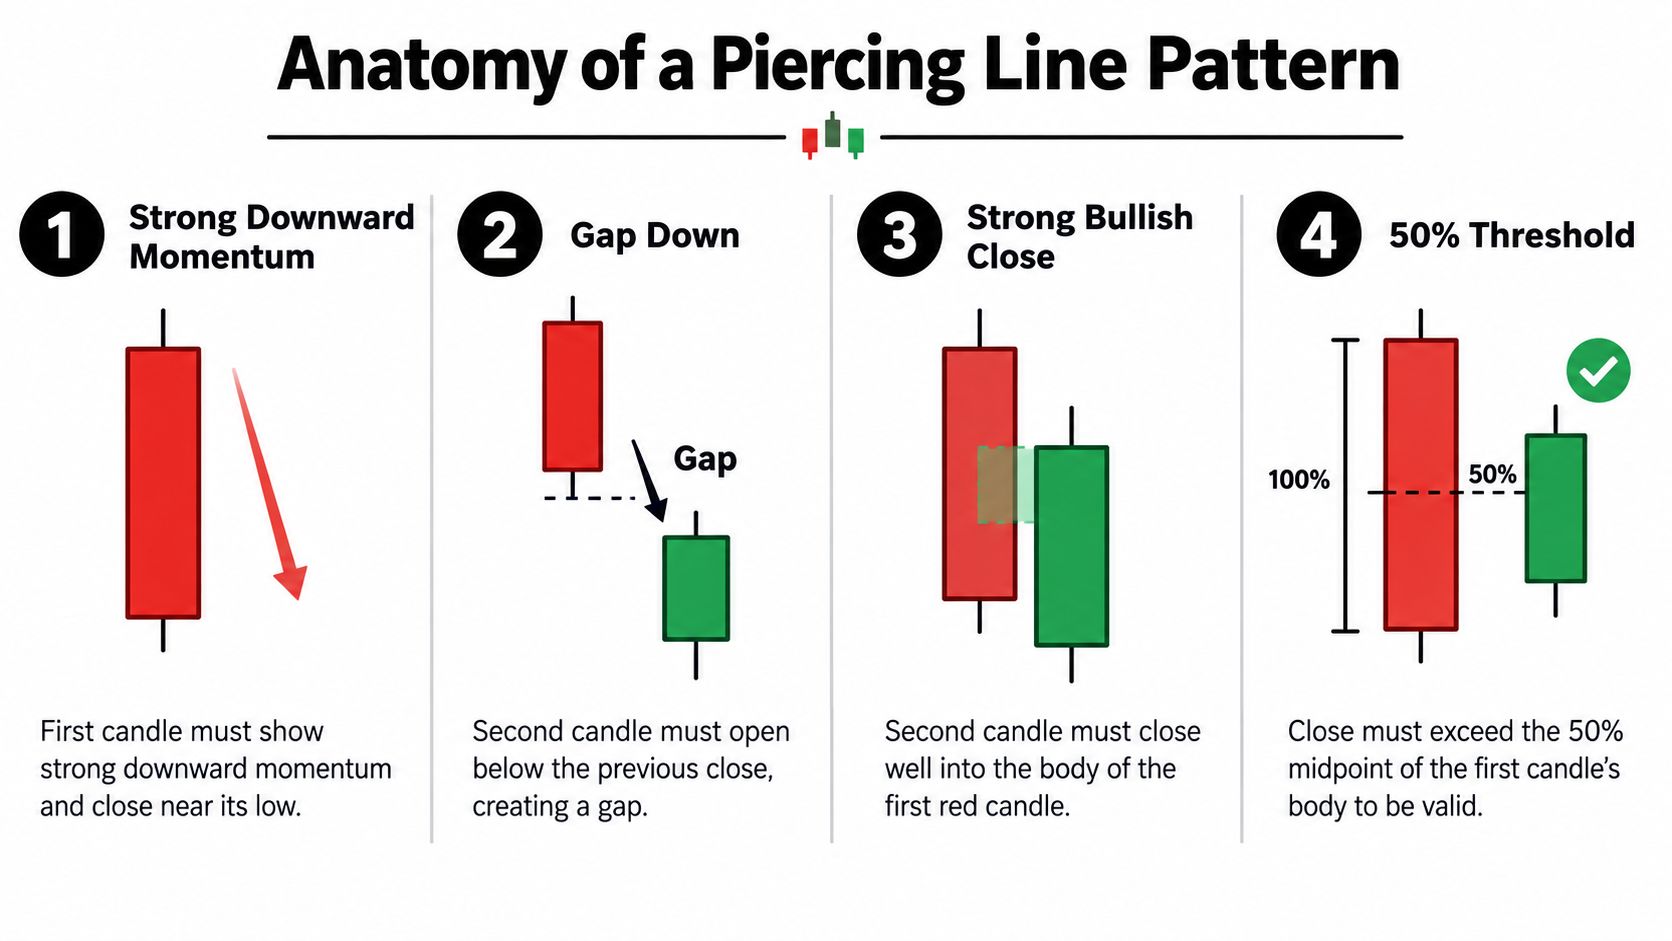
The formation consists of two candles after a meaningful decline. The first candle is relatively long and bearish. The second is bullish, opens below the previous session's low in the traditional version, and closes above the midpoint of the first candle's real body without fully engulfing it.
Four mandatory tests
First, require a real decline. The setup needs a meaningful bearish context, not one red candle appearing after an otherwise balanced market. The pattern's historical identity comes from a falling market where sellers have had control.
Second, inspect the first real body. It should be relatively large and bearish compared with nearby candles. A tiny red body doesn't show enough directional pressure for the second candle to meaningfully reverse.
Third, check the second opening position. Traditional Japanese candlestick interpretation expects the bullish candle to open below the prior session's low. In continuously traded markets, the exact gap may be less pronounced, but the second session still needs to begin with downside pressure or displacement.
Fourth, measure the close. The bullish candle must finish above the midpoint of the first candle's real body. The CMT Level II curriculum describes this as bulls overwhelming bears and uses the midpoint penetration to distinguish the pattern from a weak rebound where sellers haven't been fully absorbed (CMT Level II curriculum).
The midpoint is measured from the first candle's open and close, not from its high and low. A wick that reaches above the midpoint doesn't qualify if the actual body closes below it. Likewise, a close above the midpoint but above the first candle's open may be a bullish engulfing rather than a conventional piercing line. For the distinction between these formations, compare the rules in this guide to the explanation of the bullish engulfing candlestick.
What to reject
Reject a formation when the second candle only recovers into the lower part of the first body. Reject it when the market has been moving sideways, when the first candle is unusually small, or when the second candle closes beneath a major resistance area with no room for continuation.
Pattern definitions are useful because they impose discipline. For a broader reminder that an expected outcome remains uncertain even when a setup looks familiar, traders can browse Artul.ai blog examples. The same principle applies here: a recognized pattern describes a condition, not a promised result.
The Supply and Demand Psychology Behind the Pattern
Candles don't move markets. Orders do. The candle is the visible record of how aggressively buyers and sellers interacted during a session.
The first bearish candle shows that sellers controlled the auction. They pushed price lower, forced late buyers to exit, and may have attracted additional short positions. Its size matters because a larger body represents a more decisive imbalance than a narrow decline.

Why the lower open matters
The second session begins with bearish expectations still active. A lower open, particularly below the previous session's low, can encourage late sellers to press their positions. If price then fails to continue lower and buyers lift it well into the prior body, those new short positions become vulnerable.
That sequence creates a potential trap. Sellers had evidence that the decline was continuing, but the market rejected the lower prices and recovered a substantial part of the previous loss. Short sellers may cover, while buyers who were waiting at support can add demand. Their orders help extend the recovery.
The bullish interpretation isn't that every buyer has taken control of the entire trend. It is narrower. Buyers absorbed enough supply to reverse the second session's initial weakness and reclaim more than half of the prior bearish body. That represents a short-term change in control.
Read the location, not just the emotion
A recovery in the middle of a broad range doesn't carry the same information as a recovery at a price where buyers previously defended the market. Supply and demand analysis therefore asks whether the second candle reacts from a meaningful level, such as a prior swing area or a well-defined demand zone. A trader who studies supply and demand levels and price action can use the pattern as evidence of a reaction at location, rather than treating the candle itself as the location.
Volume can add useful context, but it needs careful interpretation. Strong participation during the bullish recovery can support the idea that the move involved genuine demand. Low or declining participation makes the same visual recovery easier to dismiss as thin liquidity or temporary short covering.
The psychology also explains why patience matters. Buyers haven't proven that they can create a sustained advance merely because they won the second session. They need to defend the recovered area and produce follow-through. If sellers immediately push price back beneath the pattern's low, the absorption thesis has failed.
Performance Across Different Markets and Timeframes
A piercing line doesn't carry a portable probability. Its expectancy changes with the market being traded, the timeframe used to define the candles, the prevailing volatility, and the cost of execution.
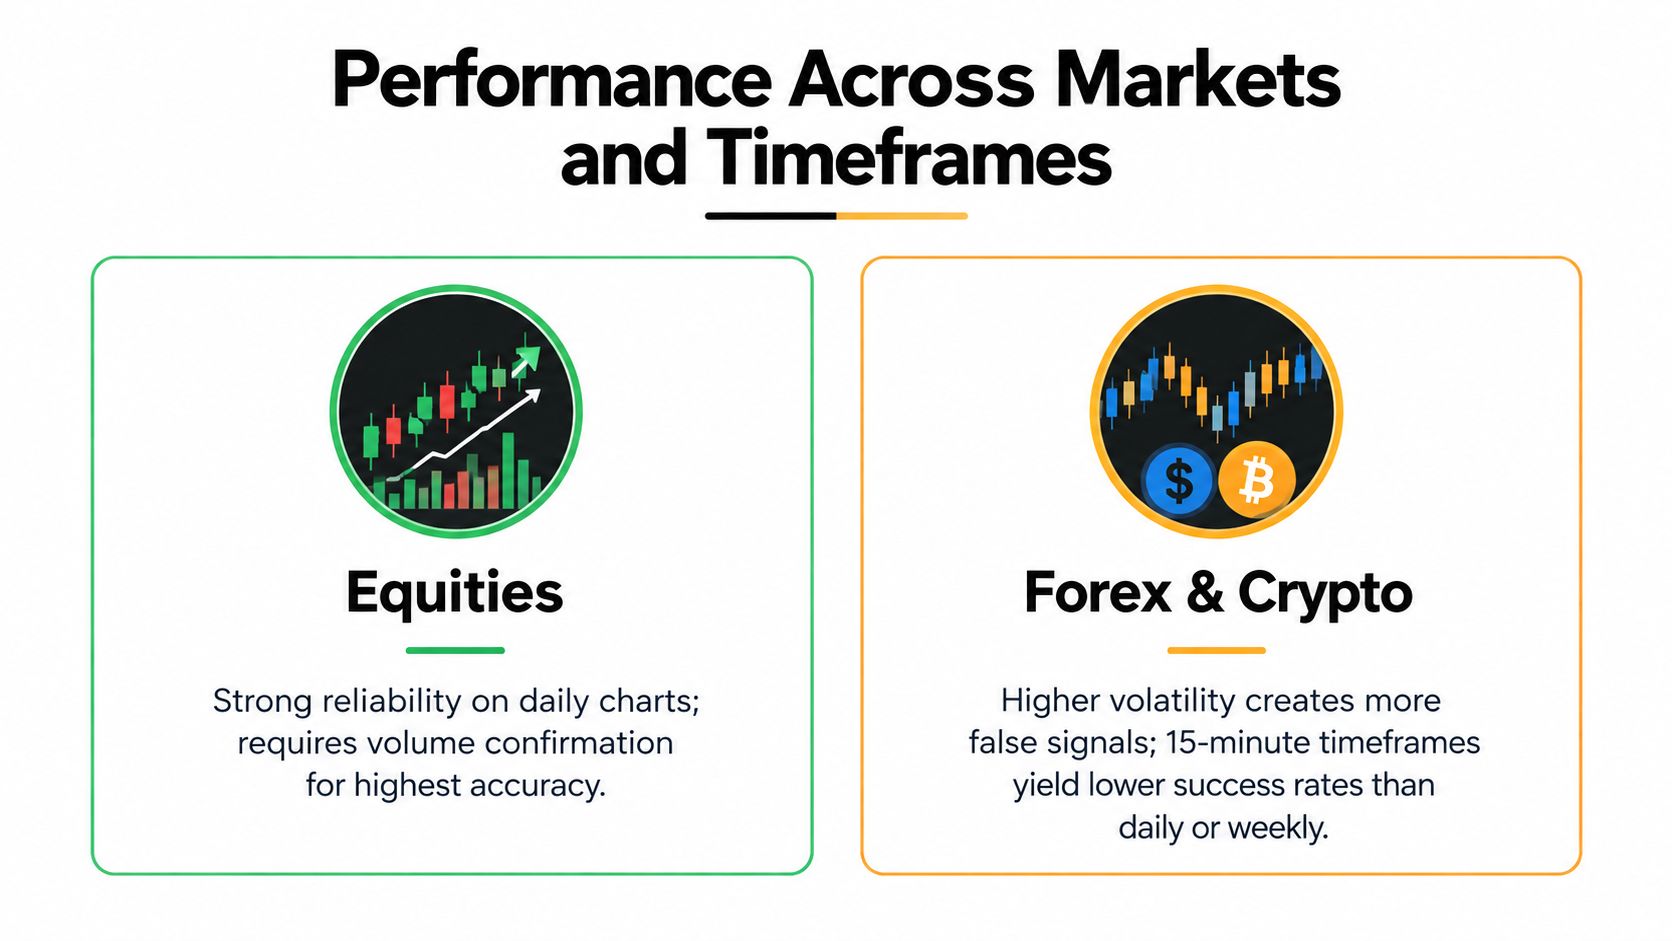
Daily equity charts, major currency pairs, crypto markets, and intraday futures don't provide the same trading environment. Their sessions, liquidity, gaps, spreads, and reaction to news differ. A setup that looks clean on a daily chart can become a noisy sequence when compressed into an intraday interval.
Asset class changes the meaning of the candles
In traditional equities, a session gap can make the lower opening visually clear. In spot foreign exchange, the structure of trading and quoted prices differs, and transaction costs can consume a larger share of a modest move. In crypto, continuous trading changes how traders should interpret a gap requirement, while rapid price movement can create more false reversals.
The available cross-market evidence supports caution. A 2026 study concludes that Japanese candlestick signals are generally moderate and conditional rather than standalone predictors, with performance weakening sharply during crisis conditions and varying materially by market, timeframe, and volatility regime (2026 study of Japanese candlestick signals).
That doesn't justify declaring one asset class universally superior. It supports testing the exact setup you intend to trade. Define the market, candle interval, entry trigger, stop rule, exit rule, and costs before drawing conclusions.
Timeframe affects signal quality and cost
Higher-timeframe candles aggregate more orders and often present cleaner structure. Lower-timeframe candles form more frequently, but their apparent reversals can reflect short-lived order flow rather than a meaningful shift in the broader auction. A trader using a short interval should therefore demand stronger alignment from a higher timeframe and account for spread and slippage.
Market regime matters just as much. During stable conditions, a piercing line at support may provide a useful confirmation signal. During a crisis, rapid repricing and discontinuous moves can invalidate the assumptions behind a neat two-candle structure.
A sensible comparison looks like this:
| Environment | Main advantage | Main risk |
|---|---|---|
| Daily equities | Clearer session structure and visible support areas | Gaps can extend beyond planned entries or stops |
| Spot forex | Deeply traded pairs can offer repeatable historical testing | Spread and execution costs can reduce a small edge |
| Crypto | Continuous markets create frequent price-action opportunities | Volatility and rapid reversals can produce false confirmation |
| Intraday charts | Defined sessions allow precise execution rules | Noise and transaction costs can dominate the signal |
The correct conclusion is conditional. Don't transfer a rule from one market to another without testing it. Treat the piercing line as a setup whose value depends on context, regime, execution, and payoff structure.
Confirmation Criteria and Trade Execution
A piercing line earns attention at the close, not automatic entry. Treat it as a conditional setup. The next task is to test whether buyers can extend the recovery, whether participation supports the move, and whether the potential reward justifies the structural risk.
The conservative trigger is a later close above the pattern high. This sacrifices some entry price, but it reduces the chance of treating one bullish session as a completed reversal. An earlier entry near the second candle's close can work only with stronger location, clear volume support, and enough room to the target.
A strict execution sequence
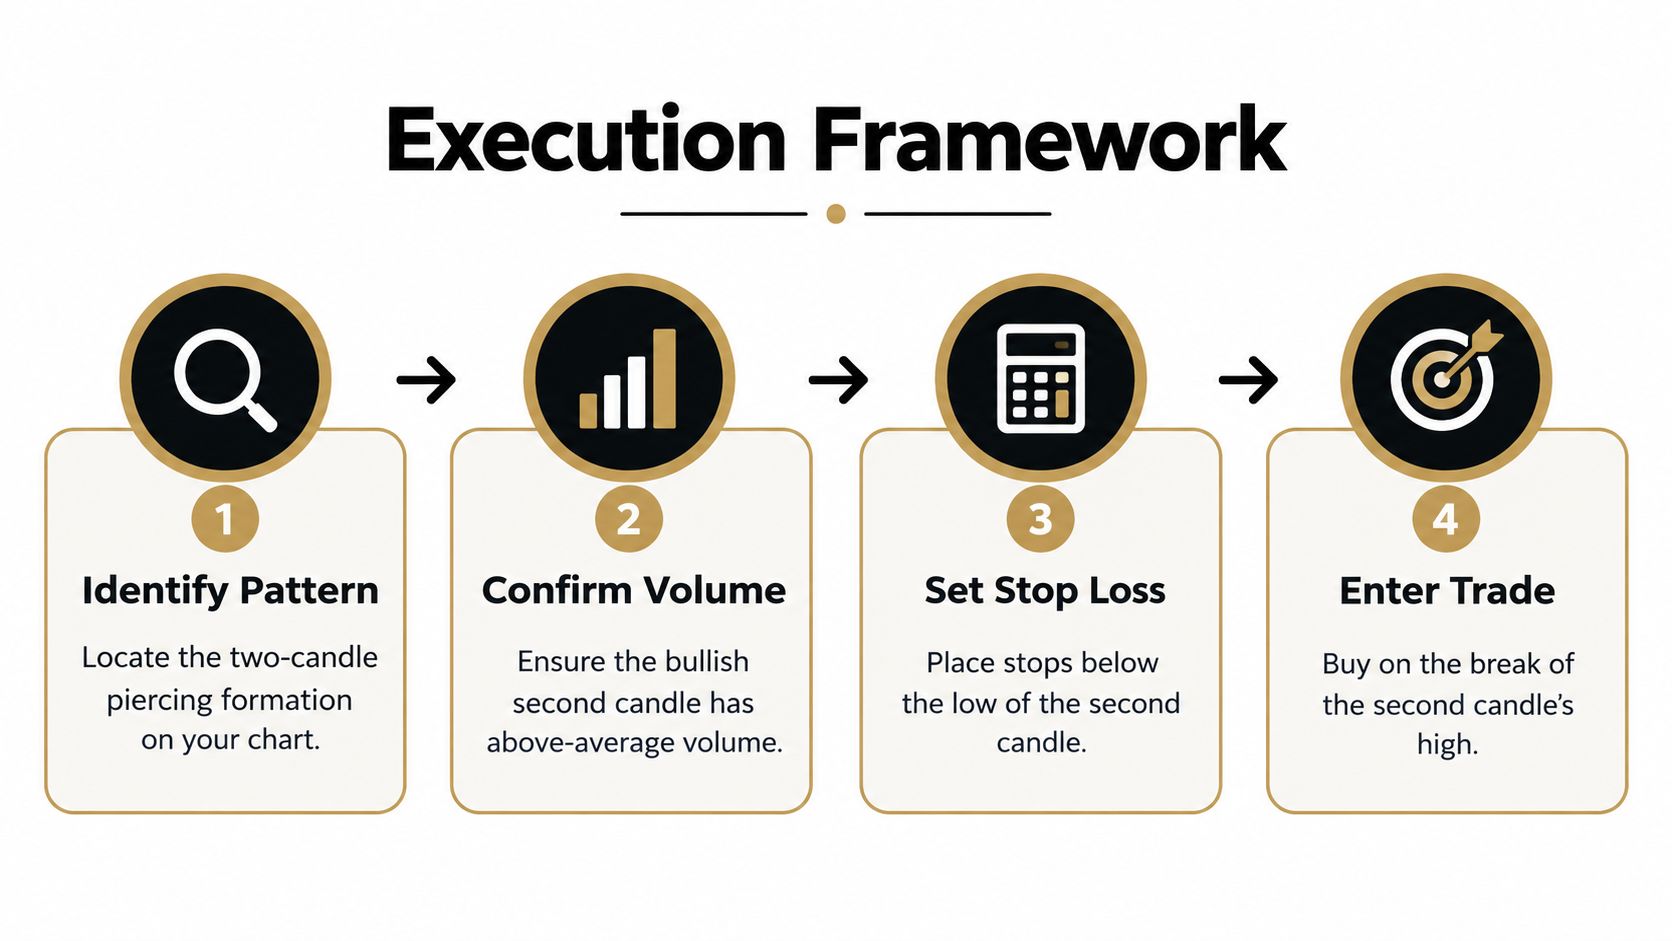
Mark the context. Confirm a meaningful decline and identify the nearest support or demand area. A formation in the middle of a range deserves a lower priority before any entry is considered.
Validate the two candles. Check the first bearish body, the second bullish body, the lower opening or displacement, and the close above the first body's midpoint. A wick recovering into the prior candle does not replace a real-body close.
Assess participation. Compare bullish volume with recent activity and judge whether the recovery attracted meaningful demand. Volume cannot guarantee follow-through, but declining participation weakens the case that buyers have taken control.
Wait for confirmation. A close above the pattern high supplies a clear bullish trigger. Traders entering near the second close accept greater failure risk, so the setup needs better location or a more favorable payoff.
Define invalidation before entry. A close below the second candle's low invalidates the bullish thesis. Treat the stop as the price level that proves your original explanation wrong, nothing more. Set it beyond the relevant structure, then calculate position size from that distance.
Map the target. Use the next meaningful resistance or prior swing high as the first objective. If resistance is too close to provide an attractive payoff, skip the trade rather than force the pattern.
For practical guidance on the mechanics, see how to enter a trade. Entry quality has to remain connected to invalidation and position size from the start.
Build expectancy through asymmetry
A strategy can remain viable with a sub-50% win rate when average winners materially exceed average losers. That outcome requires consistent execution, selective entries, and the discipline to accept planned losses. The foreign-exchange study found that a 2:1 reward-to-risk framework increased total returns to approximately 268%, even though profitable trades fell by half. The result belongs to the tested approach, not to every piercing line, but it demonstrates why payoff asymmetry can matter more than a flattering hit rate.
Never widen a stop to preserve a trade. Reduce the position when the structural stop is wide, or reject the setup when its required risk does not fit the plan. Trade geometry determines whether a visually convincing candle deserves capital.
Common Pitfalls and Invalidation Signals
The pattern fails most often when traders promote a clue into a conclusion. They buy during sideways movement, ignore the level beneath the candle, or enter after an extended rally has already consumed the available reward.
Volume deserves special attention. Available coverage identifies declining volume and a close below the prior candle's midpoint as primary failure conditions, while also warning that spread, slippage, losses, and poor position sizing can overwhelm a favorable hit rate (coverage of piercing line failure conditions).
Conditions that should make you stand aside
- No meaningful downtrend: Without prior bearish structure, the formation lacks reversal context.
- Weak penetration: If the second candle doesn't close above the first body's midpoint, sellers haven't been decisively challenged.
- Poor location: A setup beneath nearby resistance may have too little room to reach a worthwhile target.
- Falling participation: Declining volume during the recovery reduces confidence in sustained demand.
- Immediate rejection: A fast move back beneath the second candle's low invalidates the bullish explanation.
- No follow-through: If price can't extend above the pattern high, treat the signal as unconfirmed rather than inventing a reason to stay long.
- Emotional stop management: Moving the stop farther away changes the trade instead of improving it.
A time-based rule can also help. If the market fails to follow through within the holding window defined by your strategy, reassess the position instead of allowing stagnant capital to become an unplanned long-term investment. The exact window must come from your testing and timeframe, not from a universal rule.
A final decision filter
Before entering, write down the reason for the decline, the level that attracted buyers, the confirmation trigger, the invalidation price, and the first resistance target. Then calculate whether the potential reward justifies the distance to the stop after costs.
If you can't identify those points clearly, the pattern isn't ready to trade. The most useful piercing line may be the one you correctly reject.
Colibri Trader offers price-action education focused on market structure, supply and demand, pattern recognition, and disciplined trade management, including material relevant to setups such as the piercing line. Review the practical lessons and trading programs at Colibri Trader before applying this pattern with real capital.