




Does Price Action Trading Work? the Real Data

Most advice about price action trading starts with the wrong question. Asking “does price action trading work?” suggests that a chart pattern either produces profits for everyone or has no value at all. Markets don't offer such a clean verdict. A setup can contain useful information, yet still lose money after spreads, commissions, slippage, financing, margin costs, taxes, and execution mistakes.
The more rigorous question is whether a price-action process produces positive net expectancy in a defined market, over a defined sample, with realistic costs and disciplined risk controls. Academic evidence offers a sobering baseline. A minority of active traders can remain profitable, but persistence, confidence, and attractive chart examples aren't enough to establish a durable edge.
Redefining What It Means for a Strategy to Work
A price-action pattern can be predictive without being profitable. That distinction is easy to miss because chart reviews show the signal clearly. A trader marks support, waits for a rejection candle, enters after confirmation, and sees price move in the expected direction. The screenshot looks persuasive. It says nothing about how often the setup fails, how far price moves before reversing, or whether the expected move covers the cost of entering and exiting.
A useful trading method must survive three tests:
- Statistical validity: The pattern must perform better than a reasonable benchmark across a defined sample.
- Economic viability: The average gain must exceed spread, commission, slippage, financing, and other deductions.
- Operational consistency: A real trader must execute the rules without changing position size, entry criteria, or exits under pressure.
The first test concerns the chart. The second concerns the account. The third concerns the person operating the account.
Gross expectancy is not net expectancy
Suppose a setup produces favorable outcomes in historical candles. Its gross expectancy reflects the average result before trading friction. Net expectancy subtracts every cost associated with implementing the trade. A setup that captures small movements may look excellent before costs and unattractive afterward, especially when it generates frequent entries or operates in a market with variable spreads.
This explains why a high win rate doesn't prove profitability. A method can win frequently while allowing occasional losses that are much larger than its average gains. The reverse can also happen. A strategy with many losing trades may remain viable if its winners are sufficiently large, its losses are controlled, and its trading costs remain proportionate to the opportunity.
Practical rule: Never validate a pattern from chart direction alone. Validate the amount captured after a complete round trip.
The historical evidence is mixed rather than conclusive. One study examining selected candlestick patterns across currency markets reported strong gross returns after transaction costs, but also found that spreads were a substantial burden and that volatility and rollover costs materially affected results. Other research has found that technical rules can lose their apparent performance once frequent-trading costs are included. The implication isn't that patterns are useless. It's that the pattern is only one component of the trading proposition.
For a small account, this distinction becomes decisive. A visually convincing setup may have historical information value but require a price move too large to capture consistently after friction. A strategy therefore “works” only in relation to its instrument, timeframe, execution method, account size, and risk constraints.
The Core Mechanics of Price Action Analysis
Price action analysis treats the chart as a record of an ongoing auction. Buyers and sellers continuously submit orders, accept or reject prices, and reveal urgency through the distance, speed, and location of price movement. A candle doesn't expose every order in the market, but it summarizes the result of that interaction over a chosen interval.
A wide bullish candle that closes near its high suggests that buyers controlled the auction during that period. A long upper wick near a prior resistance area suggests that higher prices attracted selling or profit-taking. Neither observation guarantees the next move. Each gives a trader a hypothesis that must be tested against location, context, volatility, and subsequent behavior.
Supply, demand, and market structure
Support and resistance are reference areas where price has previously met opposing interest. Support can indicate that buyers previously absorbed selling pressure. Resistance can indicate that sellers previously supplied liquidity or that buyers became unwilling to pay higher prices. These areas aren't permanent walls. Once new information enters the market, price can move through them, return to test them, or fail after a brief breakout.
Supply-and-demand analysis adds a broader interpretation. A demand zone may represent an area where aggressive buying previously exceeded available selling. A supply zone may mark a region where selling pressure overwhelmed buyers. Traders often combine these areas with market structure, tracking whether price is forming higher highs and higher lows, lower highs and lower lows, or a less directional range.
The practical value lies in turning visual observations into conditional rules. “Price looks bullish” isn't a rule. “If price returns to a pre-defined demand area, forms a specified rejection pattern, and invalidates below a fixed level, then I will consider an entry” is testable.
Candlestick formations can help describe aggression, hesitation, or rejection, but the same candle can mean different things in different locations. A pin bar at a major level after an extended move isn't equivalent to a pin bar in the middle of a noisy range. A breakout candle during active participation isn't automatically comparable to one produced in thin conditions.
For a structured explanation of how these observations fit together, traders can review market structure analysis. The important principle is to treat price action as contextual evidence, not a collection of magical symbols.
Tools that assist with pattern recognition can help organize chart review, provided they don't replace validation. A useful introduction to trading pattern analysis with AI can clarify how automated systems classify recurring visual structures. Classification still isn't proof of future profitability. The trader must define the rules, test unseen data, and measure the result after costs.
The mechanics become more useful when paired with a clear invalidation point. If price breaks the level that made the setup attractive, the original thesis has weakened or failed. That response is more disciplined than moving the stop, adding to a losing position, or inventing a new explanation after the fact.
What Academic Data Reveals About Trader Survival
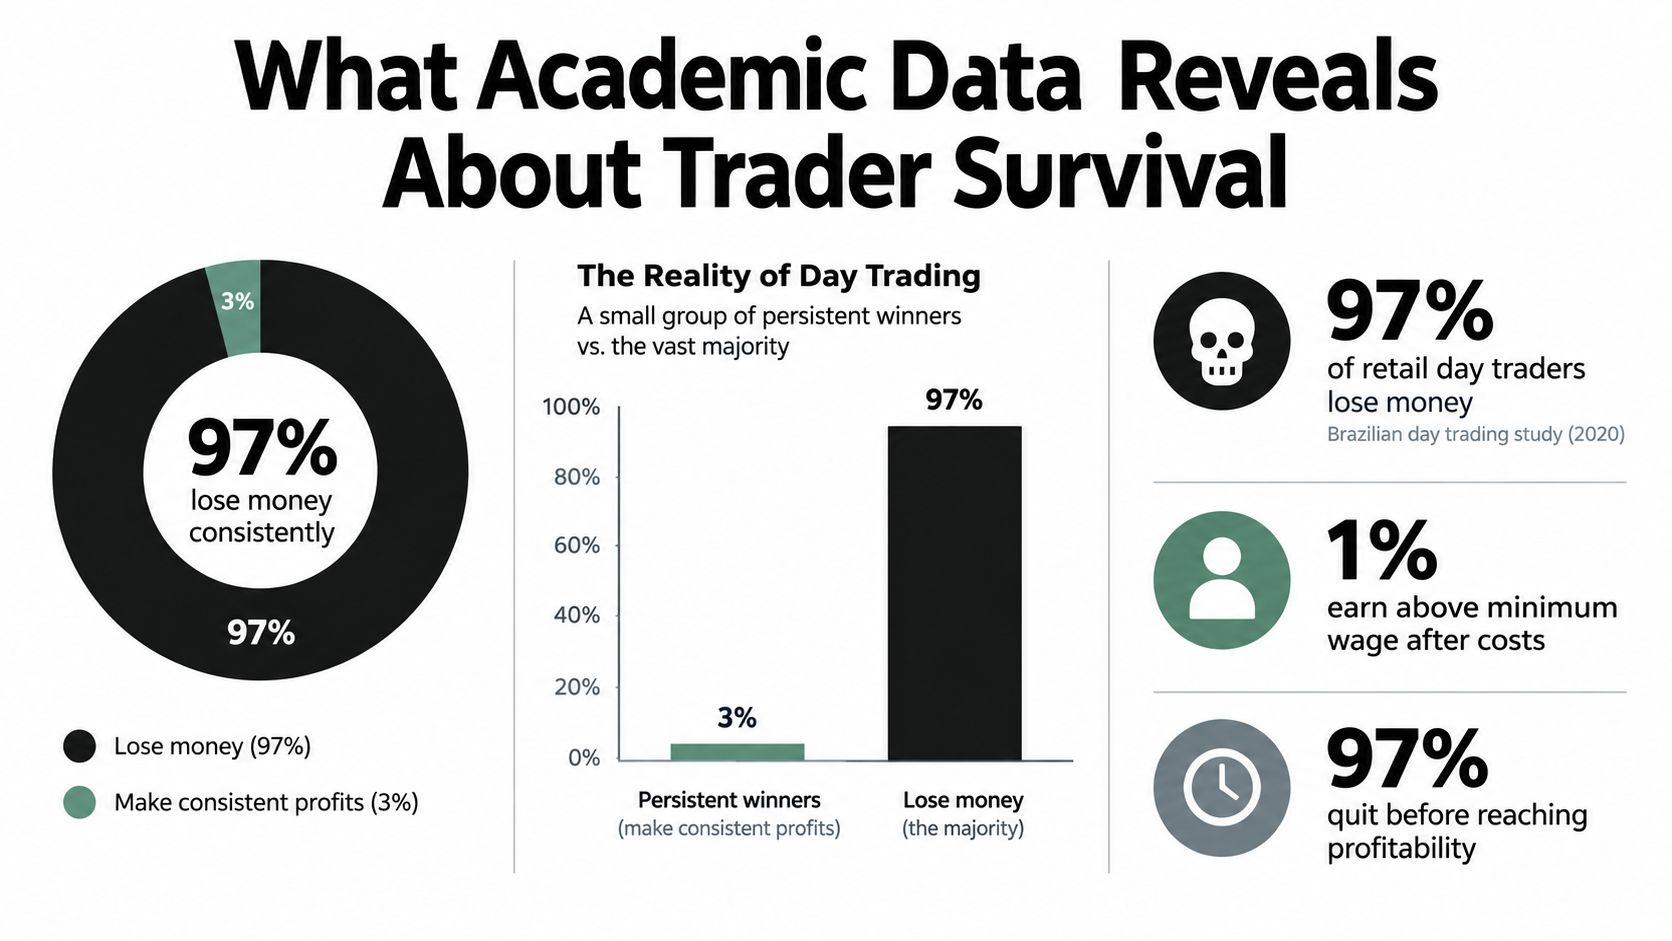
The broad outcome data should make every claim about price action more modest. A 2003 study of 324 individual day traders, published in the Financial Analysts Journal, calculated results after commissions. It found that 116 traders, or 35.8%, recorded a net profit, while 208, or 64.2%, recorded a net loss. The same study reported that 25.0% lost at least $5,000 and 13.0% lost more than $10,000. These figures are reported in the Financial Analysts Journal study of individual day traders.
That evidence doesn't show that price action never works. The study didn't isolate candlestick formations, support and resistance, or supply-and-demand methods. It does show that active trading must overcome costs and execution difficulty even when traders believe they have a repeatable process.
Persistence isn't the same as profitability
Evidence from Taiwan reached a similar conclusion. In a typical six-month period, more than 80% of day traders lost money after costs, while only 18% earned profits. Within the lowest past-performance group, 97% lost money. Those results indicate that prior participation or enthusiasm doesn't reliably translate into future success.
The most severe warning comes from research on Brazil's equity-futures market. Researchers tracked 19,646 people who began day trading between 2013 and 2015. Among traders who continued for more than 300 trading days, 97% lost money. Only 1.1% earned more than Brazil's minimum wage, and 0.5% earned more than the initial salary of a bank teller, despite the time and risk involved. The findings appear in the Brazilian equity-futures day trading research.

The Brazil study doesn't identify which methods participants used, so it can't establish a failure rate for price action specifically. Its value is different. It sets a realistic survival benchmark for anyone claiming that a visually simple approach can provide dependable income. A small minority succeeding is entirely compatible with very poor aggregate results.
What these findings do and don't prove
The evidence supports several conclusions:
- Price action can work for some traders. The existence of profitable minorities means a universal claim that every price-action method fails would also go beyond the data.
- Persistence alone isn't an edge. Traders who remain active for a long time still face losses if their method doesn't produce positive net expectancy.
- Pattern success must be conditional. Results may depend on market selection, timeframe, margin usage, execution quality, and behavioral control.
- Profitability claims require evidence. A strategy needs defined rules, realistic costs, risk controls, and testing outside the period used to develop it.
Readers looking for a broader discussion of the question can examine whether trading is profitable, but the central lesson is already clear. Price action isn't exempt from the base rates of retail trading. The burden of proof remains with the method and the trader.
The Hidden Costs That Destroy Gross Expectancy
A chart records price, not the full cost of trading it. The difference matters most when a strategy targets modest movements, enters frequently, holds through financing periods, or trades instruments whose liquidity changes sharply during volatile conditions.
The bid-ask spread creates an immediate disadvantage. A trader buying at the ask and later selling at the bid needs favorable movement before the position reaches breakeven. A commission adds another deduction. Slippage occurs when the actual fill differs from the intended price, which can happen during fast markets, thin liquidity, or delayed execution. Overnight financing and rollover charges can further alter the result for positions held beyond the relevant session.
The burden differs by market. Forex traders must consider spread and rollover. Equity traders must account for spread, commissions where applicable, and gaps. Futures traders face exchange and broker costs alongside slippage. Crypto traders may encounter variable spreads, fees, funding arrangements, and abrupt liquidity changes. The exact amount depends on the instrument, broker, session, order type, and market regime, so a generic backtest assumption can mislead.
The minimum move is a calculation
A trader should estimate the minimum favorable movement required before entering. A simple framework is:
Required move = spread + commissions + expected slippage + financing or rollover + taxes and other charges + desired net profit
The formula isn't a promise of a particular outcome. It is a decision filter. If the anticipated movement is only marginally larger than the complete cost burden, the trade may have no practical margin for error. If the setup needs unusually favorable execution to remain profitable, it isn't suitable.
A study of 24 currency pairs and more than 112,000 daily candles found that selected candlestick patterns generated high gross returns, while also finding that spreads were a substantial burden and that volatility and rollover costs strongly affected results. The detailed findings are available in this study of candlestick patterns, spreads, volatility, and rollover costs.
| Metric | Gross Strategy | Net Strategy After Costs |
|---|---|---|
| Signal result | Measures movement before deductions | Measures the amount retained after deductions |
| Entry assumption | Assumes the intended entry price | Includes spread and possible slippage |
| Exit assumption | Assumes the intended exit price | Includes exit friction and execution variation |
| Financing | Often omitted or simplified | Includes rollover or funding where applicable |
| Decision value | Shows whether a pattern may contain information | Shows whether the information can support a tradeable edge |
The table exposes the problem with many attractive chart studies. A pattern can have historical predictive value while failing the account-level test. Frequent signals magnify the effect because each round trip creates another opportunity for costs to consume the expected gain.
The right question isn't whether price moved after the pattern. It's whether the trader captured enough of that movement to pay every cost and still retain a positive expectancy.
Timeframe selection follows from this logic. A slower setup may provide fewer opportunities, but its expected movement can offer more room relative to execution friction. A faster setup may produce precise entries, yet its edge can disappear when fills, spreads, and human delays are included. Neither timeframe is automatically superior. The trader must measure the relationship between opportunity size and total cost.
Isolating the True Edge in Your Trading Plan
Price action isn't a single variable. It's a bundle of decisions that includes where to trade, when to enter, how much to risk, where the idea is invalidated, and when to exit. If a strategy produces favorable results, the pattern may deserve only part of the credit. Market selection, limited risk exposure, and consistent execution may create the conditions in which the pattern becomes usable.
A practical plan separates those components before testing:
- Define the market and context. Specify the instrument, trading session, directional environment, and locations where the setup is permitted. A rejection near a meaningful structure level should not be mixed indiscriminately with the same candle in a featureless range.
- Write the entry trigger. State what must happen before an order is placed. Avoid subjective instructions such as “enter when momentum looks strong.”
- Set invalidation before entry. The stop should identify where the original reasoning no longer applies. It shouldn't be moved solely to avoid accepting a loss.
- Specify the exit logic. Use a defined target, trailing condition, opposing structure, or another rule that can be recorded consistently.
- Fix the position-sizing method. The trade size should follow the permitted risk and stop distance, not the trader's excitement about the setup.
Risk controls can determine whether the signal survives
Forex research found profitability for particular chart patterns when paired with constrained use of margin and risk management, reporting about 11% annually over 2000–2018 while limiting trades to 10% of offered margin. The study also emphasized that spreads and rollover materially influenced results. Those findings appear in this research on chart patterns, leverage, and risk management in forex.
The result shouldn't be interpreted as a universal return expectation. It describes a specific research design, market, period, and risk constraint. Its broader value is methodological. A pattern's outcome depends on the exposure applied to it and the costs imposed by the market.
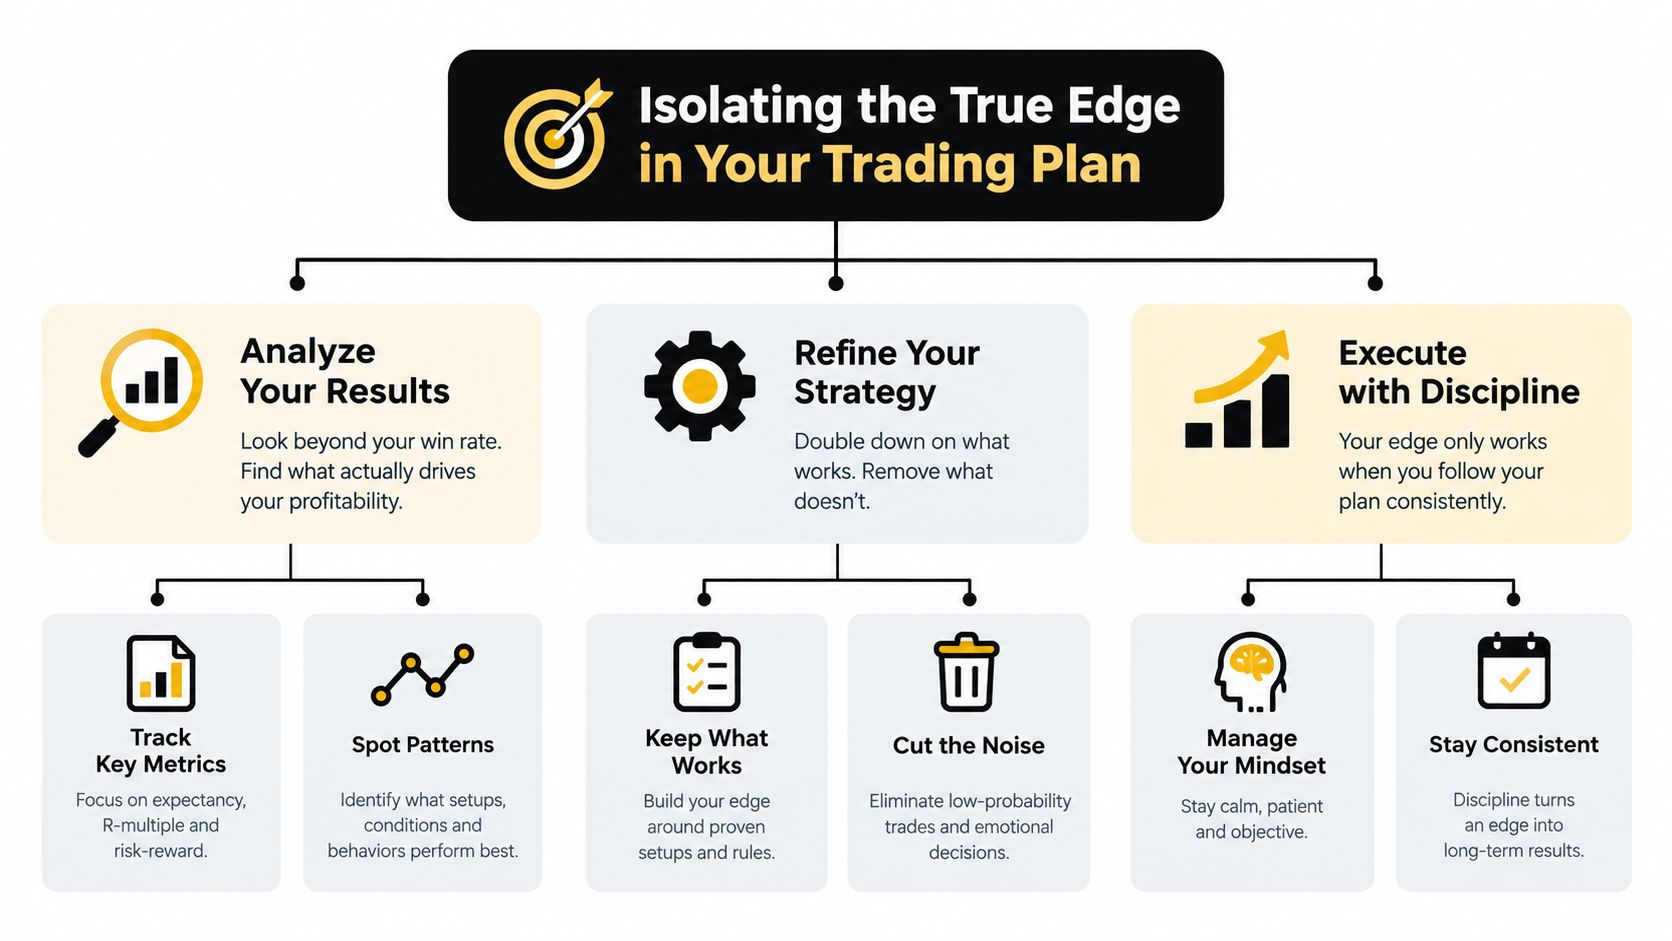
A trader should also record behavioral variables. Did the entry occur at the planned level? Was the stop widened? Did the trader skip a valid signal after a previous loss? Did position sizing change because the setup looked unusually clear? These details help distinguish a weak pattern from weak implementation.
The true edge may therefore be less visually dramatic than the chart suggests. It could come from waiting for specific locations, reducing low-quality trades, maintaining small and consistent exposure, or refusing to interfere with an invalidated position. Price action supplies the language for the decision. The process determines whether that language becomes a measurable advantage.
Common Mistakes That Guarantee Failure
Most price-action failures don't begin with a misunderstanding of candlestick terminology. They begin when traders convert an uncertain method into an oversized financial commitment. A trader sees a familiar pattern, increases their position size, and treats the setup as a forecast rather than a conditional hypothesis.
Over-exposure turns ordinary variance into account damage. Even a method with positive expectancy can experience consecutive losses. Excessive exposure leaves the trader unable to follow the plan through that sequence and creates pressure to recover quickly.
Revenge trading replaces a rule with an emotion. After a loss, the trader may enter a lower-quality setup, increase size, remove a filter, or trade outside the planned session. The next result then becomes difficult to interpret because the original method was no longer used.
Context-free pattern matching creates false confidence. A pin bar, engulfing candle, or breakout doesn't carry identical meaning everywhere. Traders who ignore trend, range conditions, nearby structure, and liquidity often count visually similar formations as one setup even though their market environments differ.
Strategy switching destroys learning. A trader changes methods after a short drawdown, then has no clean sample from which to evaluate any approach. The problem isn't that adaptation is always wrong. The problem is changing rules before distinguishing normal variation from a genuine failure of expectancy.
Win rate can conceal poor economics
A high win rate may coexist with negative results when losing trades are much larger than winners or when costs consume the average gain. A lower win rate can be acceptable when winners are larger, losses are controlled, and trade frequency remains compatible with execution quality. The relevant measure is the complete distribution of outcomes, not the percentage of green trades shown in a journal.
A disciplined alternative looks less exciting:
- Use one written setup definition: Don't relabel a different pattern as the same trade after entry.
- Cap position exposure: Size positions so a normal losing sequence doesn't force emotional decisions.
- Respect invalidation: Exit when the premise fails instead of negotiating with the chart.
- Review behavior separately from results: A profitable trade can still violate the plan, while a losing trade can be correctly executed.
- Pause after rule violations: Prevent one emotional decision from becoming a new trading routine.
The retail trader's advantage isn't guaranteed by seeing more patterns. It comes from avoiding decisions that make a valid test impossible.
How to Test and Validate Your Price Action Strategy
A serious test starts with a written hypothesis, not a collection of screenshots. Define the market, timeframe, session, setup location, entry trigger, stop condition, exit rule, position-sizing method, and cost assumptions before reviewing results. If the rules change during the test, label the new version separately.
Use a journal that records more than win or loss. Each trade should include the planned entry, actual fill, stop distance, exit, spread or estimated spread, slippage, financing where relevant, reason for entry, and any deviation from the plan. Record the market context as well. A setup that succeeds only in one directional environment shouldn't be presented as a universal pattern.
A practical validation sequence
- Formulate the rule. Make the setup specific enough that another person could identify it without your explanation.
- Test historical data carefully. Avoid selecting only the most attractive examples. Include failed breakouts, missed entries, ambiguous candles, and periods when the pattern appears repeatedly.
- Apply realistic costs. Subtract spread, commission, slippage, rollover, and other relevant charges from every trade rather than applying a broad adjustment at the end.
- Separate development from evaluation. Use one period to refine the rules and a later, unseen period to evaluate them. Reusing the same data until the results look attractive creates a data-snooping risk.
- Forward-test with controlled exposure. Observe whether live execution differs from the historical assumptions before treating the method as ready for meaningful capital.
- Review the full distribution. Track net expectancy, drawdown, losing streaks, average win, average loss, trade frequency, and the effect of omitted or late trades.
A walk-forward process is particularly useful because it tests whether a rule continues to function after development conditions change. Traders can study walk-forward testing as a way to separate strategy refinement from evaluation on unseen conditions.
What would count as convincing evidence
No single backtest proves a strategy will remain profitable. Stronger evidence comes from agreement across several checks. The method should remain viable after realistic costs, avoid dependence on one unusually favorable period, and show that its risk controls limit damage when conditions change. It should also compare against a simple benchmark rather than assuming every positive result represents skill.
Structured education can support the process when it teaches rules, market structure, supply and demand, journaling, and risk management rather than promising effortless income. Colibri Trader offers price-action-based programs, including beginner and specialized supply-and-demand or day-trading education, alongside practical material focused on discipline and money management. The value of any educational platform still depends on whether the trader applies its ideas through independent testing.
The final answer is conditional. Price action trading can work as a rules-based decision process for some traders, but chart patterns alone don't establish reliable profitability. The strategy earns credibility only when its net expectancy survives costs, remains controlled, and live behavior matches the tested plan.
Colibri Trader offers price-action education, supply-and-demand and day-trading programs, and practical guidance on discipline and money management for traders building a testable process. Visit Colibri Trader to review the available resources and turn your chart observations into clearly defined rules you can evaluate.