




Bear Market Strategies for Surviving the Crash

Your portfolio is down, every rally has failed, and the financial news keeps offering a new reason to expect another leg lower. You open a chart looking for a bottom, find a brief bounce, and feel the urge to buy before the market runs away without you. Then the bounce fails, support breaks, and a position that was meant to be a quick recovery trade becomes another decision made under pressure.
That environment demands a different operating system. Bear market strategies aren't about predicting the exact low. They're about reading supply and demand, limiting exposure, waiting for price confirmation, and keeping enough capital available to act when conditions improve. The historical record also argues for patience. U.S. equities have recovered from past bear markets, but the journey can be long and volatile, so preservation matters more than forcing large gains quickly. Colibri Trader's bear market guide offers useful context for recognizing that regime change before you commit capital.
Recognizing the Bear Market Reality
The regime often changes before the trader accepts it. A routine pullback becomes a failed bounce, then a breakdown that attracts fresh buying. After several rebounds lose momentum, the chart shows a different auction. Sellers use rallies to reduce exposure or open new shorts, while buyers struggle to hold gains.

The first adjustment is psychological. In a rising market, participation and expansion may justify adding exposure. In a decline, capital preservation, selectivity, and survival come first. A losing position is not automatically a bad trade, but keeping it without a defined invalidation point turns a plan into hope. Before searching for a BOSS pattern or a false breakdown, decide how much risk the account can carry if the setup fails.
Stop treating every dip as an invitation
A bear market has sellers controlling the larger structure, even when price rallies sharply. Relief rallies can look convincing, yet a rally alone does not confirm a reversal. Traders who buy each dip end up entering where sellers are still active.
Use a broader observation window before taking action:
- Trend structure: Mark meaningful swing highs and lows. Repeated lower highs and lower lows matter more than one green candle.
- Reaction quality: Compare responses at prior demand. A fast rejection followed by a close above the level differs from a weak bounce that stalls beneath resistance.
- Location: A lower price is not enough. A discount matters only when buyers show that they can defend it.
- Time horizon: If the money may be needed soon, a volatile recovery can force a sale during another decline.
For additional context on identifying the regime, see this bear market guide from Colibri Trader.
The historical backdrop supports restraint. From 1946 through 2022, the S&P 500 experienced 13 bear markets, with an average decline of about 33% and an average duration of 14 months. The average trip from peak to trough and back to breakeven took roughly 21 months after the bottom, according to Fisher Investments' historical bear-market analysis. These figures do not forecast the next decline. They show why buying aggressively after the first selloff can create a long recovery problem.
Practical rule: Your first job in a collapse is not calling the bottom. Stay solvent, keep liquidity available, and remain clear enough to recognize a genuine change in price behavior.
Widen the lens before narrowing the entry
Short-term traders still need precise entries, but the higher timeframe sets the risk context. If the larger chart continues printing lower highs, a long trade against that structure needs stronger confirmation and smaller risk than a setup aligned with the prevailing move.
Ask three questions before committing capital: Who controls the current range? Where did that side prove it? What price would invalidate the trade? Those answers shift the focus from predicting a low to observing whether demand can absorb supply. That is the foundation for managing false breakdowns and selecting price-action entries during a collapse.
Mastering Price-Action Shifts
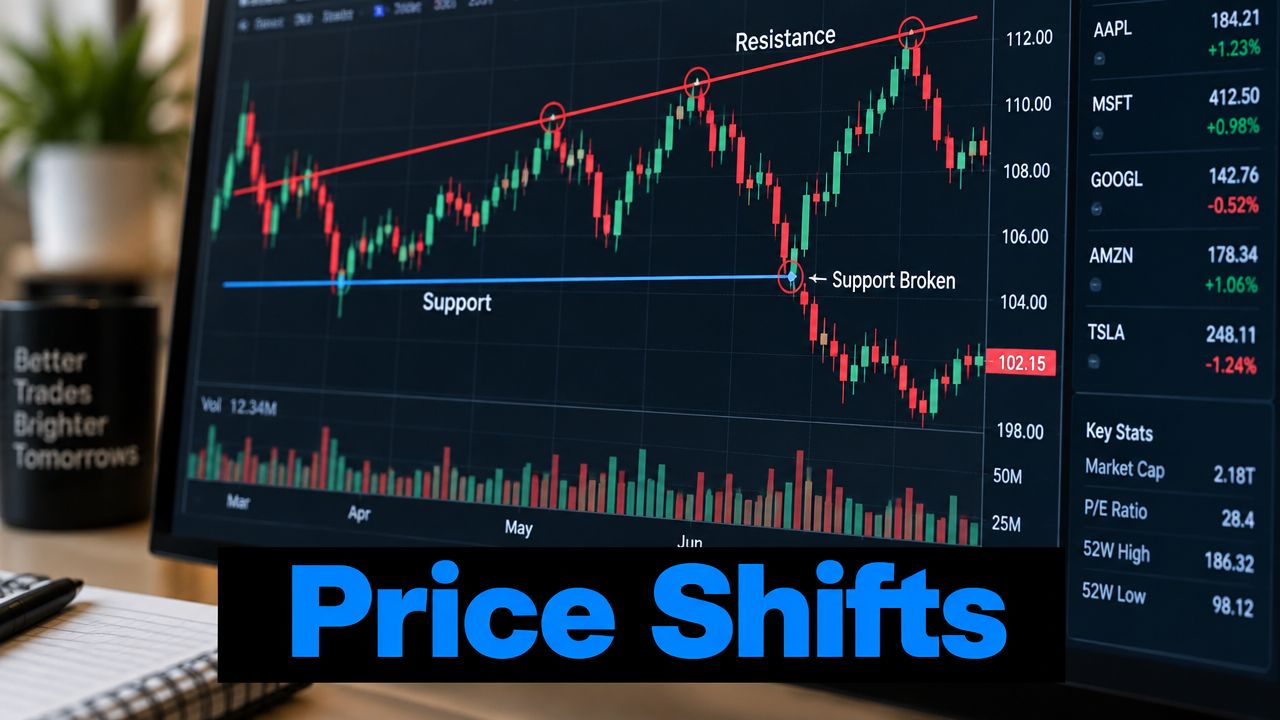
Bull-market habits fail when traders carry them unchanged into a decline. Support that held repeatedly can break on the next test, while resistance can become the level where sellers regain control. The chart hasn't become random. The market's response to levels has changed.
Read the sequence, not the isolated candle
Start by marking the last clear impulse down and the base or pause that preceded it. A sharp move away from a compact area suggests that orders were concentrated there. When price later returns, that area becomes a candidate supply zone if sellers previously drove price lower, or a demand zone if buyers produced a strong advance.
The zone isn't valid because it has a name. It matters because price left with force. A practical mapping process looks like this:
- Find the origin: Locate the final consolidation or opposing candle before the decisive move.
- Mark the range: Use the body and relevant wick area rather than drawing an artificially precise line.
- Check the departure: Strong displacement, limited overlap, and a clear break of structure make the zone more meaningful.
- Watch the retest: A return that stalls, rejects, or forms a lower high supports the bearish interpretation.
- Define invalidation: If price accepts above the supply area and creates higher-timeframe strength, the short thesis needs review.
This approach relies on what price did, not on an indicator telling you what price might do. Traders looking to formalize that method can study pure price action trading as a framework for reading structure without filling the chart with lagging signals.
Treat broken support as information
A broken support level creates a decision point. If price falls through it and later rallies into the underside, the former support may act as resistance. That retest can offer a cleaner short location than selling during the initial breakdown, because the stop can sit beyond the zone that invalidates the idea.
Don't assume every break will behave that way. A market can break support, reclaim it, and continue higher. The quality of the reclaim matters. A fast recovery that holds above the level is more constructive than a brief wick followed by another close beneath it.
| Price behavior | What it suggests | Safer response |
|---|---|---|
| Lower high below broken support | Sellers remain active | Look for a defined short trigger |
| Reclaim and hold above support | Breakdown may have failed | Avoid chasing the short |
| Repeated rejection at supply | Offers continue to absorb buying | Wait for confirmation or stay out |
| Higher high after a base | Structure is improving | Reduce bearish bias, don't assume full reversal |
The key is to respect lower highs and lower lows until price invalidates them. A single rebound doesn't erase a bearish sequence. Conversely, a trader shouldn't stay stubbornly short after the market has clearly reclaimed supply and established a stronger structure.
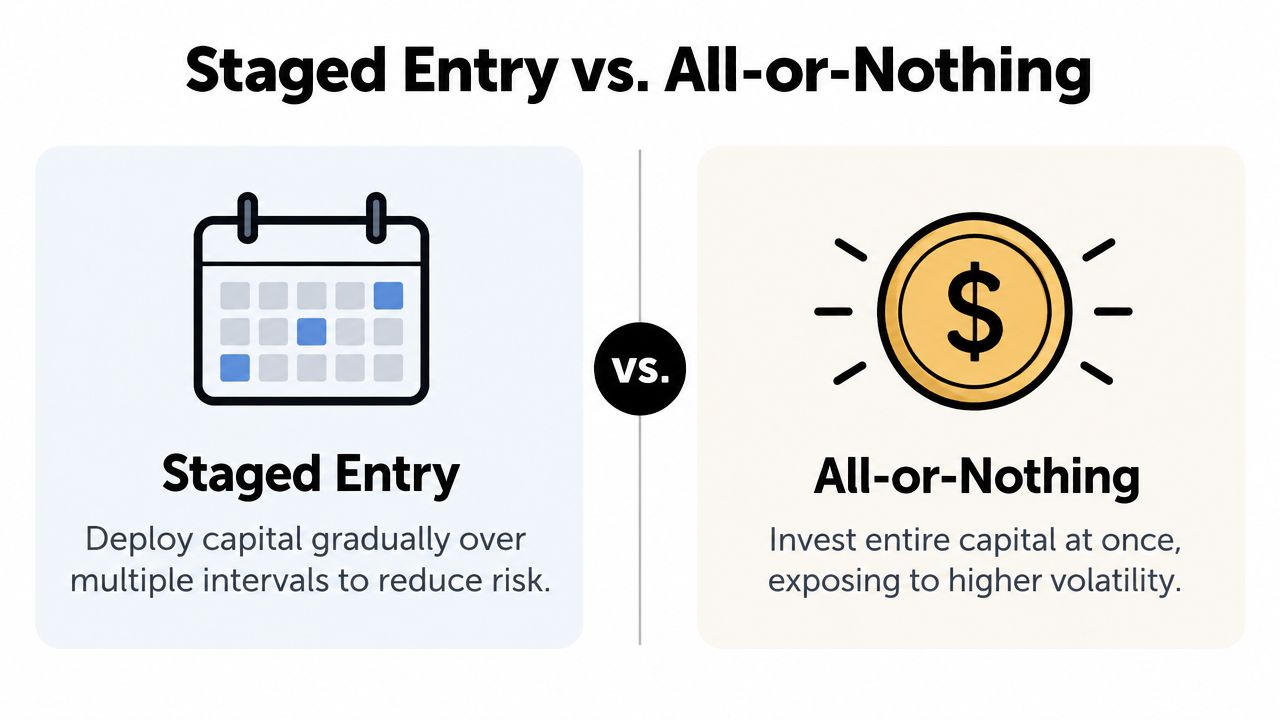
Staged Entry vs. All-or-Nothing
All-at-once buying feels decisive, especially after a frightening decline. It also creates a binary outcome: if the market continues lower, the trader has no planned capital left for better prices or clearer confirmation. Staged entry replaces that emotional wager with a sequence of decisions.
The historical reason is straightforward. Bear markets have averaged about 14 months in duration and roughly 34% in decline, while individual episodes have ranged from about three months to three years, according to Charles Schwab's bear-market investing guidance. A trader who commits everything at the first sharp fall may be early for a long time.
Compare the two approaches honestly
All-or-nothing deployment offers immediate exposure if the low arrives soon. Its weakness is path risk. If price keeps falling, the trader experiences the full drawdown immediately and may abandon the position before recovery.
Staged deployment sacrifices the emotional satisfaction of catching one perfect entry. In return, it spreads the decision across multiple opportunities. Some tranches may be early, but later purchases can be made at lower prices or after the chart begins to stabilize.
A workable plan should specify the rules before the next panic:
- Reserve capital: Decide how much remains uncommitted. Cash is not wasted when it prevents forced decisions.
- Use tranches: Divide the intended allocation into several portions rather than one order.
- Set conditions: Tie each purchase to a price-action event, such as a defended demand zone, a reclaimed level, or a confirmed higher low.
- Rebalance deliberately: Direct new capital toward positions that have fallen below their target weight, rather than adding randomly to the most exciting chart.
- Review the thesis: If the instrument's structure deteriorates further, pause the next tranche instead of treating the schedule as automatic.
Avoid the false comfort of cheapness
A falling price can remain weak longer than a trader expects. The deepest U.S. bear market in the historical context provided, from 2007 to 2009, declined about 59%, substantially more than the average, as noted in Schwab's guidance. That comparison matters because a strategy designed only for an average decline may be too aggressive for an unusually severe regime.
Staged entry also works for active traders, not just long-term investors. A trader can scale into a setup only after price returns to supply, confirms rejection, and offers a defined stop. If the first entry fails, the loss is contained and the next decision remains available. The method doesn't remove risk. It prevents one early opinion from consuming the entire risk budget.
Executing Safe Trade Setups
The cleanest bear-market trade often appears after the obvious breakdown, not during it. When price collapses through support, late sellers rush in, short sellers press the move, and trapped longs exit. That can produce a sharp rebound that looks bullish but is only a reaction to crowded positioning.
Separate a breakdown from a false breakdown
A false breakdown occurs when price moves below a watched level, fails to attract sustained selling, and then reclaims the level. The reclaim alone isn't enough. You want to see whether buyers can hold above it and whether the next pullback forms a higher low rather than immediately collapsing again.
A practical filter:
- Mark the prior level: Identify support that mattered on the chart, not an arbitrary line.
- Wait for the break: Don't assume a wick below support confirms weakness.
- Observe acceptance: Several closes beneath the area favor continuation, while a rapid reclaim warns that the break may have trapped sellers.
- Demand follow-through: A higher low and a break of the short-term reaction high provide stronger evidence than one reversal candle.
- Define the trade: Enter only when the setup offers a logical stop and a reward that justifies the risk.
BOSS-style thinking becomes useful here. Treat the breakout or breakdown, the origin of the move, the structure, and the signal as separate questions rather than one impulsive decision. Price can break a level and still fail. A reversal becomes more credible when the market reclaims the level, rejects the breakdown area, and changes its sequence of highs and lows.
Sell rallies into supply, not panic
When the larger structure remains bearish, a rally into a fresh supply zone can offer a more controlled short than chasing a red candle. Look for a base before an aggressive decline, then wait for price to revisit that area. A bearish rejection, a lower-timeframe lower high, or a failed attempt to hold above the zone can become the entry trigger.
The stop belongs beyond the technical area that invalidates the setup. A dollar-based stop placed at a convenient distance has no connection to the chart. If price breaks and holds beyond the supply zone, the premise is wrong or at least incomplete, so the trade should be closed according to the plan.
Risk rule: A stop-loss should answer one question, “At what price is this setup no longer valid?” It shouldn't answer, “How much money am I comfortable losing?”
Know when not to trade
Some breakdowns offer no clean retest. Others move directly into major demand, where shorting leaves little room before a reaction. Stand aside when the level is unclear, the spread is unstable, the stop is too wide, or the trade depends on guessing whether a single candle marks the low.
The same discipline applies to long reversals. A reclaimed support level with a higher low can justify a small, defined-risk attempt. It doesn't justify full exposure while the higher-timeframe trend still points down. In a collapse, selectivity is a position.
The Math of Position Sizing
Position sizing turns a market view into a defined financial decision. A trader can identify a clean supply zone and still damage an account by using the same lot size in a calm market and during a violent selloff.
The average decline across U.S. bear markets from 1946 through 2022 was about 33%, a useful stress reference rather than a forecast. A decline of that scale can expose oversized positions, correlated holdings, and the difference between strong conviction and genuine risk capacity.
Use a fixed-risk formula
The basic calculation is:
Position size = account risk ÷ risk per unit
Account risk is the amount you have chosen to lose if the stop is reached. Risk per unit is the entry-to-stop distance for a long trade, or the stop-to-entry distance for a short trade, adjusted for contract value where applicable.
Set up the trade in this order:
- Choose the maximum loss as a small, fixed share of the account.
- Place the stop beyond the supply or demand area that invalidates the setup.
- Measure the distance between entry and stop.
- Divide the permitted loss by that distance.
- Reduce the result when several positions depend on the same market driver.
The sequence matters. Choosing the lot size first and then moving the stop closer to make the trade fit produces a technically weak stop. Ordinary volatility can remove the position before the price-action idea has a chance to work.
Reduce exposure when the regime worsens
Bear markets can bring wider ranges and stronger correlation at the same time. Positions that look diversified may fall together during broad liquidation. Cut total exposure when ranges expand, breakouts fail repeatedly, or related instruments print a cascade of lower highs.
A position size calculator can turn the rule into a repeatable number, but it cannot determine whether a BOSS pattern, false breakdown, or retest provides enough edge to justify that risk. Setup quality remains the trader's responsibility.
Track planned risk, realized loss, entry quality, and stop discipline. The aim is not to eliminate losing trades. It is to keep a losing streak within a defined operating cost instead of allowing it to threaten the account.
Psychological Resilience and Recovery
After several stopped trades, even a sound setup can feel dangerous. The trader starts moving stops, skipping valid entries, or increasing size to recover losses quickly. That reaction is understandable, but it turns a difficult market into a personal contest.

Resilience isn't optimism about the next candle. It's the ability to follow a process while the outcome remains uncertain. Before the session, define the instruments you'll trade, the zones that matter, the maximum exposure, and the conditions that require a pause. During the session, execute only what qualifies.
Preserve the right to participate
The rebound data gives that discipline a practical purpose. Since 1950, the S&P 500 has averaged a 37% total return in the 12 months after a bear-market low, according to the historical review of bear-market recoveries. The same review cites a long-run finding that the index stood higher five years later after each of the 18 biggest market declines since the Great Depression, with those five-year periods averaging more than 18% annual returns.
Those figures don't identify the next low, and they don't protect a poorly selected stock or an oversized trade. They do show why a trader who exhausts their capital during the decline may miss the phase when conditions improve. Recovery rewards availability. You need money, attention, and confidence left when the chart begins to build higher lows.
Useful routines are deliberately unglamorous:
- Review losses by rule: Label each loss as a valid stop, a bad entry, an oversized position, or a rule violation.
- Set a daily stop: End the session when your predefined loss limit is reached.
- Separate analysis from execution: Mark zones before the market moves into them, rather than inventing a reason after a candle expands.
- Protect your baseline: Keep personal cash needs separate from speculative capital so a drawdown doesn't force a trade.
- Use recovery practices: Sleep, exercise, and time away from screens support judgment. Resources on resilience building strategies for leaders can offer broader methods for maintaining performance under pressure.
The technical plan also needs a reset protocol. After a sequence of losses, reduce size, review the last trades, and return only when you can describe the setup and invalidation without emotional language. Don't increase size because the market owes you a win.
A useful visual reminder of that discipline can come from this video:
Bear markets punish urgency, but they also expose weak habits that remain hidden in easy conditions. The practical response is not permanent fear. It's a smaller risk budget, cleaner price-action criteria, staged participation, and enough patience to let the market prove that control is changing.
Colibri Trader provides price-action based trading education, including supply and demand work, bearish market setups, and day trading techniques such as DBD and UBD. Review the lessons and practical programs at Colibri Trader, then use the framework to build a bear-market plan with defined entries, stops, and position sizes before placing your next trade.