




Is Price Action Trading Profitable What Evidence Shows

You can read a clean chart, identify a convincing pin bar, and still lose money. So, is price action trading profitable, or does it only look profitable when costs, execution, and hindsight are removed?
The honest answer is conditional. Price action belongs to the broader technical-analysis family, where historical profitability has appeared in some markets and periods, but not with enough consistency to promise a universal edge. A major review of 95 modern studies found positive results in 56, negative results in 20, and mixed results in 19, a pattern that supports possibility rather than certainty (review of technical-analysis research).
That distinction matters because many beginners judge a pattern by appearance. They see a rejection candle at support, enter the trade, and assume the candle itself creates the advantage. Experienced traders ask a harder question: Does the setup still make money after spread, fees, slippage, imperfect fills, changing market conditions, and human mistakes?
This article builds the answer step by step. You'll learn what price action traders read, what large-scale evidence says about price-based methods, which personal factors determine outcomes, and how to test a setup without confusing a beautiful backtest with a tradable system.
Introduction Can Price Action Really Pay
Is price action trading profitable, or does it only appear profitable when charts ignore costs, execution, and changing market conditions?
The appeal is easy to understand. A trader studies swings, reactions, breakouts, failed breakouts, and candlestick locations instead of filling the chart with indicators. Fewer tools can make a decision feel clearer. Yet a clean-looking chart does not make execution simple.
A bullish pin bar in the middle of a choppy range carries a different message from one rejecting a well-defined demand zone after a controlled decline. The candles may look similar, but location and structure change the trade. A chart pattern is like a sentence taken from a longer conversation. Its meaning depends on what surrounds it.
The pattern is only a message. Location, structure, and execution determine whether that message has trading value.
A price action method needs an edge, a repeatable situation with a favorable expected outcome across a meaningful sample. That edge must also survive trading frictions, including transaction costs, slippage, limited liquidity, and imperfect fills. Finally, the trader has to apply the rules consistently enough for the potential advantage to appear in real results.
Historical evidence supports a conditional answer. A review of technical-analysis research found that price-based methods produced economic profits in various speculative markets, while results still depended heavily on the market, period, and testing method (historical technical-analysis evidence). This supports the possibility of an edge, not the assumption that every pattern works or that removing indicators creates profitability.
A chart can show a promising setup. Only testing reveals whether that setup remains useful after costs and across different regimes.
Ask four practical questions:
- What exact setup am I trading?
- Where should it work, and where should it fail?
- What remains after realistic costs?
- Can I execute it consistently through changing conditions?
Those questions turn a visual pattern into a process that can be tested rather than a belief that depends on hindsight.
Understanding How Price Action Trading Works
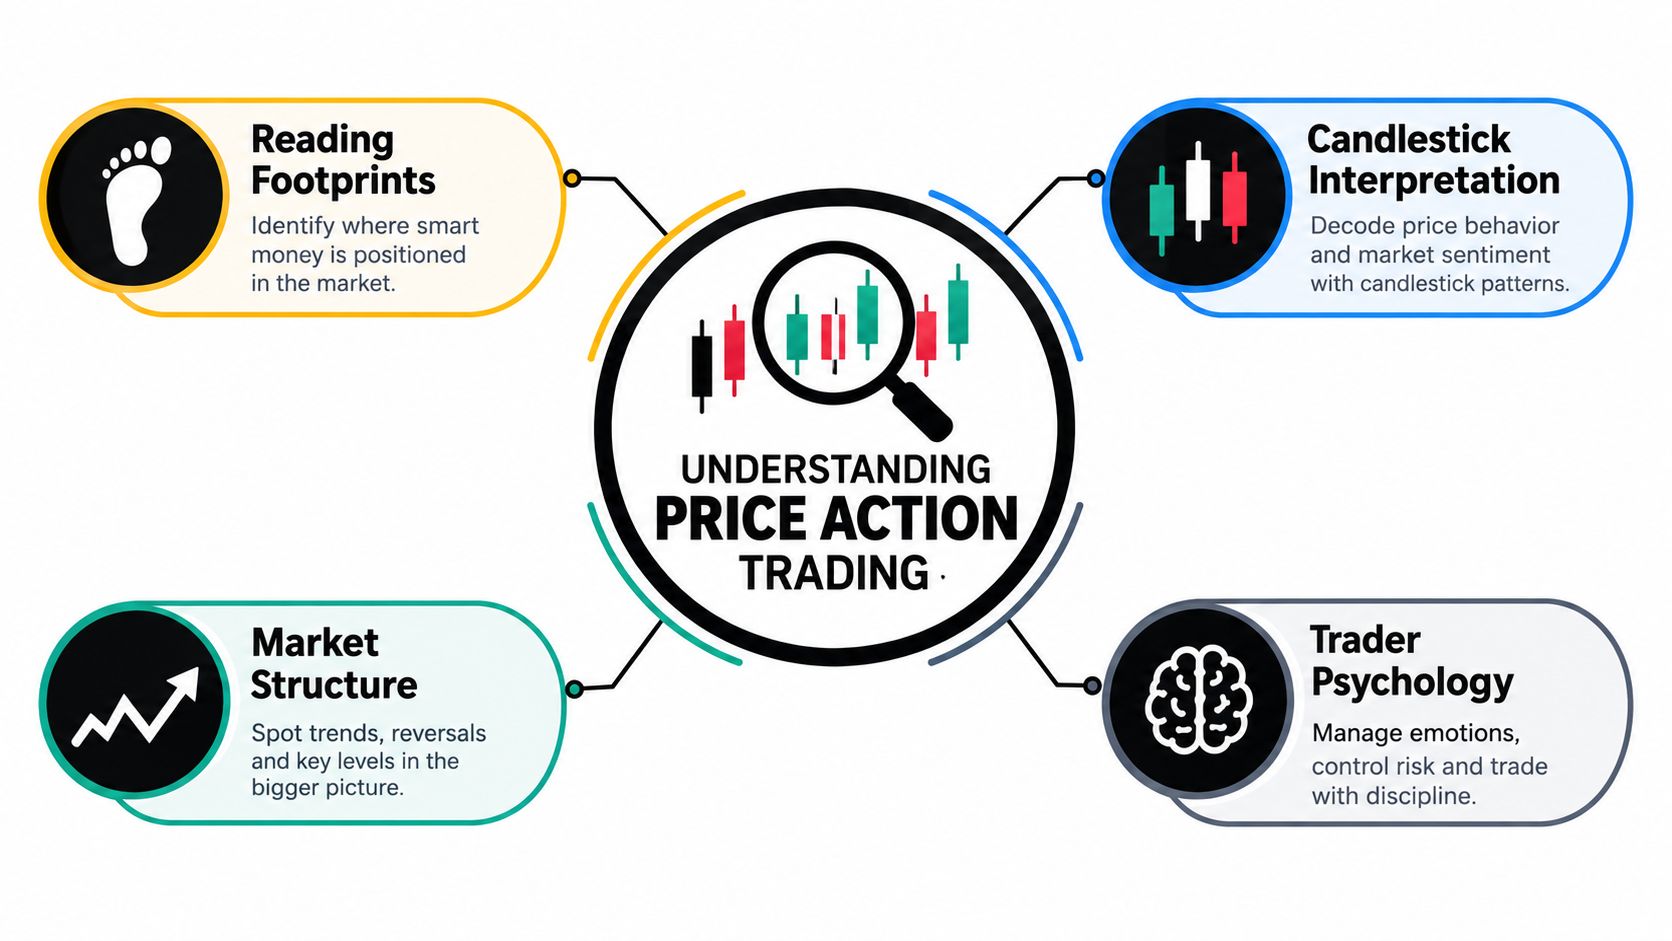
A useful analogy is reading footprints after someone has walked across wet ground. You can't see the person's intentions directly, but the depth, direction, spacing, and location of the footprints give you clues. Price action traders work in a similar way. They can't observe every buyer and seller, yet they study the marks left by their decisions on the chart.
Start with the raw movement
A candlestick compresses a period of trading into an opening price, closing price, high, and low. Its body shows where the period opened and closed, while its shadows show where price traveled and then retreated. A long lower shadow can indicate that sellers pushed price downward but buyers rejected those lower levels. A long upper shadow can show the opposite struggle.
That information becomes useful only after you establish market structure. In a rising market, traders look for higher highs and higher lows. In a declining market, they watch for lower highs and lower lows. A sideways market creates a different problem because price may repeatedly reverse between boundaries without developing a sustained direction.
Location gives the candle meaning
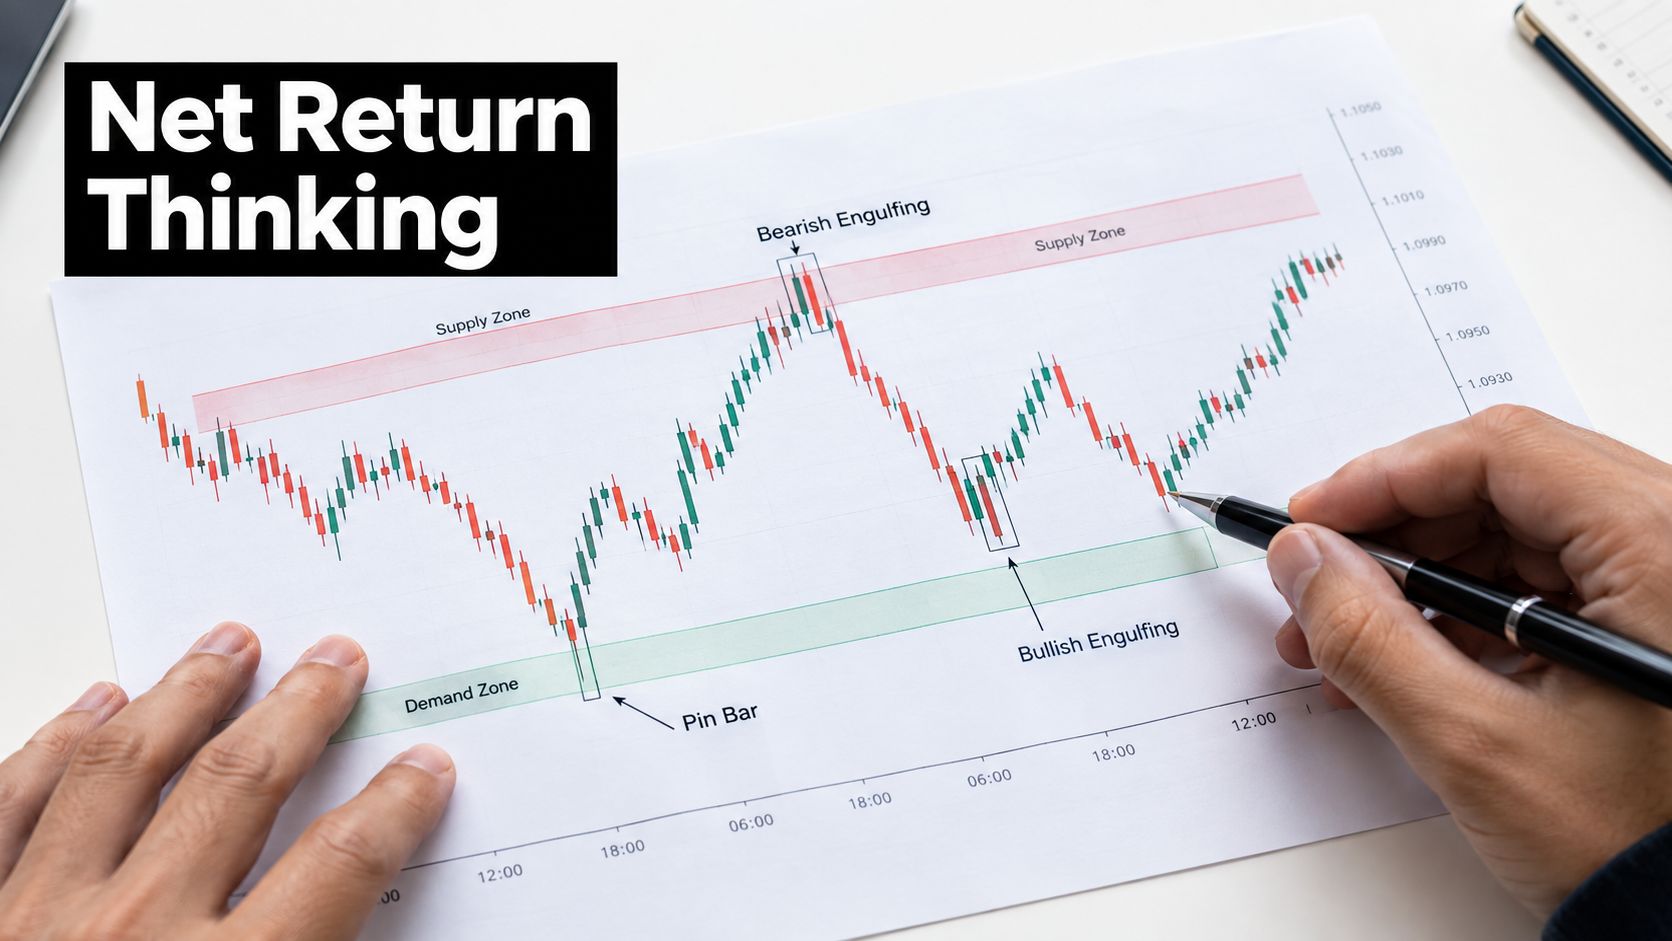
Support and resistance are better treated as zones than as perfectly precise lines. A demand zone is an area where buying previously overcame selling, while a supply zone marks an area where selling previously overpowered buying. When price returns to one of these areas, traders watch for evidence that the earlier imbalance may appear again.
Consider a bullish pin bar. In isolation, it's merely a candle with a long lower wick and a relatively small body. At a demand zone, after price has declined into the area and then rejected it, the same candle can provide a structured entry idea. A trader might wait for price to break the pin bar's high, place a protective stop beyond the rejection low, and define a target near the next opposing zone.
An engulfing candle can provide a different form of information. A bullish engulfing pattern shows buyers taking control across the range of the preceding bearish candle. At a meaningful support area, it may confirm that selling pressure has weakened. In the middle of a random consolidation, its message is far less useful.
Read pressure, not magic shapes
Price action patterns don't predict the future with certainty. They organize information about rejection, momentum, hesitation, and failed movement. The trader's job is to combine that information with structure, location, trade risk, and a clear invalidation point.
That's why two traders can see the same pin bar and make different decisions. One sees a high-quality rejection aligned with the broader trend. The other sees a late entry directly beneath resistance. Both may be reading the candle correctly, but only one is considering the full footprint.
What Research Says About Profitability
Can price action trading be profitable? Research supports a conditional answer. Price-based methods have sometimes produced an edge, but that edge changes with the market, period, rules, and trading conditions. A pattern that works on a clean trend may fail in a quiet range, while a backtest that ignores costs can make a weak method look attractive.
A review of 95 studies reported 56 positive results, 20 negative results, and 19 mixed results (technical-analysis review). Earlier research often found technical trading more effective in foreign exchange and futures than in stocks. Later work also identified economic profits across a wider group of speculative markets, at least through the early 1990s. For a price action trader, this shows that historical success is possible. It does not prove that a particular pin bar or engulfing pattern will keep working.
A 2021 investigation examined more than 21,000 technical trading rules across 12 markets from 2004 to 2015 and tested over 240,000 hypotheses (study of technical-analysis profitability and persistence). The authors found short-term value in technical analysis, with results mainly associated with short-term momentum. Related cross-market research found that trend-following rules, including moving averages and channel breakouts, outperformed contrarian rules after transaction costs (cross-market technical-analysis research).
That finding matters because price action is not limited to reversal candles. Momentum can appear through strong continuation candles, breakouts, pullbacks, and higher-timeframe structure. A pin bar may serve as the entry trigger, while the broader trade idea comes from joining an established directional move rather than calling its end.
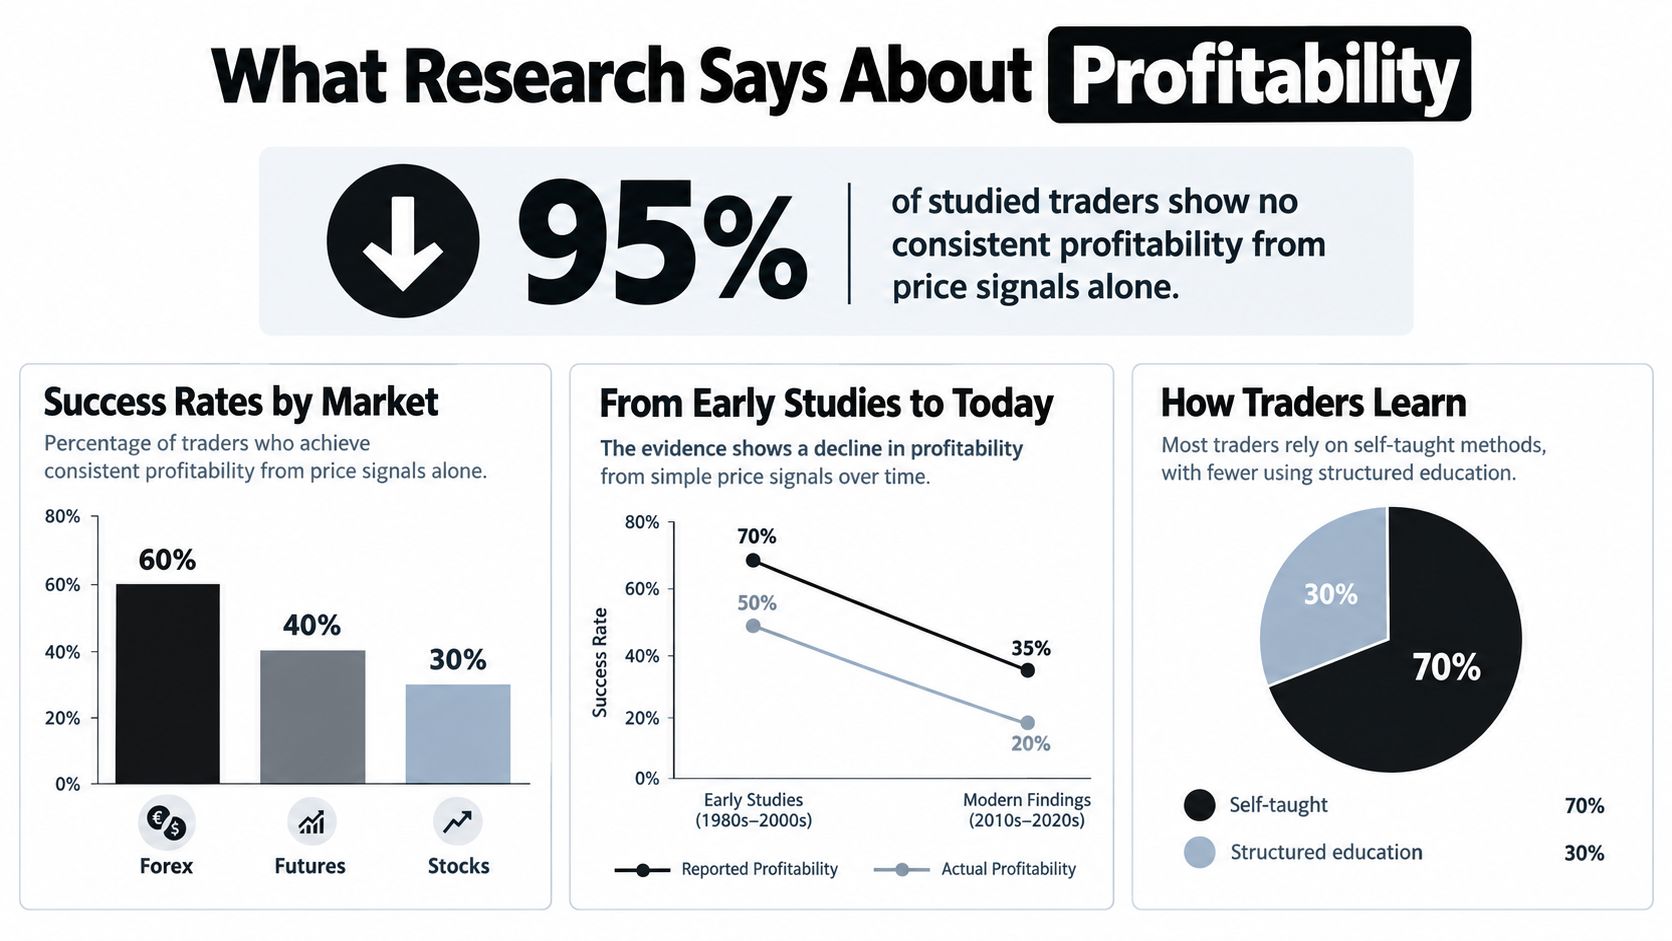
The biggest warning is strategy selection. An independent study tested 25,988 trading strategies in 10 emerging foreign exchange markets and found that some rules could produce annual average excess returns above 30%. Nearly all of those gains disappeared after correcting for data-snooping bias (study of technical-analysis profitability and persistence). Searching enough rules can make one historical result look exceptional by chance.
Intraday results also depend on execution. Review literature points out that prediction or statistical significance does not always establish profitability after transaction costs, slippage, liquidity limits, and execution risk (review of execution frictions in intraday trading). A setup can call direction correctly and still lose money if entry comes late, the spread is wide, or the stop fills at a worse price.
For that reason, walk-forward testing helps test whether rules remain reasonable on unseen data and across changing conditions. Profitability is therefore a conditional edge, not a permanent property of a candle pattern.
Key Factors That Determine Whether You Profit
A price action setup does not work in isolation. Results come from the interaction between the setup, the market, your risk, and your execution. Before adding another pattern, audit each part of that process.
A diagnostic view of the trading process
| Driver | What to Check | Why It Hurts Profitability |
|---|---|---|
| Edge selection | Is the setup defined by location, structure, trigger, stop, and target? | Vague rules create inconsistent entries and make testing unreliable. |
| Risk and money management | Is position size based on a predetermined loss limit? | A few oversized losses can damage the account before the edge has time to work. |
| Psychology and discipline | Do you follow the same rules after wins and losses? | Impulsive changes turn a tested method into a different, untested method. |
| Timeframe choice | Does the timeframe match your schedule and execution ability? | A fast setup can demand decisions you cannot monitor or execute well. |
| Market regime | Does the method suit trend, range, volatility, and stress conditions? | A momentum setup can struggle when price rotates without direction. |
Definition comes first. “I trade strong candles” is not a complete system. A usable rule might require a bullish rejection at a marked demand zone, a break of the signal high for confirmation, a stop beyond the rejection point, and an exit at a predefined opposing area. Precise conditions reduce hindsight and make review more reliable.
Risk management determines whether you remain able to apply the method. An edge still includes losing trades. Increasing size after a loss to recover quickly changes the test from setup performance to emotional exposure. A practical money-management framework helps separate trade selection from account protection.
Context changes the expected outcome
Cross-market findings showed that financial stress reduced profitability in U.S. markets but improved it in emerging and some other advanced markets. The same entry pattern can therefore behave differently as volatility, liquidity, and participation change. A chart signal is more like a tool than a guarantee. A screwdriver may work well for one task, but it is a poor choice for another.
Timeframe also depends on the trader. Someone with a full-time job may struggle to manage a fast intraday setup, while a daily chart can provide more time to assess location and risk. The suitable timeframe is not the one producing the most signals. It is the one where the trader can apply the process consistently, account for spreads and slippage, and respond before the original trade idea becomes invalid.
Skill affects interpretation as well. A 2024 study placed an experienced technical trader in a bias-free simulated environment and found that the trader materially improved the outcomes of a simple automatic strategy (study on experienced discretionary trading). The implication is measured and useful: discretionary value may come from recognizing context and filtering weak signals, rather than memorizing candle names.
Profitability survives only when these conditions align. A valid pattern must fit the regime, the risk must fit the account, and the trader must execute it well enough for its tested edge to reach the market.
Practical Steps to Improve Your Price Action Results
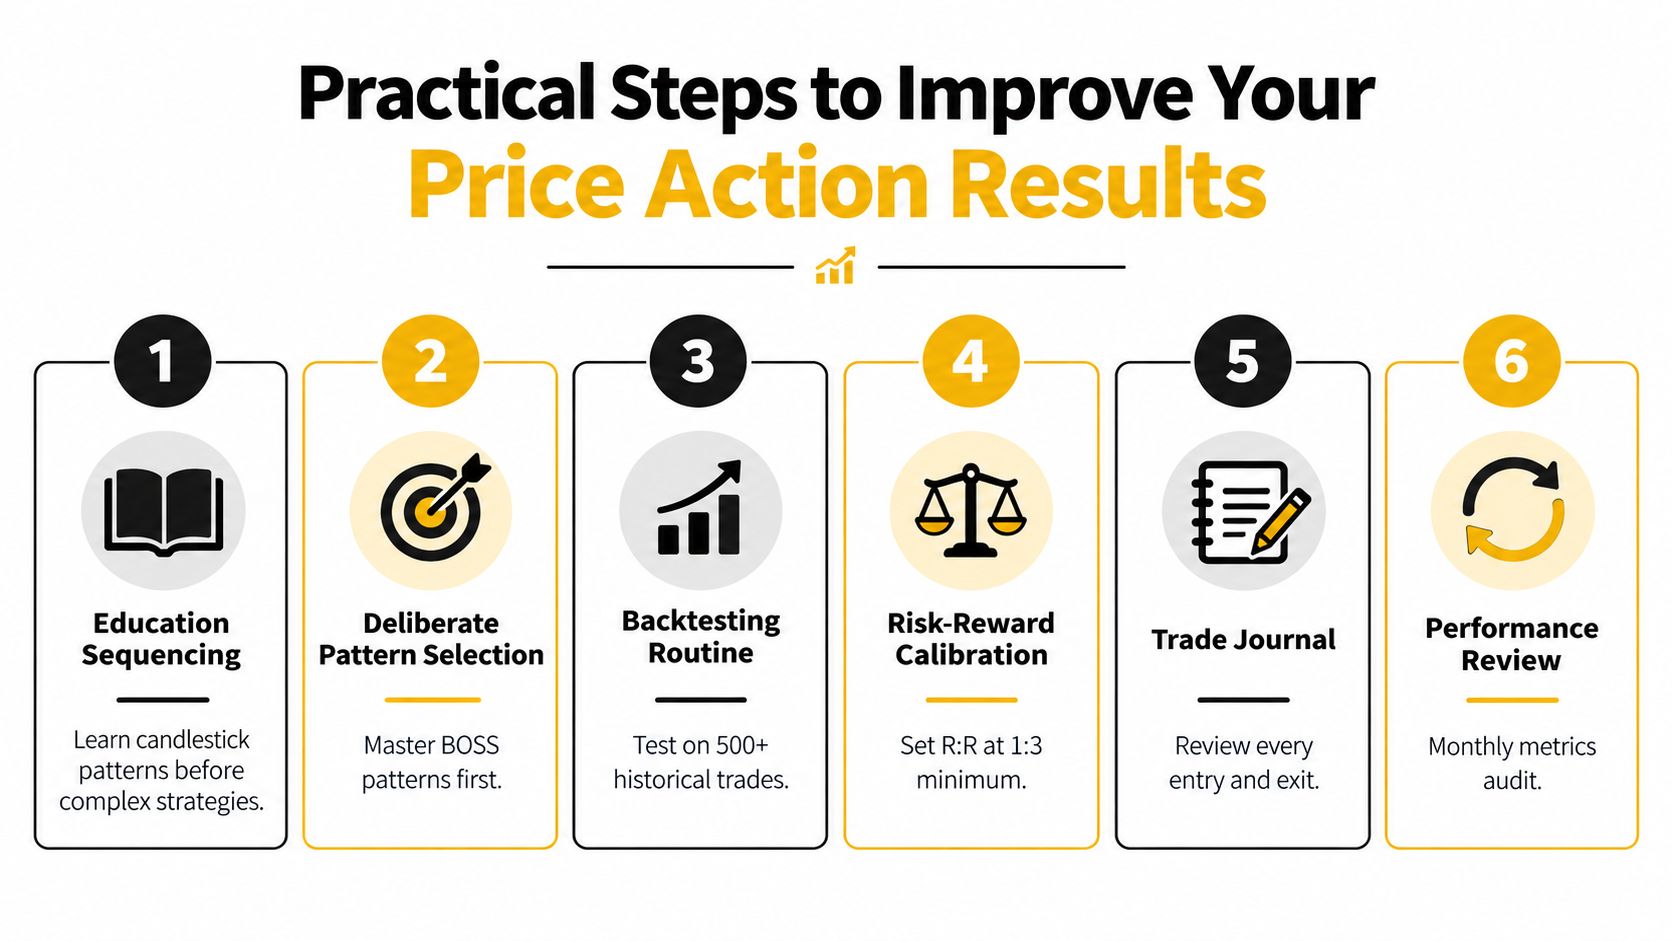
Improvement begins with a narrow, testable process. Choose one market, one timeframe, and one clearly defined setup. The aim is to learn whether you can execute the same idea repeatedly after spreads, slippage, and other trading costs, rather than treating every price movement as readable.
Build skill in the right order
Learn the chart's basic language first: candlestick behavior, swing structure, support and resistance, supply and demand, and continuation versus reversal. Add a focused setup, such as a BOSS or BEAR pattern at a marked zone, only if it belongs in your trading plan. A pattern name has little value without location and clear rules.
Use this sequence for each candidate trade:
- Mark the environment. Classify the chart as trending, ranging, or transitioning. Mark important swing points and nearby opposing zones.
- Define the location. Ignore attractive candles in open space. Wait for price to reach an area where a reaction has a reasonable explanation.
- Wait for confirmation. Look for rejection, an engulfing move, a false breakout, or another rule-based trigger. A single candle is evidence, not an instruction.
- Set the invalidation point. Place the stop where the trade idea is clearly wrong. A stop chosen only because its loss feels comfortable can distort the method's results.
- Record the decision. Save the chart before entry and after exit. Note the context, trigger, planned risk, actual execution, and emotional state.
Track execution, not just wins and losses. Research on candlestick strategies shows that apparent returns can change substantially with transaction costs and money management, so a journal should reveal whether the edge survives real trading conditions.
Use feedback instead of excitement
Review trades on a fixed schedule. Separate a valid losing trade from a rule-breaking loss. A valid loss provides information about the method's distribution. A rule-breaking loss identifies a behavior that can reduce profitability even when the setup has an edge.
Paper trading lets you rehearse entries, stops, targets, screenshots, and reviews before risking capital. Follow a structured paper-trading process and record whether each decision matched the plan. The exercise is useful only when you apply the same rules, timing, and risk limits intended for live trading.
Colibri Trader provides education covering candlestick patterns, support and resistance, trade simulation, journaling, discipline, and money management. It may suit traders who prefer guided practice while comparing different structured learning resources.
Realistic Examples and Performance Metrics That Matter
A chart pattern becomes meaningful only when its surrounding conditions support it. Suppose price falls into a demand zone, forms a bullish pin bar, and closes above the signal candle's high. The wick may look persuasive, yet the better questions are whether the zone has been tested repeatedly, whether nearby supply restricts the upside, and whether the expected move justifies the stop distance. The pattern is a clue, not a complete trade plan.
A second chart story involves a bullish engulfing candle. Price briefly breaks below support, attracts sellers, then closes back above the level. The failed break suggests that sellers could not maintain the lower prices. Execution still requires a defined trigger, a stop beyond the failed move, and a target that considers the next area where sellers may return. A setup can show a useful reaction and still produce a loss if the entry is late or the available reward is too small.
Gross returns can mislead
A candlestick strategy study reported more than 600% cumulative returns from piercing-line and dark-cloud-cover strategies when only 10% of margin was used. The result was about 11% annualized, and it changed substantially with transaction costs and money-management choices.
The lesson is simple. A large cumulative figure may reflect the sample's length, reinvestment assumptions, and margin committed. It does not show what a trader could retain after spreads, commissions, slippage, missed entries, and emotional deviations. Profitability is therefore conditional. An apparent edge must survive the costs and execution problems found in live markets, not just a clean historical test.
Track net performance rather than a headline return:
- Expectancy: The average result per trade after losses and costs.
- Drawdown: The decline from an account peak to a later trough.
- Execution difference: The gap between the planned entry or exit and the actual fill.
- Regime behavior: Whether results change across trends, ranges, calm conditions, and stressed markets.
- Rule adherence: Whether the outcome came from the tested plan or from improvisation.
A positive backtest is only an opening signal. If the edge disappears under realistic fills, the strategy is not ready for live capital. If it survives costs but fails during emotional trading, the method may have potential while its implementation remains unproven. Cross-market results can also differ, so a pattern that works in one environment should not be treated as universal.
Conclusion Deciding If Price Action Fits Your Goals
Can price action trading fit your goals? It can, but only as a conditional edge. Historical research has found profitable price-based patterns, while broader testing shows that results may depend on short-term momentum, market regime, and how the test was designed. As noted earlier, data-snooping can make a pattern look stronger than it is.
Your next step depends on your experience. If you are new, learn market structure, zones, candlestick behavior, and risk control before committing meaningful capital. If your results are inconsistent, keep one setup unchanged long enough to separate a weak method from poor execution. If you are experienced, test discretionary filters across rising, falling, trending, and ranging markets, with spreads, commissions, slippage, and missed fills included.
A clean chart is like a map, not a guarantee of safe travel. It can show location, define where the idea is invalid, and help control exposure. Profitability still depends on disciplined execution and review. Certificates, extra indicators, and a pattern that works in one market cannot remove uncertainty elsewhere.
Treat price action as a decision framework to test, not a shortcut around uncertainty.
Choose one setup and record every valid opportunity, including trades you skip. Review net results, drawdown, execution quality, and rule adherence after a consistent sample of observations. The method must survive costs and your actual behavior, not just a favorable chart history.
For structured practice, Colibri Trader offers price-action programs, a trading potential quiz, and lessons on setups, journaling, discipline, and money management. Use those materials to test your process, then decide whether price action matches your goals and execution style.