


What Is Momentum Trading A Practical Guide
Momentum trading is really just about jumping on a moving train. You’re buying assets that are already rocketing up and selling (or shorting) those that are plummeting. The whole idea is built on a simple law of physics: an object in motion tends to stay in motion. This strategy bets that a strong price move has enough steam to keep going in the same direction, at least for a while.
Understanding Momentum Trading From Concept To Action
Picture a surfer out on the water. They see a massive, powerful wave building in the distance. What do they do? They don't paddle against it. They turn their board, paddle like mad with the wave, and let its raw power carry them all the way to shore.
That's the heart of momentum trading. You're not trying to be a hero by predicting the absolute bottom or calling the exact top. Instead, you’re spotting a trend that's already in full swing and riding it for all it's worth.
This isn't just random guesswork. Big price moves are usually kicked off by something significant—major news breaking, a stellar earnings report, or a big shift in what investors are feeling about an asset. When these forces line up, they can create a kind of "herd behavior." Everyone wants in, and that collective buying or selling just pushes the price even further.
The Psychology Behind The Price
At its core, momentum is all about human emotion. The fear of missing out (FOMO) can send prices soaring as more people pile in. On the flip side, pure panic can cause a downward spiral to accelerate. A momentum trader's job is to read the room and figure out when these emotions are strong enough to keep a trend alive.
It’s less about an asset's "true" fundamental value and more about what the market thinks it's worth right now.
This is exactly why the old saying "the trend is your friend" is practically the mantra for this strategy. Trying to fight a powerful trend is like swimming against a rip current—you'll exhaust yourself and get nowhere. It’s far smarter to see which way the current is flowing and go with it. To get better at this, it's crucial to grasp the details of trading the trend.
The momentum factor has proven to be one of the most powerful and persistent drivers of returns in global stock markets. But it's a double-edged sword. This strategy can deliver incredible highs, like the 56.7% return seen in 2003. However, it also comes with massive risks, including deep drawdowns like the crushing -33.5% loss during the 2008 financial crisis. You can discover more about these performance metrics from MSCI.
Momentum Trading at a Glance
To make this crystal clear, let's quickly recap the essential components of momentum trading. This table breaks down the core concepts you need to know.
| Concept | Description |
|---|---|
| Trend Identification | The first job is always finding an asset with a clear, strong move already underway, either up or down. |
| Entry Point | Traders typically jump in after the trend is confirmed, often on a breakout past a key price level. |
| Exit Strategy | You get out when the trend starts to show signs of weakness, using technical indicators or hitting a profit target. |
| Risk Management | Non-negotiable. Strict stop-loss orders are critical to protect your capital if the trend suddenly reverses. |
These four pillars form the foundation of any solid momentum strategy. Mastering them is key to navigating the fast-paced world of momentum trading without getting burned.
Reading The Market: The Principles Of Trend Strength

Strong, sustainable trends rarely materialize out of thin air. They emerge when market psychology, major news catalysts, and fundamental shifts converge. A blockbuster earnings report that sails past expectations can light the first fuse.
That initial spark drives price higher. Soon after, FOMO (fear of missing out) takes hold and waves of new buyers pile in. Before you know it, a modest uptick becomes a robust trend that can run for weeks or even months.
The Role Of Volume In Confirming Strength
Price action on its own only tells part of the story. To gauge real conviction, you need to watch trading volume—the total shares or contracts changing hands over a given period.
Think of price as a car’s speed; volume is the fuel in the tank. Without sufficient fuel, that acceleration will stall.
- High Volume on an Uptrend: Signals strong buying conviction and a trend likely to continue.
- Low Volume on an Uptrend: Warns the move might lack broad support and could fade quickly.
When a price surge coincides with a volume spike, it often means the big money—institutional funds and large traders—is stepping in. That alignment adds both legitimacy and strength to the move.
True momentum isn't just about a rising price; it's about a rising price supported by rising participation. When price and volume move in harmony, you're seeing a trend with real power behind it.
Identifying Market Leaders With Relative Strength
Amid a rising market where many stocks climb, true leaders separate themselves through relative strength. Simply put, you compare an asset’s performance against a benchmark like the S&P 500.
A stock that outperforms the index shows independent conviction—it isn’t just riding the wave but creating its own. That outperformance highlights assets most likely to keep running.
Tools like the ADX indicator can help you measure that underlying force. You can learn how to trade with ADX like a pro to add another layer of confidence. By combining volume analysis and relative strength, you shift from chasing price moves to strategically riding the market’s strongest currents.
Your Trader’s Toolkit: Key Momentum Indicators
Riding a strong trend demands accurate gauges. Think of momentum indicators as a race car’s dashboard—they deliver the critical readouts you need at lightning speed. While the market offers hundreds of oscillators and signals, a handful have earned their stripes among momentum traders.
They don’t predict the future, but they distill raw price action into clear entry and exit cues. Mastering these essentials brings much more clarity than juggling a dozen tools.
Moving Average Convergence Divergence (MACD)
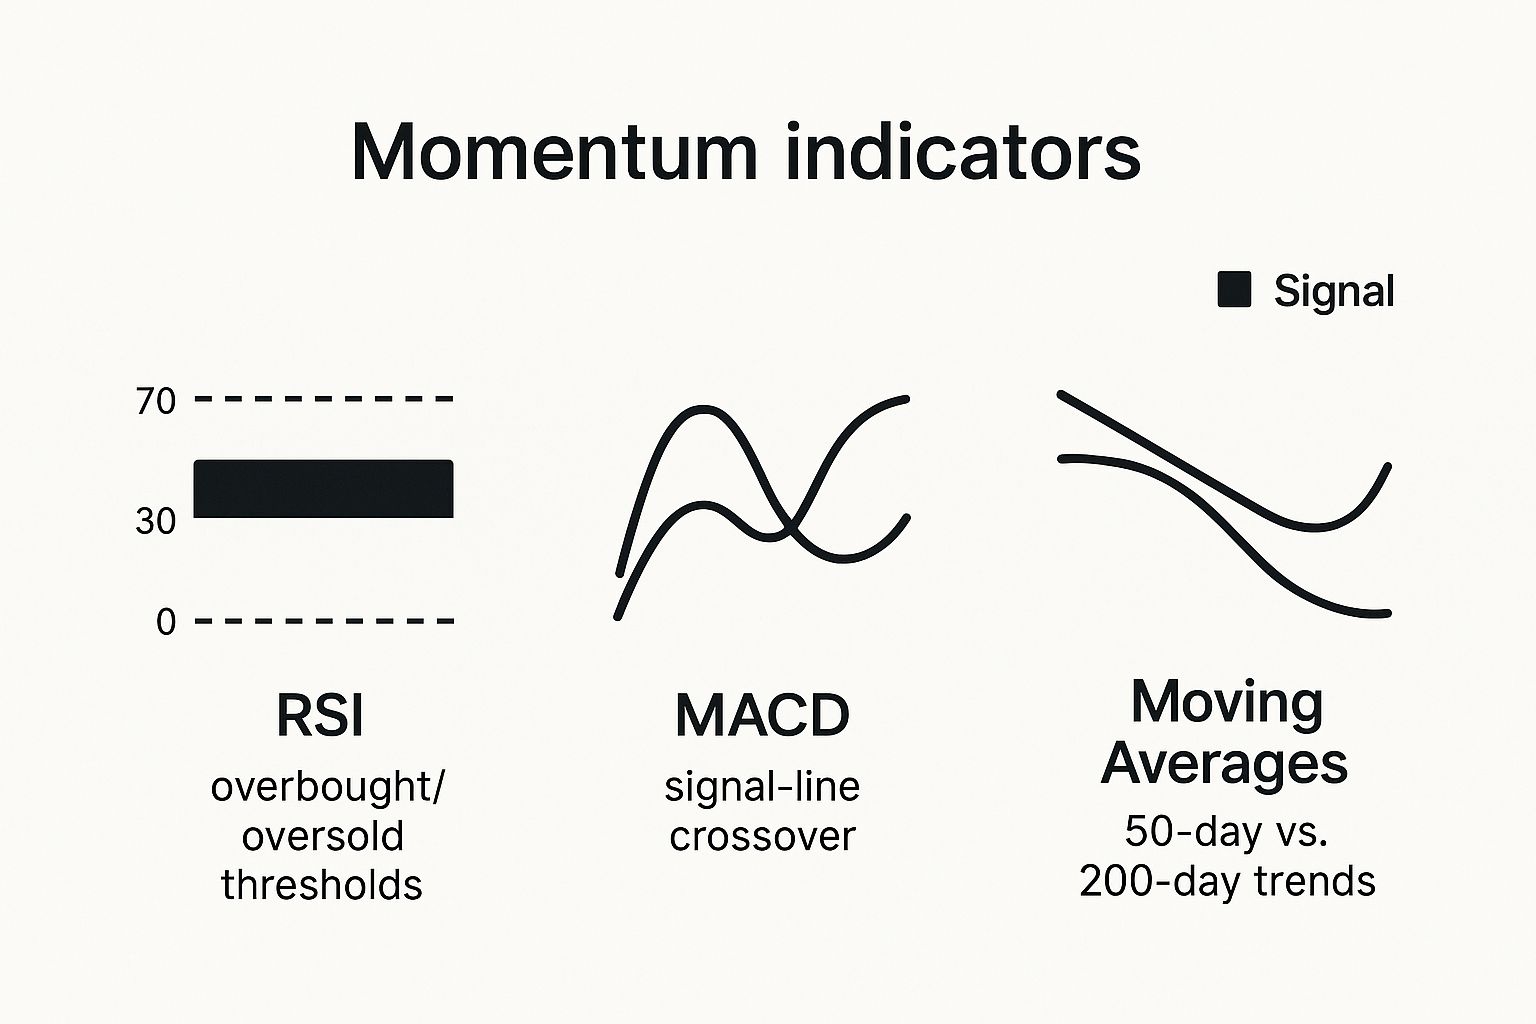
The Moving Average Convergence Divergence (MACD) combines two exponential moving averages to spotlight shifts in trend and momentum. Two lines—the MACD line and the signal line—oscillate around a zero baseline.
- Crossovers: When the MACD line crosses above the signal line, it hints at building bullish momentum. A cross below flags bearish pressure.
- Divergence: If price makes a higher high while MACD fails to follow, it often signals waning momentum and a looming reversal.
Traders use the MACD to confirm whether a new trend has enough punch to warrant a position.
Relative Strength Index (RSI)
The Relative Strength Index (RSI) measures the speed and magnitude of price moves on a 0–100 scale, revealing when a market might be stretched.
An RSI above 70 typically indicates an overbought condition, suggesting a bullish run may be running out of steam. Below 30, it flags oversold territory and a potential bounce.
It’s invaluable for timing entries and exits. For example, waiting for a pullback from overbought levels can keep you from buying at a short-term peak.
Average Directional Index (ADX)
The Average Directional Index (ADX) filters out direction and focuses solely on trend strength.
- ADX below 25 usually indicates a weak or sideways market.
- ADX above 25 points to a powerful trend—prime conditions for momentum strategies.
Use ADX as a gatekeeper, stepping in only when the market’s health aligns with your rules.
Comparing Top Momentum Indicators
Before you integrate these indicators into your routine, here’s a quick side-by-side look at their core functions and signals.
| Indicator | Primary Use | Key Signal |
|---|---|---|
| MACD | Trend direction and momentum | MACD line crossing signal line |
| RSI | Overbought and oversold readings | RSI crossing 70 or 30 |
| ADX | Trend strength filter | ADX rising above 25 or falling |
This snapshot underscores how each tool offers a unique lens on market momentum.
Armed with these gauges, you can better time your entries, sidestep choppy phases, and confirm that a trend truly has the muscle to follow. For a deeper dive into advanced setups and signal interpretations, explore our guide on the best momentum indicators.
Actionable Momentum Trading Strategies

Once you've got the right indicators on your chart, the real work begins. You need to translate all that data into a repeatable plan. This is where a strategy comes in—it gives you a clear structure, defining exactly when to get in, where to cash out, and how to protect your capital. It turns theory into a complete, rules-based way of tackling the markets.
There are countless ways to slice it, but most momentum trading strategies fall into a few core categories. Each is built to capitalize on trend strength in a specific way, offering a different balance between risk and reward.
The Breakout Trading Strategy
This is one of the classic momentum techniques, and for good reason. Breakout traders are like hunters waiting patiently. They identify key price levels—often a recent high or a stubborn resistance area—and watch for the price to punch through with real conviction. A "breakout" is the market's way of shouting that buyers have finally overwhelmed sellers, and the path of least resistance is now higher.
To put this into action, a trader would:
- Identify a Key Level: Find that clear ceiling where the price has stalled out multiple times.
- Wait for the Break: The price has to close decisively above this level. No maybes.
- Confirm with Volume: A big spike in trading volume on the breakout candle is your confirmation. It shows that a flood of market participants are backing the move.
The entry happens right as the price smashes through that key level. The whole idea is to get in at the very start of the next leg up and ride the wave of buying pressure that follows a confirmed breakout.
The Trend Following Strategy
Breakout trading is all about catching a single, explosive event. Trend following, on the other hand, is about riding the entire wave from start to finish. This strategy uses tools like moving averages to keep you in a trade as long as the underlying trend is healthy. It's a game of patience and discipline, because the goal is to let your winners run as far as they can possibly go.
A common approach is to use two moving averages, like the 50-day and 200-day. When the shorter-term average (the 50-day) crosses above the longer-term one (the 200-day), it's a strong signal that a new uptrend is underway. A trader would hold that position until the averages cross back in the opposite direction, which is the market's signal that the trend might be losing steam.
The core principle here is simple: Don't just catch the start of a move; stay with it until the market itself tells you the momentum has faded. This is how you avoid taking profits too early and missing out on the biggest gains a trend has to offer.
Finding Momentum in Market Sectors
You don't have to limit momentum trading to individual stocks. You can zoom out and apply the same principles to entire market sectors. This means identifying which industries are attracting the most capital—the so-called "hot" money. By using sector-based ETFs, you can trade the momentum of technology, healthcare, or energy as a whole.
This approach helps spread your risk and puts you right where the strongest institutional money is flowing. The strategy is the same: find the leading sector, confirm its trend with your indicators, and ride that momentum until it shows signs of weakening. It’s about finding the strongest current in the market ocean and simply going with the flow.
Keep in mind, how well these strategies work often hinges on the overall market environment. Extensive research confirms that momentum profits are context-dependent; they are much stronger during stable, low-volatility uptrends. Conversely, periods of high volatility and widespread investor fear can weaken momentum or even cause it to reverse. You can read the full research about these market dynamics to get a deeper understanding.
Protecting Your Capital With Smart Risk Management
While momentum trading offers the thrill of explosive profits, it comes with an equal and opposite risk. Trends can reverse with shocking speed, turning a fantastic winning position into a significant loss in the blink of an eye. This is why the single most important skill for any momentum trader isn't picking winners—it's protecting capital.
The most successful traders are masters of defense. They know that momentum is a double-edged sword; the same herd behavior that fuels a rally can trigger a stampede for the exits. These sudden reversals, often called "momentum crashes," can erase weeks of gains if you're caught on the wrong side.
And this isn't just a theoretical risk. Heaps of historical data show that while momentum strategies can deliver impressive long-term returns, they are often punctuated by sharp, painful drawdowns. Research covering over 140 years reveals that momentum strategies suffered bear markets (declines of 5% or more) roughly every 15 to 16 months, with average losses hitting around 14%. You can learn more about these historical momentum findings to better understand just how real the risks are.
The Non-Negotiable Stop-Loss Order
The most powerful tool in your risk management arsenal is the stop-loss order. Think of it as your safety net, your fire escape, and your best defense against a catastrophic loss. It's a pre-set order you place with your broker to automatically sell a position if it drops to a specific price.
Using a stop-loss means you decide before you even enter the trade the absolute maximum you're willing to lose. This takes emotion completely out of the equation, stopping you from desperately holding onto a losing trade "hoping" it will turn around.
Smart Position Sizing
Just as critical is position sizing. This principle dictates that you should never bet the farm on a single trade. A common guideline used by professionals is the 1-2% rule, where you limit your potential loss on any one position to no more than 1-2% of your total trading capital.
By combining a hard stop-loss with disciplined position sizing, you ensure that no single trade, no matter how badly it goes, can ever wipe you out. This is the bedrock of long-term survival in the markets.
Finally, always demand a positive risk-to-reward ratio. Before you even think about entering a trade, make sure your potential profit is significantly greater than your potential loss. A common target is a 1:2 or 1:3 ratio, meaning you aim to make at least two or three times what you're risking. This discipline ensures you can still be profitable even if you only win on half of your trades.
Common Questions About Momentum Trading

Once you start digging into momentum trading, a lot of practical questions pop up. It can look simple on the surface, but the real secret to success is in the details. Let's tackle some of the most common points of confusion to clear things up and help you avoid some classic beginner mistakes.
I want to ground your understanding in how this actually works in the real world, from the market conditions you'll face to the cash you need to get started on the right foot.
How Is Momentum Trading Different From Day Trading?
This question comes up all the time, and it's easy to see why. But the difference is actually pretty straightforward—it all comes down to what defines each style.
Day trading is defined purely by its timeframe. A day trader opens and closes every single position within the same trading day. Period. They never hold a trade overnight. Their actual strategy could be anything—momentum, scalping, range-trading—as long as it happens between the market's open and close.
Momentum trading, on the other hand, is defined by its strategy. The goal is to find assets in a strong uptrend and buy them, or find assets in a clear downtrend and sell them short. The holding period doesn't matter; the trend dictates how long you stay in the trade. That could be a few minutes, a few days, or even a few weeks.
So, you can be a day trader who uses a momentum strategy. But a momentum trader isn't always a day trader. The momentum trader’s mission is simple: ride the wave for as long as it lasts, whether that takes five hours or five days.
Can You Use Momentum Trading In A Bear Market?
Absolutely. In fact, some of the most explosive momentum moves happen on the way down during a bear market. Momentum doesn't care if the market is going up or down; it only cares about the strength and direction of the move.
In a bear market, a momentum trader just flips their playbook. Instead of hunting for stocks breaking out to new highs, they’re looking for assets breaking down through critical support levels. The goal is to get into short positions and profit from the falling prices.
All the core principles are exactly the same:
- Find a powerful, established downtrend.
- Look for high volume to confirm the selling pressure.
- Use your tools to gauge the strength of the downward push.
- Place a hard stop-loss to protect yourself if the price snaps back up.
The strategy works because the same raw human emotions are at play. Fear and panic can drive a downward trend just as fiercely as greed drives an upward one.
What Are The Biggest Risks Of Momentum Trading?
The number one risk, without a doubt, is a sudden, violent trend reversal. People in the industry sometimes call it a "momentum crash." Think about it: you are intentionally buying something that has already shot up in price, which means you're buying high. This leaves you incredibly vulnerable when the music stops and the buying pressure evaporates.
This danger is magnified by the same herd mentality that created the trend. When the trend starts to wobble, that same crowd that piled in can create a stampede for the exits, causing the price to collapse in the blink of an eye. This is why disciplined risk management isn't just a good idea—it's absolutely essential for survival.
How Much Capital Do I Need To Start Momentum Trading?
There’s no single magic number here, but the honest answer is probably more than you think. You need enough capital to manage your risk properly so that a few losing trades don't wipe you out completely.
A good rule of thumb that experienced traders follow is to never risk more than 1-2% of your entire account on any single trade. If you start with a tiny account, like $500, that 2% risk is just $10. That's often not enough room to place a proper stop-loss without getting knocked out of the trade by normal, everyday market noise.
Most pros would suggest you start with at least a few thousand dollars. This gives you a 1-2% risk amount that’s substantial enough to work with, provides a buffer to survive a losing streak (which I promise you will happen), and helps absorb commission costs. Starting undercapitalized is one of the quickest ways to blow up an account.
At Colibri Trader, we teach a pure price-action approach that cuts through the noise of lagging indicators and overly complex analysis. Our methods are built to help you read what the market is telling you directly from the chart, giving you the clarity to trade with confidence in any condition. To see if our straightforward, powerful strategies are a good fit for you, discover your trading potential by visiting us at https://www.colibritrader.com.