


What is market liquidity and how it affects trading decisions
When traders talk about market liquidity, they're really talking about one thing: how easily you can buy or sell something without the price going haywire. Think of it like a river. High liquidity is a deep, wide river—trades flow smoothly and quickly. Low liquidity is more like a shallow, rocky creek; transactions are sluggish and can easily disrupt the price. For any trader, getting a grip on this concept is non-negotiable. It dictates the quality of your trade executions.
Decoding Market Liquidity
Let’s use a simple, real-world analogy. Imagine you're at a massive farmers' market, packed with people buying and selling apples. If you decide to sell your basket of apples, you’ll find a buyer almost instantly at the going rate. That’s a highly liquid market. It's buzzing with activity, full of buyers and sellers, which keeps prices fair and stable.
Now, picture yourself in a tiny town trying to sell a rare, antique chair. Finding someone who wants it could take days, maybe even weeks. You might even have to slash your price just to get it sold. This is a classic illiquid market—very few participants, slow deals, and a real risk of the price crashing just because you want to sell.
This exact dynamic plays out in the financial markets every single second. High liquidity gives traders some major advantages:
- Tighter Bid-Ask Spreads: The gap between the highest price a buyer will pay (bid) and the lowest price a seller will accept (ask) is tiny. This means your transaction costs are lower.
- Reduced Slippage: The price you click is the price you get. In liquid markets, your orders are far more likely to be filled at your expected price, saving you from nasty surprises.
- Price Stability: A liquid market can absorb huge buy or sell orders without causing the price to suddenly gap up or crash down.
In short, market liquidity is the invisible engine that keeps the markets running smoothly. Understanding it is fundamental to mastering price action without cluttering your charts with indicators.
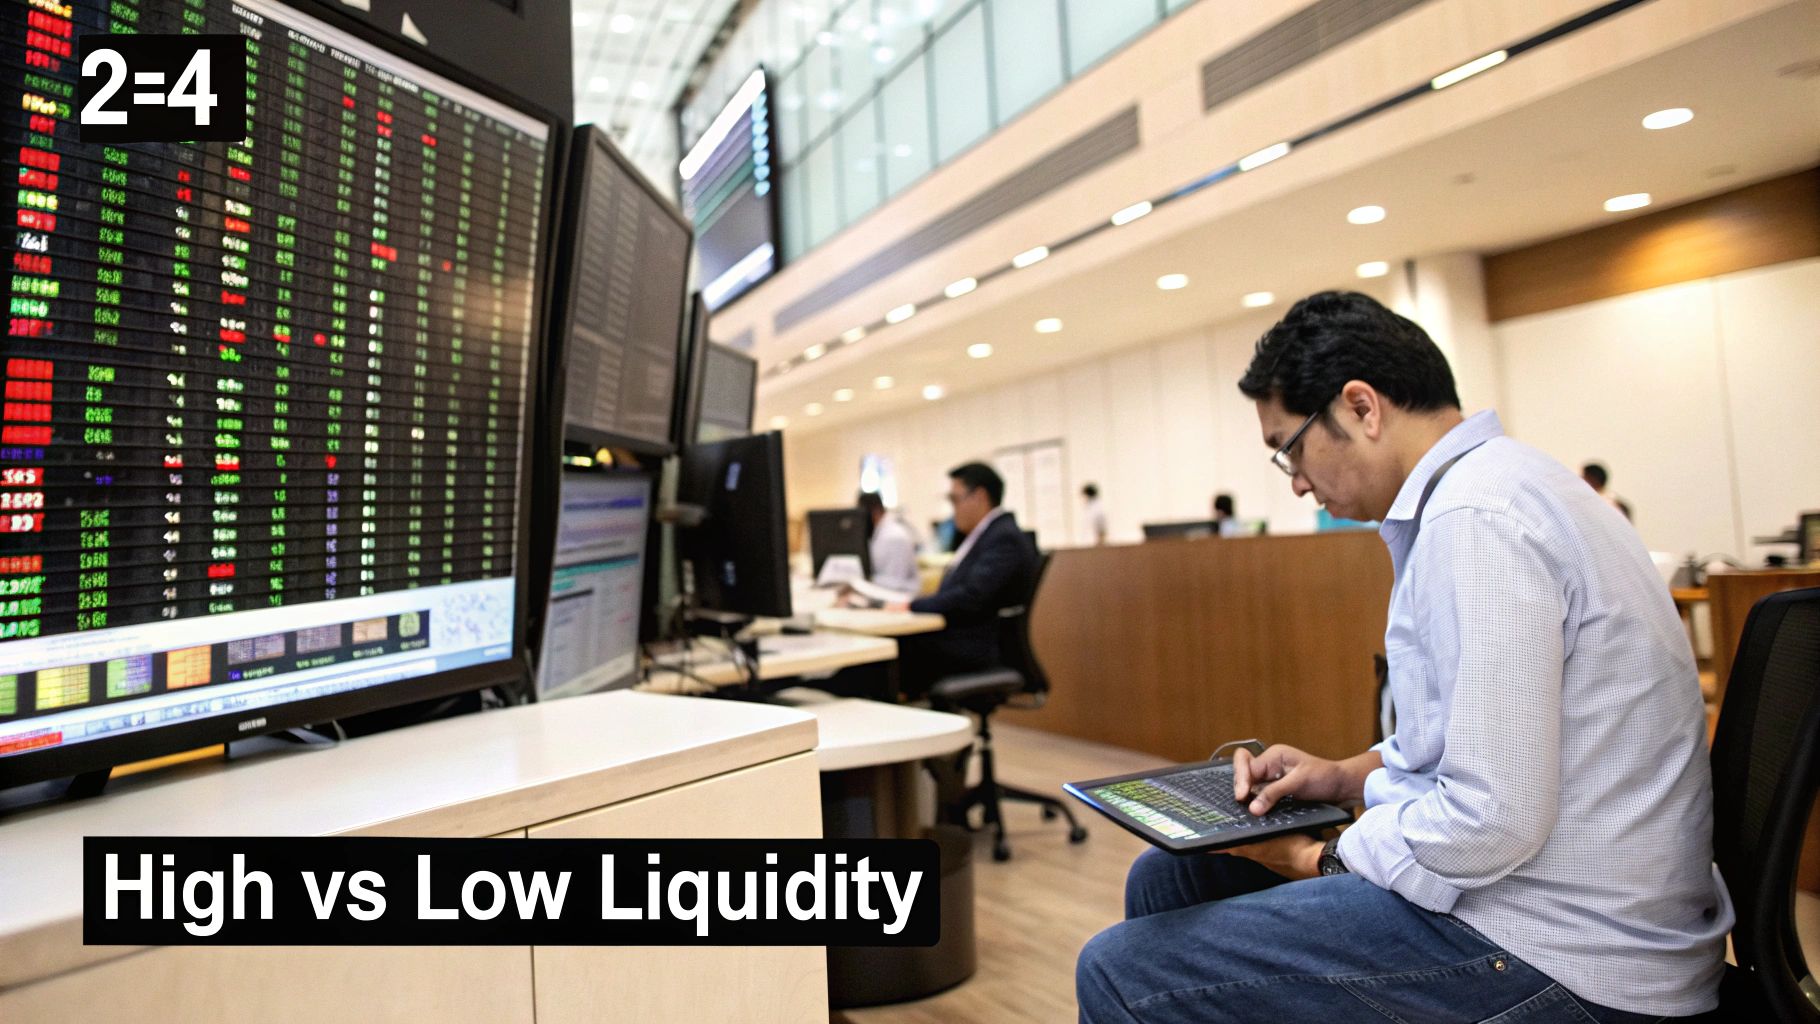
To make this crystal clear, here’s a quick side-by-side comparison.
High vs Low Liquidity at a Glance
This table breaks down the key differences between a liquid market, like a major forex pair, and an illiquid one, like a penny stock. It’s a handy reference to see how these environments contrast.
| Characteristic | High Liquidity Market (e.g., EUR/USD Forex Pair) | Low Liquidity Market (e.g., Penny Stock) |
|---|---|---|
| Trading Volume | Consistently high with many participants | Sporadic and low, with few active traders |
| Bid-Ask Spread | Very narrow, often just a fraction of a cent | Wide, making entry and exit expensive |
| Price Stability | Stable, with smooth and predictable price action | Volatile, prone to sudden gaps and sharp spikes |
| Slippage Risk | Low risk of orders filling at a bad price | High risk of significant slippage on orders |
As you can see, the trading environment is drastically different. High liquidity offers stability and lower costs, while low liquidity brings volatility and higher risks—but also potential opportunities for those who know how to navigate it.
How Traders Can Measure Market Liquidity
Knowing what market liquidity is in theory is one thing, but as a trader, you need to see it on your charts. The good news is you don't need any fancy or complex tools to get a read on the market's pulse. All the clues you need are right there in the price action.
By watching a few key signs, you can quickly tell if you're swimming in a deep river or wading through a shallow, rocky creek.
This simple map lays out the core difference between high and low liquidity.
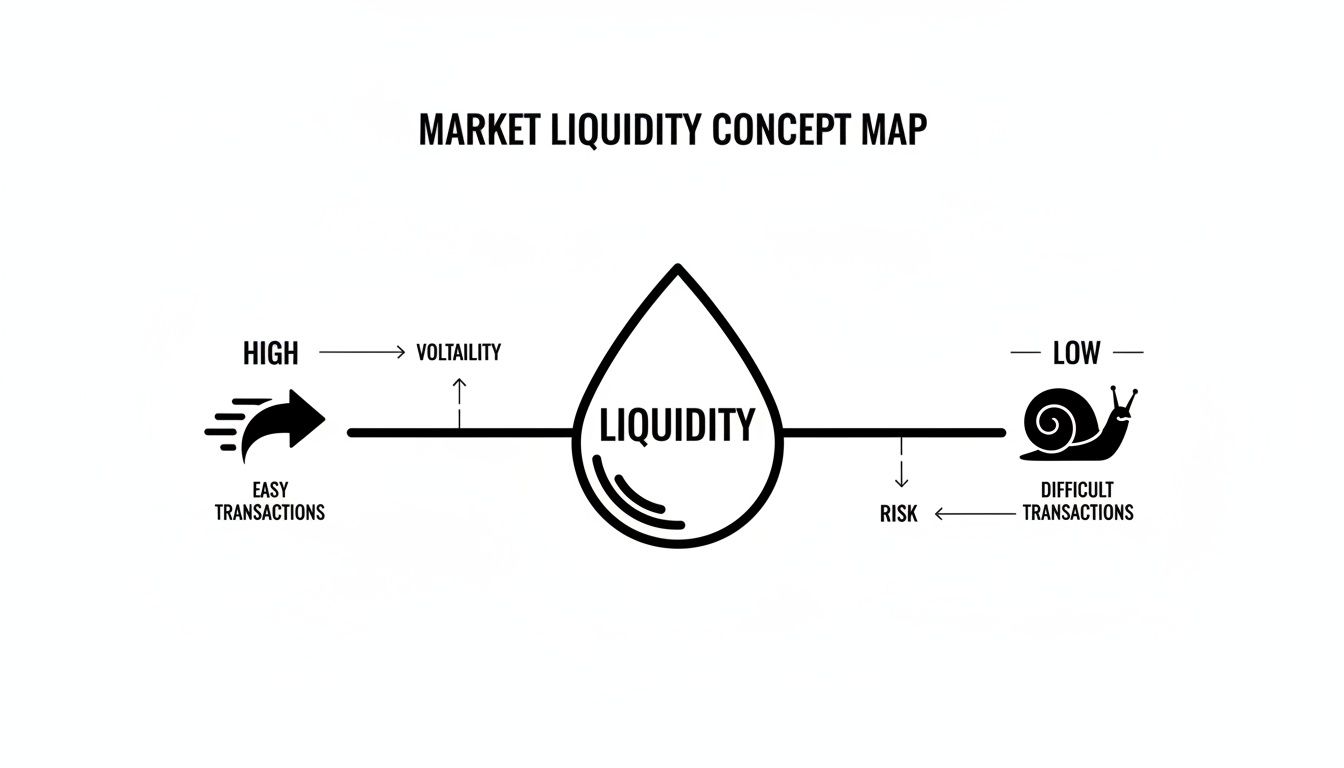
As you can see, high liquidity is what allows markets to move smoothly. When it dries up, things get choppy and unpredictable. Let's dig into a few practical ways you can spot which environment you're dealing with.
Key Liquidity Metrics for Traders
The most immediate and obvious sign of liquidity is the bid-ask spread. This is simply the tiny gap between the highest price a buyer is willing to pay (the bid) and the lowest price a seller will take (the ask).
In a market with tons of liquidity, like the EUR/USD forex pair, that spread is razor-thin, often just a fraction of a pip. This means your transaction costs are minimal. When liquidity is low, that spread widens, and it costs you more to get in and out of a trade. If you want a deeper dive on this, you can learn more about the bid-ask spread in our guide.
A few other critical metrics include:
- Order Book Depth: This tells you how many buy and sell orders are stacked up at different price levels. A "deep" order book can absorb massive trades without the price budging much, a clear sign of a healthy, liquid market.
- Trading Volume: High volume is a classic indicator of strong participation and good liquidity. It means lots of buyers and sellers are actively trading.
- Price Impact: This is the real-world test. How much does a large trade actually move the price? If a single big order sends the price flying or crashing, you're looking at a very illiquid market.
For a price action trader, these aren't just abstract concepts. They are direct warnings about execution quality. Ignoring them means risking wider spreads, more slippage, and volatile price swings that can wreck even the most well-planned strategy.
A prime example of liquidity vanishing happened between 2010 and 2015 in the European corporate bond market. Trading volumes plunged by as much as 45%. Big players couldn't execute large orders without causing massive price slippage, forcing them to break their trades into tiny pieces just to get them filled.
Understanding the Forces That Shift Liquidity
Market liquidity is never a fixed state. Think of it more like an ocean tide—it’s a dynamic condition that ebbs and flows constantly. For any trader, learning to anticipate these shifts is just as critical as reading a price chart. Several powerful forces are always at play, influencing the amount of buying and selling pressure in any market at any given time.
One of the most predictable drivers is simply the time of day, or market hours. In the forex market, for example, liquidity absolutely explodes during the overlap between the London and New York trading sessions. This is when the highest volume of transactions happens, leading to tighter spreads and much smoother price action. On the flip side, liquidity completely dries up when the major financial centers shut down for the day.
Economic and Policy Drivers
Major economic news releases can act like a temporary dam, stopping the flow of liquidity in its tracks. In the moments right before a central bank announces an interest rate decision or a major inflation report drops, you'll often see large institutions pull their orders right out of the market. This creates a vacuum where prices can swing wildly on just a handful of small trades.
Beyond these scheduled events, broader economic policies play a massive role. Actions taken by central banks, like adjusting interest rates or launching asset-buying programs, directly impact how willing banks and other big players are to provide liquidity to the market.
A great example is what happens during periods of exceptionally low interest rates, which can create an environment of almost overwhelming liquidity. Global financial markets saw this unfold after 2003, with a composite liquidity indicator for the euro area and the UK rocketing from near zero to peaks above 0.8 by 2007, driven by what was described as an "insatiable appetite" for risk.
These liquidity shifts have a direct impact on how reliable chart patterns are and how price behaves overall. A solid grasp of the underlying market structure is essential for traders to correctly interpret these changes. At the end of the day, liquidity is deeply intertwined with market volatility, shaping not just how much prices fluctuate but the very stability of the market itself.
Comparing High And Low Liquidity Markets
Trading liquidity becomes tangible when you swap textbook charts for live order books. It’s not just theory—liquidity dictates how smoothly you enter or exit positions, what you pay in spreads, and how much risk you actually carry.
The World Of High Liquidity
Think of the busiest highways in finance—where orders flow freely and volatility is kept in check. Typical hallmarks include:
- Major Forex Pairs: The EUR/USD pair alone trades north of $1 trillion every single day. An army of buyers and sellers keeps razor-thin bid-ask spreads and allows you to move massive lots without rattling the price.
- Blue-Chip Stocks: Apple (AAPL) is the poster child. Its shares exchange hands by the millions, blending retail and institutional interest into a deep, stable market.
In these arenas, you can step in and out of trades with near-perfect price fidelity.
The Dangers Of Low Liquidity
Low-liquidity markets feel more like a narrow mountain trail than an open freeway. Fewer participants create two big pitfalls:
- Wide Bid-Ask Spreads: Penny stocks or exotic currency pairs can charge you a steep, immediate tax every time you trade.
- High Slippage: In shallow markets, even moderate orders can shift execution prices far from your intended entry or exit.
Trading into a wide spread is like starting a race ten meters behind the line. In thin markets, that handicap can turn a solid setup into a costly misstep.
A single large order can trigger erratic swings, making risk management in these venues almost impossible.
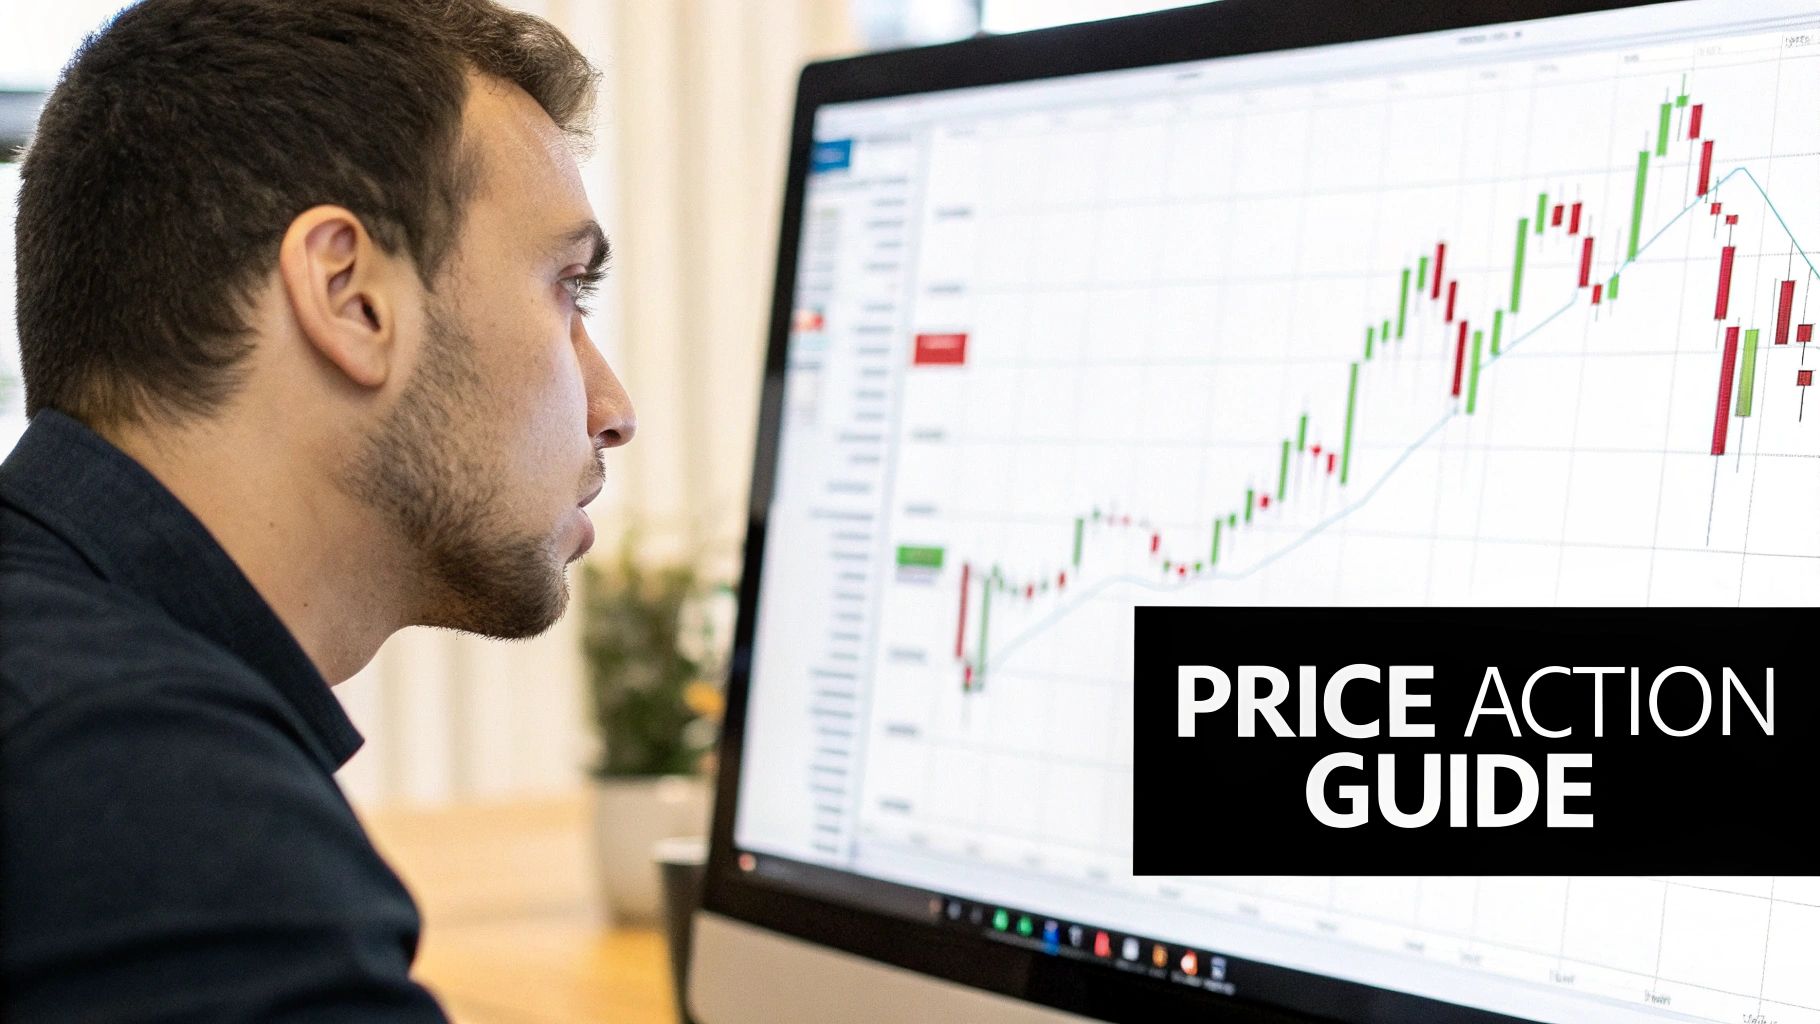
Using Price Action to Navigate Market Liquidity
Understanding the theory behind market liquidity is one thing, but using that knowledge to make smarter trading decisions is the real goal. Your charts are already telling you everything you need to know. Price action offers a direct, real-time window into a market's health, letting you adapt your strategy long before lagging indicators even have a chance to catch up.
Think about it this way: strong supply and demand zones are far more reliable in highly liquid markets. Why? Because these zones are formed by serious institutional volume—the "smart money." When a price level holds firm on high volume, it signals a deep pool of orders backing that move.
In contrast, similar-looking patterns in illiquid markets just aren't as dependable. They could be created by just a handful of random orders, meaning they have little predictive power.
Spotting Liquidity Clues on Your Chart
You can actually see when liquidity is drying up by watching for specific price action signals. These are warning signs that market conditions are getting choppy and that it's time to be careful.
Keep an eye out for these red flags:
- Widening Candle Spreads: When the range of your candles starts to expand erratically without any clear directional momentum, it often means liquidity is thinning out.
- Sudden Gaps: Unexpected price gaps, especially during normal trading hours, are a classic sign there aren't enough orders to create a smooth transition from one price to the next.
- Increased Slippage: While not visible on the chart itself, getting bad fills on your orders is a direct consequence. If your orders consistently execute far from your intended price, that's a huge tell-tale sign of low liquidity. You can discover more about what slippage is in trading and how to avoid it in our detailed guide.
This knowledge is especially critical around major news events. In the minutes before a big central bank announcement, you'll often see institutional players pull their orders, creating a liquidity vacuum. This vacuum is exactly what precedes those explosive, high-volatility moves. Recognizing this allows you to stay on the sidelines and avoid getting caught in the chaos.
The global flow of money has a massive impact on market behavior. Global liquidity, particularly in the form of international credit, has surged to represent 38% of global GDP. This credit is known to be "fickle," meaning it can vanish during times of stress, causing sharp price declines. You can read more about these global liquidity indicators on the BIS website. This shows how interconnected major markets truly are and how sudden shifts can spark powerful price action.
Wrapping Up: Your Path to Mastering Market Liquidity
I hope this guide has shown you that market liquidity is so much more than just a dry, academic term—it’s a powerful force that has a direct, tangible impact on your trading results. We’ve walked through what it is, how to spot its tell-tale signs, and most importantly, how to sync your price action strategy with the market’s flow.
By truly understanding liquidity, you give yourself a serious edge. You can sidestep unnecessary risks, pinpoint higher-probability setups, and ultimately, trade with a lot more confidence.
This knowledge is a cornerstone of real trading mastery, helping you cut through the noise of useless indicators. When you embrace these concepts, you start to read the market’s raw behaviour and make decisions based on the core dynamics of supply and demand.
Your journey to becoming a more proficient trader depends on mastering these foundational principles. The path forward is clear—focus on what really moves the markets.
Frequently Asked Questions About Market Liquidity
Even after you get the hang of liquidity, a few common questions always seem to pop up. Here are some quick, straight-to-the-point answers to help you lock in these concepts and use them in your day-to-day trading.
Which Markets Have The Highest Liquidity?
Hands down, the foreign exchange (forex) market is the king of liquidity. With daily trading volumes blowing past $7.5 trillion, it's the deepest financial pool in the world. Major pairs like EUR/USD are swimming with orders, which is why you see those razor-thin spreads.
In the stock world, the big names—the "blue-chip" stocks like Apple (AAPL) and major indexes like the S&P 500—are where you'll find the most action. These markets all share a few key traits:
- Deep Order Books: They can handle huge trade sizes without making a ripple in the price.
- High Participation: Millions of traders, banks, and funds are active every single day.
- Narrow Spreads: The cost to get in and out of a trade is minimal.
How Does Low Liquidity Increase Trading Risk?
Trading in a low-liquidity market is like walking on thin ice—it's incredibly risky. The biggest danger is slippage, where the price you actually get is way worse than the price you clicked. This happens because there just aren't enough buyers or sellers on the other side to fill your order where you expected it.
On top of that, wide bid-ask spreads chew away at your profits, acting like a hidden tax on every single trade. Illiquid markets are also notorious for wild, unpredictable price swings, as even a small order can send the price flying. It makes managing your risk a nightmare.
Low liquidity essentially stacks the deck against you before you even enter a trade. The combination of high costs, unpredictable execution, and volatile price action can turn a well-analyzed setup into a quick loss.
When Is Forex Market Liquidity Typically The Lowest?
Liquidity in the forex market isn't a constant; it ebbs and flows in a pretty predictable daily cycle. You'll typically find it at its lowest during the Asian trading session, particularly in that quiet gap between the New York close and the Tokyo open.
It also vanishes in the minutes right before and after a major news event, like an interest rate announcement from a central bank or a big jobs report. Trading during these windows is asking for trouble, as you're almost guaranteed to face massive spreads and chaotic price spikes.
Ready to trade with confidence using a strategy that adapts to any market condition? The Colibri Trader programs teach you how to master price action without relying on confusing indicators. Learn more at https://www.colibritrader.com.