


What Is Bid Ask Spread in Trading?
At its heart, the bid-ask spread is simply the gap between the highest price a buyer is willing to pay for something (that’s the bid) and the lowest price a seller is willing to accept for it (the ask).
Think of it as the small, built-in cost for making a trade happen. It's the slice of profit the market maker—the one facilitating the deal—pockets for their service.
The Core Concept of Trading Costs
If you've ever been to a currency exchange booth at an airport, you've seen this in action. They'll buy U.S. dollars from you at one price but will sell them back to you at a slightly higher price. That little difference between their buying and selling price is their profit, and it's a perfect real-world stand-in for the bid-ask spread in the financial markets.
Every single asset you can trade, from stocks to forex pairs, has two prices at any given moment:
- The Bid Price: This is the price where you can immediately sell the asset. It shows you the highest demand coming from buyers right now.
- The Ask Price: This is the price where you can immediately buy the asset. It represents the lowest supply being offered by sellers.
To help you keep these straight, here’s a quick-glance table.
Bid vs Ask at a Glance
This table breaks down the fundamental differences between the 'bid' and 'ask' prices from a trader's perspective. It's a handy reference for remembering who is doing what at each price point.
| Concept | Bid Price | Ask Price |
|---|---|---|
| Your Action | You SELL at this price | You BUY at this price |
| Market Maker's Action | They BUY from you | They SELL to you |
| Represents | Highest current buyer demand | Lowest current seller supply |
| Relative Value | Always lower than the ask | Always higher than the bid |
Understanding this distinction is the first step, but the real key is knowing that the spread itself—that gap between the bid and the ask—is your first hurdle to clear.
The spread is the very first obstacle your trade must overcome to become profitable. If you buy an asset at the ask price, its value has to climb high enough to get past the current bid price before you can even think about selling for a gain.
For anyone who trades actively, getting a feel for these price movements is non-negotiable. It's why a solid grasp of what is price action is such a critical next step on your trading journey.
Interestingly, while the spread is a vital metric, some of the ways it's traditionally calculated can be a bit misleading. Research has found that the average bias in measuring the effective bid-ask spread for S&P 500 stocks can be around 18%. For lower-priced stocks, this overstatement of true trading costs can skyrocket to as high as 97%. This just goes to show why digging into the details of the spread is so crucial for managing your trading costs effectively.
How to Calculate the Bid-Ask Spread
Figuring out the bid-ask spread is surprisingly easy. It’s a bit of simple math that instantly tells you the direct cost of jumping into any trade. Forget the complicated jargon; this is the raw number.
The formula is just the ask price minus the bid price. That's it.
Ask Price – Bid Price = Spread
This quick calculation gives you the spread in raw, monetary terms. It shows you exactly what you’d pay if you bought an asset and sold it again in the very next second. Let’s look at how this plays out in a few different markets.
Calculating Spreads in Different Markets
The basic math never changes, but the numbers you're plugging in will look wildly different from one asset to the next. Seeing them side-by-side really highlights how your trading costs can vary.
- A Popular Tech Stock: Let’s say Company XYZ has a bid price of $150.25 and an ask price of $150.27. The spread is a tiny $0.02. This is the kind of tight spread you'd expect for a stock with tons of buyers and sellers.
- A Major Forex Pair: For a currency pair like EUR/USD, you might see a bid of 1.0855 and an ask of 1.0857. That gives you a spread of 0.0002, a tiny fraction that forex traders call 2 pips.
- A Leading Cryptocurrency: For something like Bitcoin, the numbers are much bigger. A bid of $65,150 and an ask of $65,175 gives you a raw spread of $25.
Now, these raw numbers are useful, but they don't tell you the whole story. Is a $25 spread on a $65,000 asset better or worse than a $0.02 spread on a $150 stock? To make a fair comparison, you have to think in percentages.
To really compare apples to apples across different assets, you need to calculate the spread as a percentage. This is the formula that matters: (Ask Price – Bid Price) / Ask Price * 100.
This step is crucial. It turns a simple dollar (or pip) value into a standardized metric. This way, you can accurately see which asset is actually cheaper to trade and make much smarter decisions about where you put your capital.
Why This Hidden Cost Matters to Your Profits
The bid-ask spread is more than just a couple of numbers on your screen; it’s a direct tax on every single trade you place. It might seem small, but this cost adds up over time and can absolutely be the deciding factor between a winning strategy and one that just slowly bleeds your capital away.
Think of it as an immediate performance hurdle. Your trade has to clear this cost just to get back to zero.
This hidden cost becomes a real problem for active traders. If you’re placing dozens or even hundreds of trades a week, that spread is a constant, nagging expense that eats directly into your potential gains. A seemingly tiny spread can quietly grow into a substantial sum, draining your bottom line before you even notice.
The Tale of Two Traders
To really see this in action, let's imagine two traders, Alex and Ben. They both have a strategy aiming to make $500 on a $10,000 position.
- Alex trades a highly liquid stock with a tight spread of just $0.01. The price only needs to move a single cent in his favor before he starts seeing green.
- Ben trades a less-known, illiquid stock with a wide spread of $0.50. The price has to move fifty cents in his favor just to cover the spread before he can even think about making a profit.
For Alex, hitting his $500 profit target is a pretty straightforward challenge. But for Ben, the journey is much, much harder. He starts his trade $500 in the hole from the very beginning, just from the spread ($0.50 spread x 1,000 shares). His strategy needs to be flawless just to overcome this initial handicap.
The size of the bid-ask spread is a direct reflection of an asset's liquidity and risk. A wide spread is a clear signal of higher trading costs and can put you at a major disadvantage from the get-go, turning what looks like a great setup into an immediate loser.
This link between liquidity and the spread isn't just theory; it’s a well-documented market reality. Research on U.S. bond markets, for example, found that higher trading volumes consistently led to narrower spreads. On average, less liquid municipal bonds had bid-ask spreads about 9 cents higher per $100 par value than highly liquid government bonds.
This shows exactly how liquidity shapes your trading costs. You can check out the full findings about bond market spreads from the New York Fed. It proves why keeping an eye on the spread isn't just a technical detail—it’s absolutely essential for your financial success.
The Forces That Widen or Narrow Spreads
The bid-ask spread isn't some fixed, static number. It’s alive, constantly breathing—expanding and contracting based on powerful market forces. Have you ever seen the spread on a stock suddenly blow out just moments before a big news announcement? That’s no accident. It’s the market reacting in real-time.
Getting a handle on these forces gives you a serious edge. It helps you anticipate when your trading costs might spike, so you can avoid jumping into a trade at exactly the wrong moment. In my experience, it really boils down to three main drivers that determine whether a spread is razor-thin or surprisingly wide.
Liquidity and Trading Volume
Of all the factors, liquidity is king. Think of it as how easily you can buy or sell something without moving the price. It's the difference between a bustling marketplace packed with people and a quiet, deserted street.
A stock like Microsoft, with millions of shares changing hands every day, is swimming in a deep pool of buyers and sellers. This high volume and deep liquidity mean market makers can match orders almost instantly with very little risk. What's the result? A consistently tight spread, often just a penny.
Now, flip that scenario. A small-cap stock that only trades a few thousand shares a day has very low liquidity. For a market maker, finding someone to take the other side of a trade is tough and much riskier. To make it worth their while, they widen the spread to compensate for that risk.
Volatility and Market Uncertainty
Volatility is just a measure of how much an asset's price is jumping around. When things are calm and predictable, spreads tend to stay tight and narrow. But the moment uncertainty creeps in—think an earnings report, a Fed announcement, or unexpected geopolitical news—volatility goes through the roof.
And market makers absolutely hate uncertainty. To protect themselves from getting caught on the wrong side of a sharp, sudden price move, they immediately widen the spread. It’s like they're building a bigger buffer to absorb the shock of whatever is coming.
You can think of a wide spread as a market maker’s insurance policy against volatility. By increasing the gap between what they’ll pay and what they’ll accept, they give themselves more room to breathe and protect their capital when the market gets choppy.
This isn't just some defensive reaction; it’s a massive tell for us traders. Globally, bid-ask spreads are seen as critical early warning signs of market jitters. Research has shown time and again that volatile markets almost always lead to wider spreads, which means higher transaction costs and more cautious investors. If you want to dive deeper, there are some great insights on spreads as market indicators at NumberAnalytics.com.
How Spreads Behave Across Different Markets
A one-cent spread means something very different for a $2 stock than it does for a major forex pair. The concept of the bid-ask spread really clicks when you see how it behaves across stocks, forex, and crypto. Each market has its own unique personality, shaped by its participants, trading volume, and the very structure of how it operates.
Getting a feel for these differences is vital for any trader. It helps you set realistic expectations for your trading costs and adjust your strategy to the specific asset you're dealing with. No one likes costly surprises.
Stocks Spreads
When you're trading stocks, the bid-ask spread is usually talked about in cents. For heavily-traded, large-cap stocks like Apple or Microsoft, it's common to see spreads as tight as a single penny. This is a direct result of immense liquidity—millions of shares change hands every day, making it easy for market makers to match buy and sell orders with almost no risk.
But the story is completely different when you venture into the world of small-cap or penny stocks. With far fewer traders in the game, the spread can blow out to several cents or even more. This makes these more obscure assets significantly more expensive to trade in and out of quickly.
Forex Spreads
The foreign exchange (forex) market is the biggest and most liquid financial market on the planet, with trillions of dollars traded daily. This incredible scale leads to exceptionally tight spreads, especially for the major currency pairs like EUR/USD or USD/JPY.
In forex, we measure spreads in "pips," which are just a tiny fraction of a currency's unit. It’s not unusual at all to see spreads well below one pip, which really shows off the extreme efficiency and low transaction costs of this global arena.
The chart below gives you a good visual of the typical spread differences you can expect to see across these major asset classes.
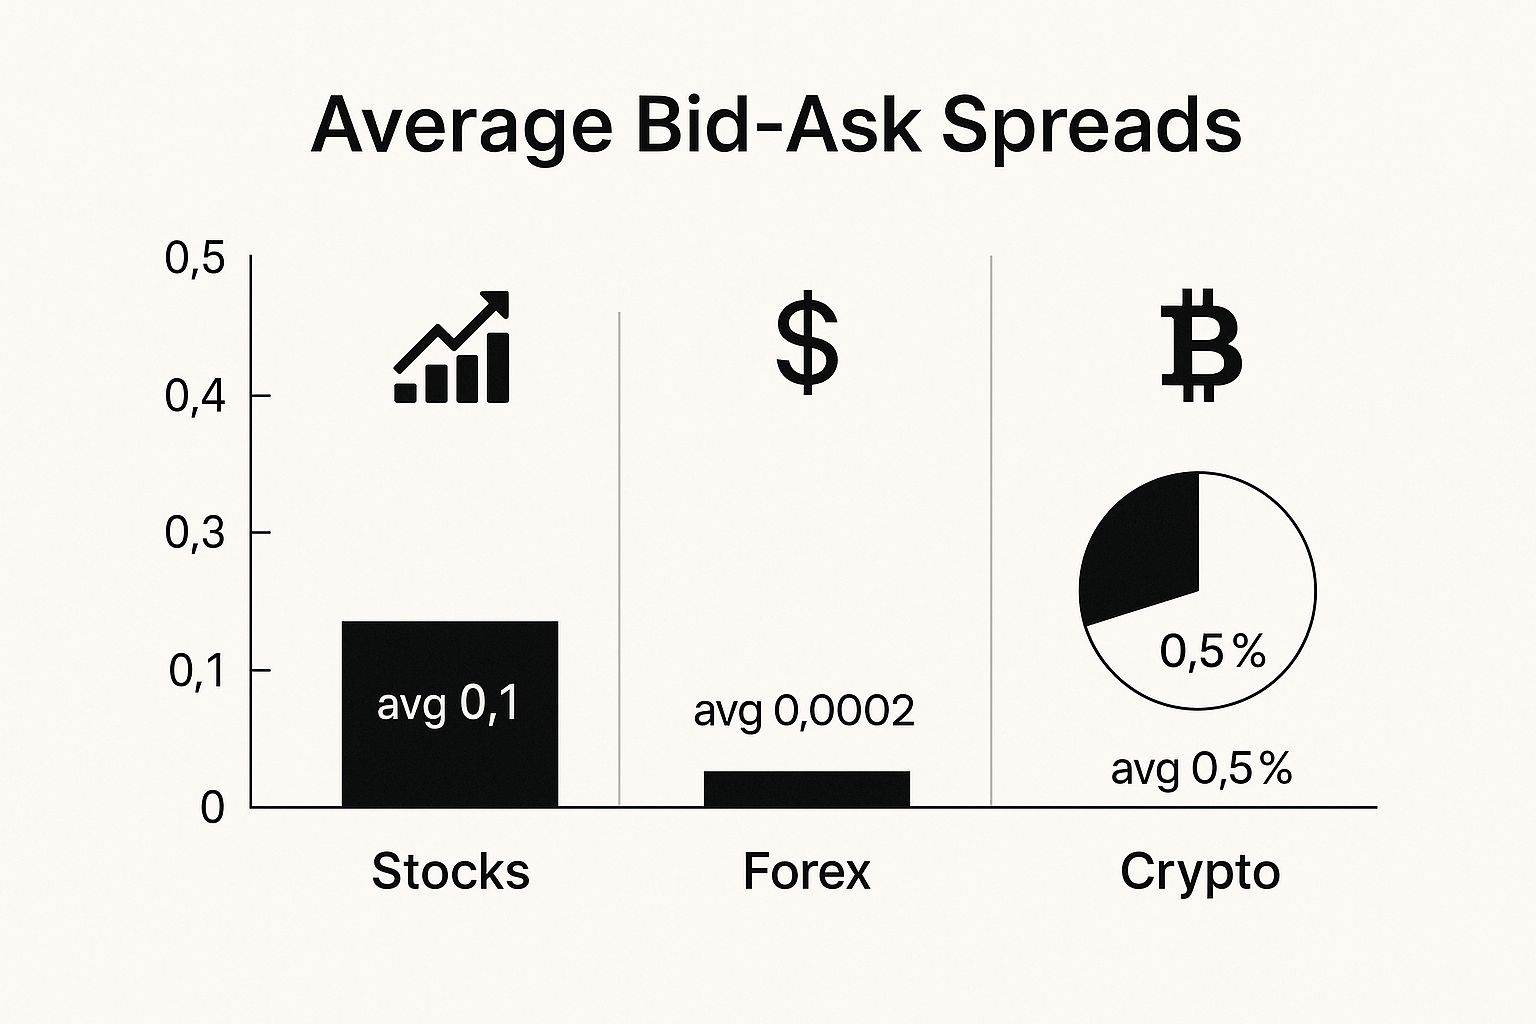
As the data shows, forex markets are the clear winners for tight spreads. On the other end, crypto spreads can be much wider, which is a direct reflection of their higher volatility and more fragmented liquidity.
Crypto Spreads
Cryptocurrency markets are famous for their volatility, and their spreads are a perfect mirror of this. For the big players like Bitcoin and Ethereum, you can find relatively competitive spreads on large, reputable exchanges. Still, they're typically wider than what you'd see for major stocks or forex pairs.
The real variability shows up with the smaller, lesser-known altcoins. Here, liquidity can be thin and scattered across dozens of different exchanges. This fragmentation almost always leads to significantly wider bid-ask spreads, making them much costlier for active trading and hammering home the higher risk involved.
Typical Spread Characteristics by Market
To tie this all together, here’s a quick comparison of how liquidity and other factors influence spreads in these three distinct markets.
| Market | Typical Liquidity | Common Spread Size | Key Influencing Factor |
|---|---|---|---|
| Stocks | High (large-caps) to Low (penny stocks) | $0.01 for liquid stocks, wider for illiquid ones | Trading Volume & Company Size |
| Forex | Extremely High | < 1 pip for major pairs | Global Economic Events |
| Cryptocurrency | Moderate to Low | Varies widely, wider than forex/stocks | Volatility & Exchange Liquidity |
Understanding these market-specific nuances is a big step. It's not just about knowing what a spread is, but knowing what a "normal" spread looks like for the asset you're trading. This insight helps you avoid bad fills and better manage your overall trading costs.
Practical Ways To Minimize Spread Costs
Knowing what the bid-ask spread is one thing, but actively fighting its effect on your capital is what separates the consistently profitable traders from everyone else. This is where knowledge becomes action.
Luckily, there are a few practical tactics you can use to keep your spread costs down and protect your hard-earned profits.
One of the easiest ways is to simply be picky about when you trade. Spreads aren't fixed. They tend to widen out when liquidity is low, like overnight or during bank holidays.
By concentrating your trading activity during peak market hours—think the London and New York session overlap for forex—you can trade when volume is highest and spreads are tightest.
Use Limit Orders To Control Your Price
Another powerful tool in any trader’s arsenal is the limit order. When you hit the button on a market order, you’re basically telling your broker to get you in or out at whatever the best available price is right now. This means you are guaranteed to pay the spread.
A limit order, on the other hand, lets you dictate the price you’re willing to accept.
- When buying, you can set a limit order at or even below the current bid price.
- When selling, you can place a limit order at or above the current ask price.
This hands you back control over your execution price. It’s a great way to avoid getting stung by a wider-than-expected spread, especially when the market is moving fast.
By using limit orders, you switch from being a price-taker to a price-maker. You are the one setting the terms for your entry, which is a fundamental step in disciplined trading and smart risk management.
Ultimately, keeping spread costs low is just one piece of a much bigger puzzle. To see how this fits into your overall strategy, you can find some great insights in our guide on risk management to keep your money safe.
Finally, your choice of broker is massive. Different brokers will offer you different spreads, and a little bit of homework here can save you a serious amount of cash over time.
Always compare brokers based on their typical spreads for the assets you trade the most. Picking one with competitive pricing is a foundational move that cuts your costs on every single trade you make, right from day one.
Common Questions About the Bid Ask Spread
Even after you get a handle on the basics, a few questions about the bid-ask spread tend to come up again and again. Getting some straight answers can really cement your understanding and clear up any lingering confusion about how this all works in the real world of trading.
What Is the Main Cause of a Wide Bid Ask Spread?
The number one reason you'll see a wide bid-ask spread is low liquidity. Plain and simple.
When there aren't many active buyers and sellers for an asset, market makers are taking on more risk. To protect themselves, they widen the spread. It’s their compensation for the added difficulty and time it might take to offload their position. Think of it as a built-in safety net. This is exactly why you'll often find wider spreads on obscure, thinly-traded stocks or during after-hours trading sessions.
Can the Bid Ask Spread Be Negative?
Under any normal market conditions, the answer is a hard no.
A negative spread would mean the bid price is actually higher than the ask price. In other words, buyers are willing to pay more than what sellers are asking for. This creates a completely risk-free profit opportunity called arbitrage, and traders would pounce on it instantly. This flurry of activity corrects the price imbalance in seconds, pushing the spread back into positive territory where it belongs.
How Do I Find the Spread for a Specific Stock?
Finding the spread is actually very straightforward on any modern trading platform. All you have to do is pull up the "Level 1" or "Market Data" quote window for the stock you're watching.
You'll see two prices listed right next to each other:
- Bid: The price you can sell at right now.
- Ask: The price you can buy at right now.
The bid-ask spread is just the difference between those two numbers. It sounds simple, but misinterpreting this basic data is one of many errors that can be costly for new traders. Understanding how to avoid these common pitfalls is essential, something we detail in our guide on the 10 fatal mistakes traders make.
At Colibri Trader, we teach you how to master price action so you can trade with confidence, without relying on confusing indicators. Take control of your trading journey by discovering our proven strategies at https://www.colibritrader.com.