


what is a doji candlestick? Signals, patterns, and trading
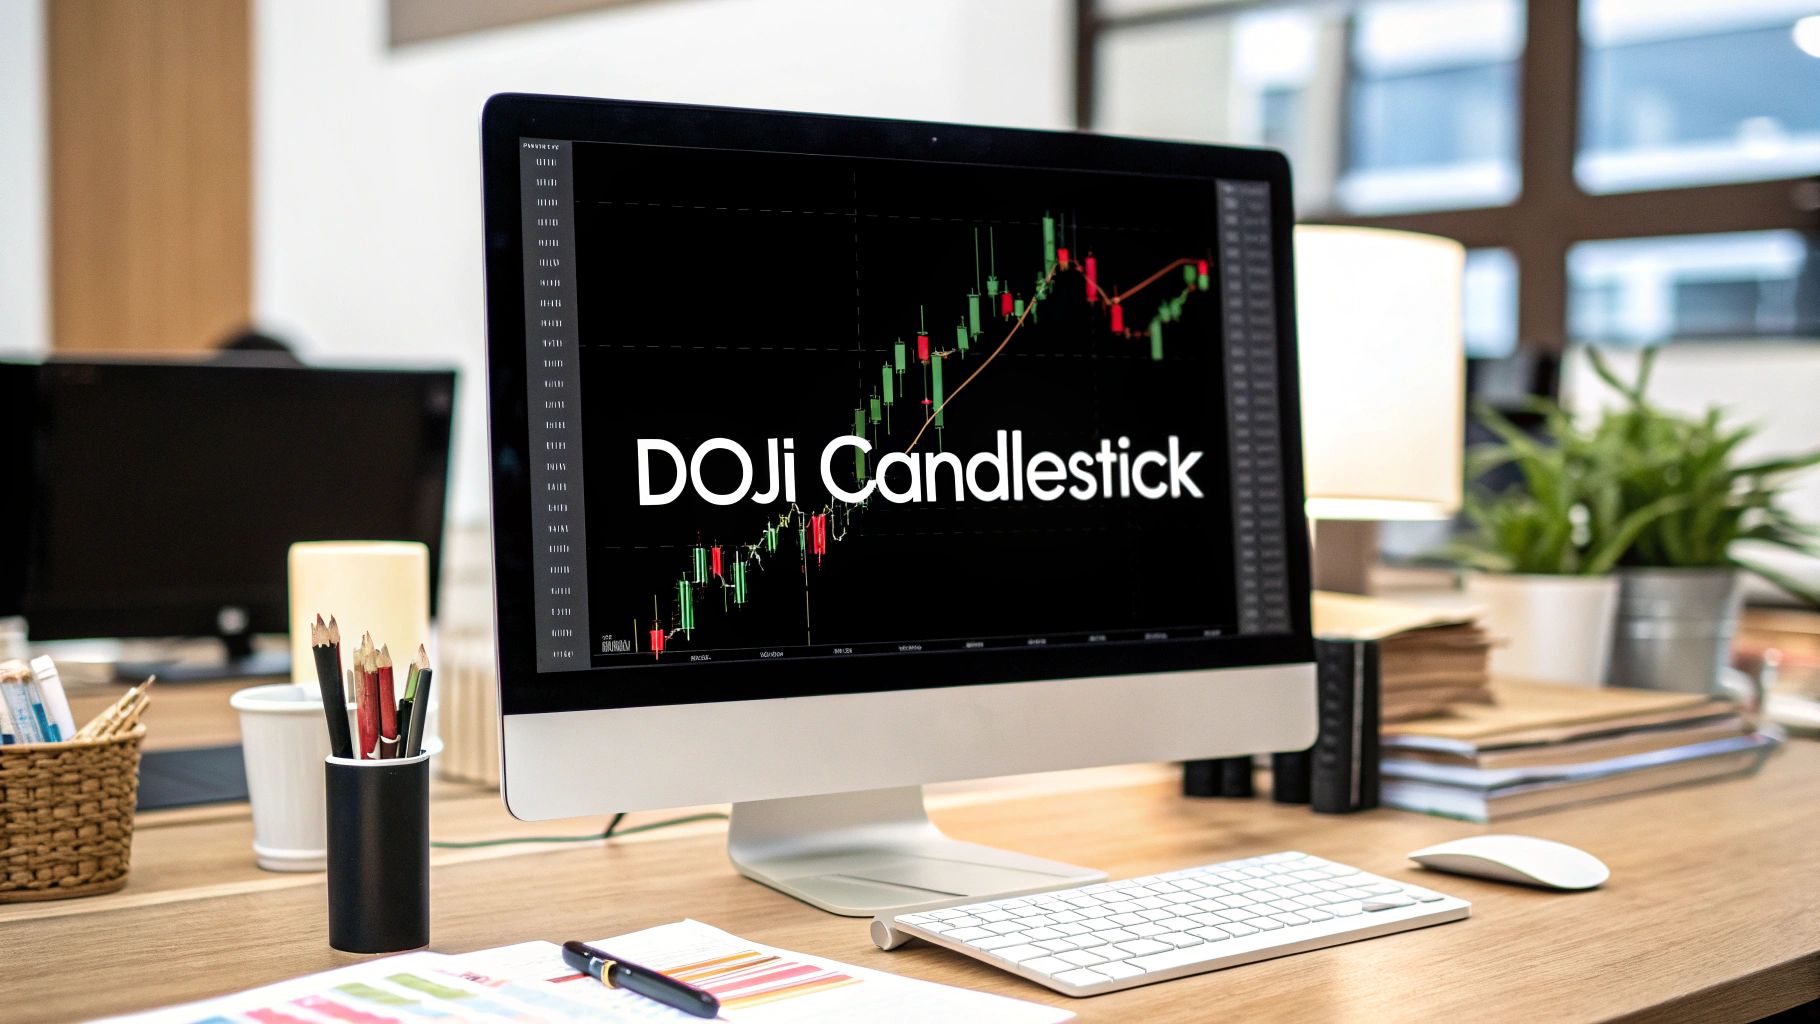
In the world of technical analysis, some candlestick patterns scream a clear message, while others are more of a whisper. The Doji is one of those whispers, but it’s one you absolutely need to hear. It's a unique pattern that signals one crucial thing: indecision.
A Doji forms when a security's opening and closing prices for a period are practically the same. The result is a candlestick with a tiny (or even non-existent) body, often looking like a cross or a plus sign. Think of it as a temporary truce in the constant battle between buyers and sellers.
Uncovering the Story Behind Market Indecision
Imagine a fierce tug-of-war. For a whole day, two teams pull with all their might, but neither can gain an inch. When the whistle blows, the rope is right back where it started. That’s exactly what a Doji represents on a price chart.
Throughout the trading session, both the bulls (buyers) and the bears (sellers) pushed the price around, creating the high and low points of the candle's wick. But by the time the session closed, neither side had won. The price settled right back where it began. The Japanese word ‘Doji’ actually means ‘mistake,’ which perfectly captures this feeling—the market made a ‘mistake’ by failing to pick a clear direction.
Why This Pause Matters
This little cross on your chart isn't just noise; it’s a powerful signal that the prevailing market momentum might be running out of gas. For a price action trader, seeing a Doji is a cue to sit up and pay very close attention.
Does it guarantee a reversal? Absolutely not. But it’s a strong suggestion that the current trend is losing steam. It's the market taking a breath.
The core message of a Doji is equilibrium. It shows that the forces of supply and demand have hit a stalemate, and the market is pausing to figure out where to go next.
Getting a handle on this concept of balance is the first step to interpreting more complex patterns on your charts. By simply recognizing a Doji, you can spot these moments of potential change before the next big move happens. To see how this fits into the bigger picture, you should check out our comprehensive guide on understanding candlestick charts.
To quickly recap, here’s a look at what the Doji tells us at a glance.
Doji Candlestick at a Glance
This table breaks down the essential components and what they mean for you as a trader.
| Component | Description | Market Implication |
|---|---|---|
| Real Body | Very small or non-existent; open and close prices are nearly identical. | Signifies a perfect balance between buying and selling pressure. |
| Shadows (Wicks) | Can be long or short, extending above and below the real body. | Shows the range of price movement during the period, indicating volatility. |
| Overall Shape | Resembles a cross, inverted cross, or plus sign. | A clear visual cue for market indecision and a potential turning point. |
In short, this single candle is a compact but powerful piece of market information.
Here’s what a Doji candlestick really provides:
- Indecision: It’s the most straightforward visual cue that neither the buyers nor the sellers are in control.
- Potential Reversal: When a Doji appears after a strong, established trend (either up or down), it can be a major red flag that the trend is exhausted.
- Confirmation Needed: A Doji is a warning, not a trading signal on its own. The candle that forms after the Doji is crucial for confirming the market's next intended direction. Never act on a Doji in isolation
Understanding the Anatomy of a Doji
To really understand what a doji is telling you, you need to see the story it tells. Every candlestick paints a picture using four key price points, but the Doji’s narrative is one of pure, unadulterated conflict. It’s a snapshot of a battle fought during a single trading session.
The structure itself is incredibly simple, which is what makes it so powerful. A Doji forms when the open and close prices are practically the same. This is what creates that classic thin line or non-existent "real body" that makes the pattern so easy to spot on a chart.
But the real action? That's all in the shadows.
Reading the Wicks
Those long lines sticking out from the top and bottom of the body are called wicks or shadows. Think of them as the battle map, showing just how volatile the session was.
- The High: The very tip of the upper wick shows you peak optimism. This was the highest point the buyers managed to push the price before sellers stepped in and shoved it back down.
- The Low: On the flip side, the bottom of the lower wick represents the moment of maximum pessimism. This was as far as sellers could drag the price down before buyers jumped back into the ring.
The crucial takeaway here is that despite all that pushing and pulling to new highs and lows, neither side could claim victory. The price was ultimately dragged right back to where it started, ending in a stalemate.
This visual representation of a draw is what gives the Doji its meaning. It’s not just a random cross on your screen; it’s a clear signal of market indecision. The longer the wicks, the more intense the fight was, and the more significant that indecision becomes.
Once you can read this anatomy at a glance, you can instantly interpret the market sentiment behind the pattern. You're no longer just looking at a shape; you're reading a valuable piece of market intelligence.
Exploring Common Doji Variations
While every doji signals a pause, not all pauses tell the same story. The indecision a doji represents has different flavors, and recognizing these subtle variations can give you a significant edge in your trading.
Think of them as different characters in the doji family, each with a unique personality and message about the market's state of mind. Understanding these nuances is a key part of interpreting more advanced Japanese candlestick patterns.
The length and position of the wicks are what create these distinct variations. A simple doji might signal a quiet stalemate, but another could scream of intense volatility that ended in a draw. Let's break down the most common types you'll encounter on your charts.
The Key Personalities of the Doji Family
Each doji variation gives us clues about the underlying battle raging between buyers and sellers. By looking at the wicks, you can get a sense of who tried to take control and how the fight ended.
- Standard Doji: This is your classic plus-sign shape. It has short, relatively equal wicks, indicating low volatility and pure indecision. It's the most neutral of the bunch.
- Long-Legged Doji: Featuring significantly longer upper and lower wicks, this pattern shows that a fierce battle took place. Prices swung wildly in both directions before closing right back where they started, signaling extreme indecision amid high volatility.
- Dragonfly Doji: Shaped like a "T," this doji has a long lower wick and basically no upper wick. This tells us that sellers dominated early on, pushing prices way down. But then, buyers stormed back with incredible force to drive the session's close all the way back up to the open price. This is often a powerful bullish signal after a downtrend.
- Gravestone Doji: The mirror opposite of the Dragonfly, this pattern looks like an inverted "T." Here, buyers initially pushed the price high, but sellers took complete control and slammed it back down to the open. This often signals a potential bearish reversal after an uptrend.
To make these differences crystal clear, here’s a quick comparison of the main doji patterns you'll see.
Comparing Common Doji Candlestick Variations
This table breaks down the four main types of Doji patterns, their appearance, and what they signal to traders who are paying attention.
| Doji Type | Appearance | Primary Signal |
|---|---|---|
| Standard Doji | A symmetrical plus sign with short wicks. | Pure indecision and low volatility; a market taking a breath. |
| Long-Legged Doji | A plus sign with very long upper and lower wicks. | Extreme indecision amid high volatility; a major struggle is underway. |
| Dragonfly Doji | A "T" shape with a long lower wick and no upper wick. | Bullish rejection; sellers tried to push prices down but were defeated. |
| Gravestone Doji | An inverted "T" with a long upper wick and no lower wick. | Bearish rejection; buyers tried to push prices up but were overpowered. |
Understanding these distinctions helps you read the market's mood with much greater accuracy. A simple pause is one thing; a powerful rejection is a whole different story.
The infographic below highlights the core anatomy that defines every single doji candlestick, no matter the variation.
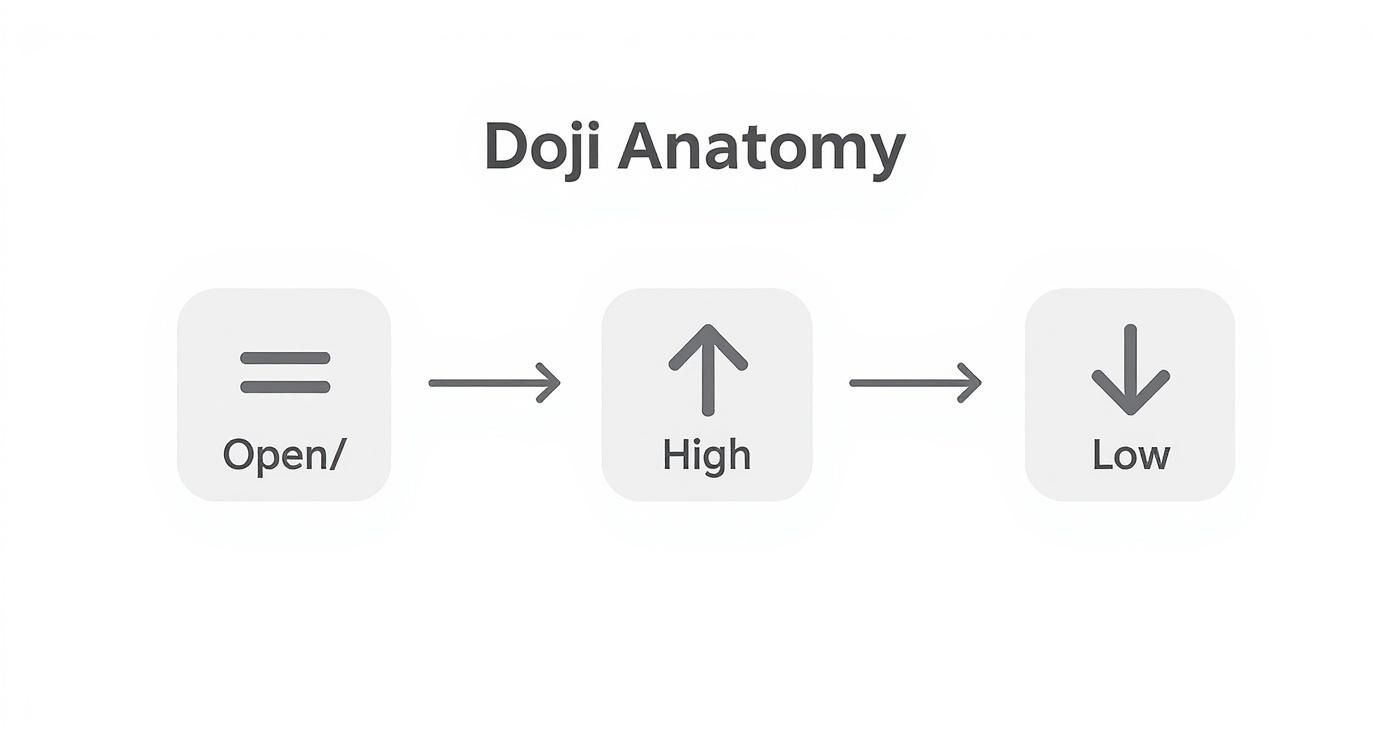
This visual shows the key price points—the open, close, high, and low—and how their relationship creates the doji's signature look of indecision.
A doji isn’t just a shape; it's the result of a session-long conflict. The Dragonfly and Gravestone dojis are particularly important because they don't just show indecision—they show that one side attempted a major move and was decisively rejected. This rejection is a powerful clue for traders.
How to Trade with Doji Candlestick Signals
Spotting a Doji is the easy part. Knowing what to do with it is where you start to get a real edge. The secret isn't in the Doji itself, but where it shows up on your chart. A Doji floating around in a sideways, choppy market is mostly just noise. But one that forms at the very peak of a long rally or at the bottom of a steep decline? That's a different story entirely.
Think of it like a yellow traffic light. If you see one in the middle of an empty street, you barely notice. But when you see it at a major intersection after a long stretch of green, you hit the brakes. It's a clear warning that the flow of traffic is about to change.
Context is King in Trading
The most powerful Doji signals scream for attention when they appear at key price levels. When a Doji forms right up against a major support or resistance level, its message of indecision becomes much more potent. It’s the market telling you that the prevailing trend has just slammed into a brick wall and is struggling to push through.
This is a core principle you have to get comfortable with, and you can dive deeper into these strategies by learning how to trade using price action in our detailed guide. Smart trading isn't about blindly reacting to a single candle; it's about building a convincing case for a trade.
Here’s how you start building that case:
- What's the Trend? First, zoom out. Is the market clearly moving up or down?
- Where Are the Key Levels? Is this Doji forming near a historical support or resistance zone that has mattered before?
- Wait for Confirmation. This is the big one. Never, ever trade a Doji in isolation. The next candle is your confirmation.
A Doji candlestick signals a potential turning point. The candle that follows either confirms it or cancels it out. A strong bullish candle after a Doji in a downtrend is a green light for a potential reversal up. A bearish candle after a Doji in an uptrend confirms that sellers might be taking over.
Common Doji Reversal Patterns
Often, a Doji is just one piece of a larger puzzle. It frequently acts as the centerpiece in bigger, multi-candle reversal patterns that traders have relied on for decades. Two of the most common are the Morning Star and the Evening Star.
For example, a classic bullish signal is the Bullish Doji Star. This pattern shows up after a downtrend with a couple of bearish candles, followed by the Doji. It signals that the selling pressure is finally running out of steam.
On the flip side, a classic bearish reversal pattern is the Evening Star. This typically forms at a market top and consists of a large bullish candle, followed by a Doji, and then a large bearish candle. This sequence is a strong hint that the rally is over.
By waiting for these kinds of patterns and always demanding that confirmation from the next candle, you can make much more informed decisions. More importantly, it helps you manage your risk by giving you a clear point to place your stop-loss.
Common Mistakes To Avoid When Using Dojis
Traders often spot a Doji on a chart and instantly shout “reversal!” That rush can backfire. Although a Doji’s cross-like silhouette grabs your attention, it doesn’t hand you a guaranteed change in trend.
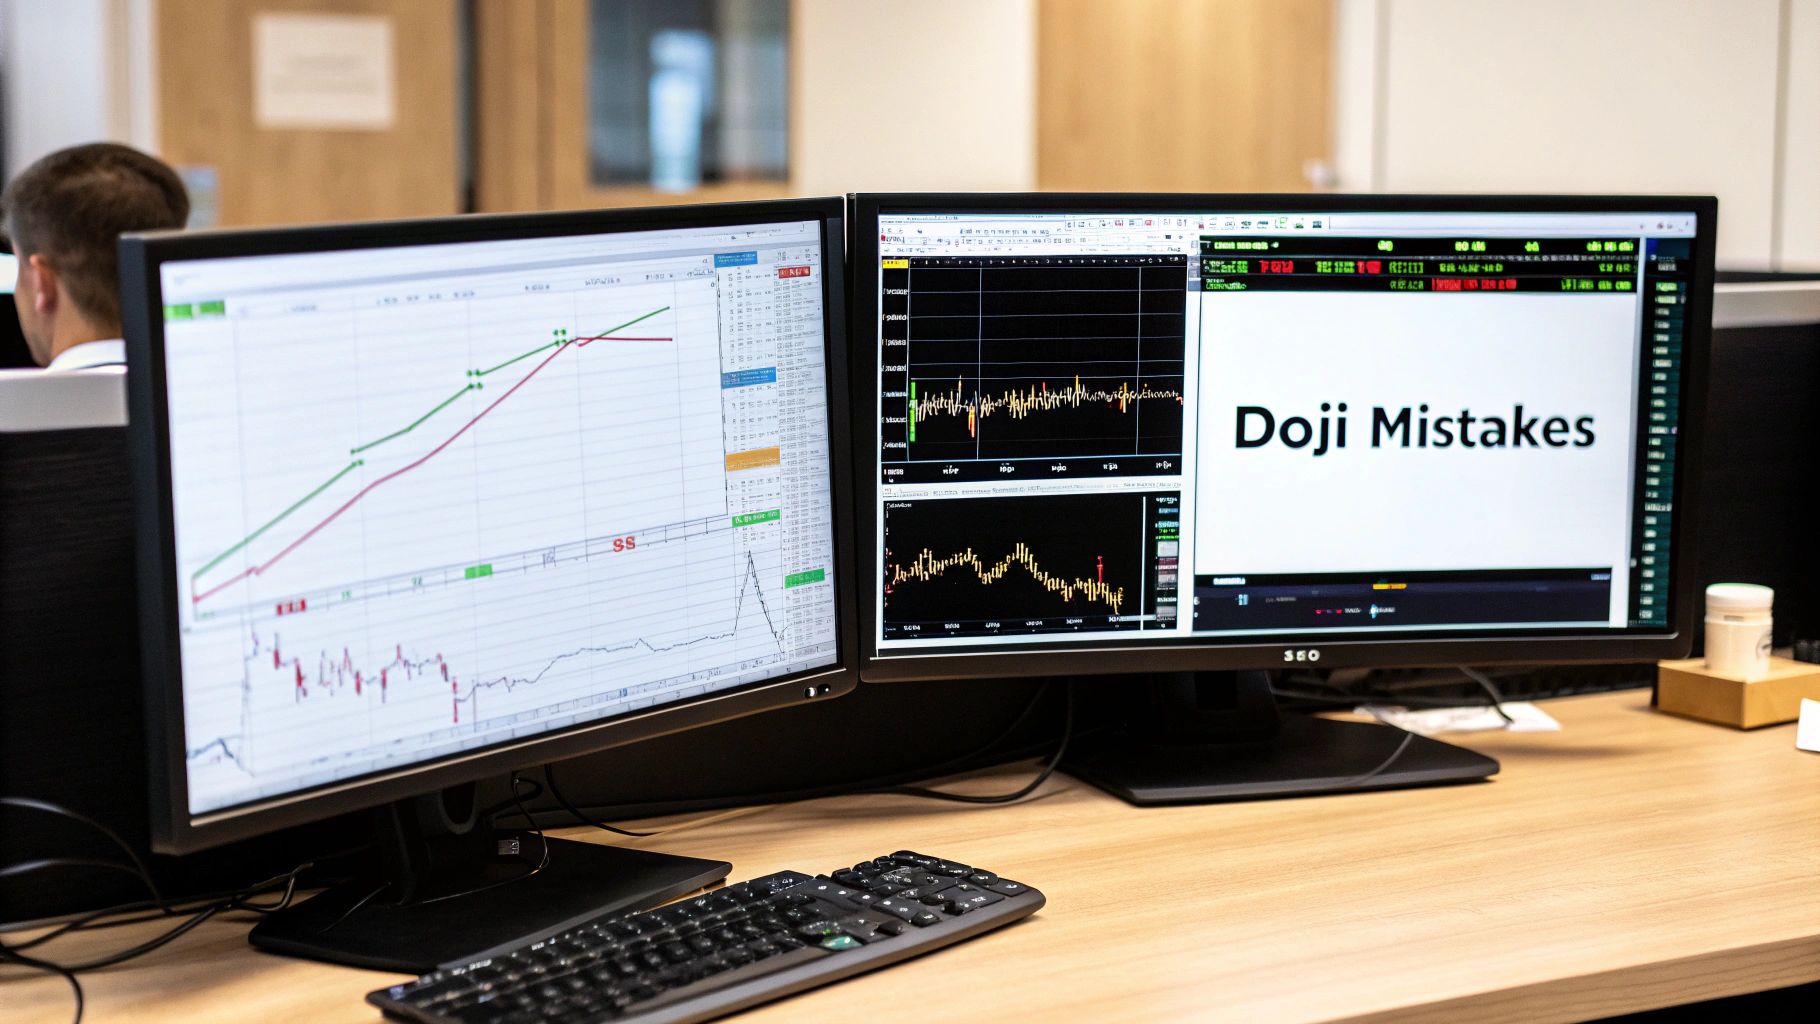
Treating a Doji as a magic bullet for reversals—without any supporting evidence—is a fast track to disappointment. At its core, this pattern merely highlights indecision: a hesitation, not a “market death sentence.” Relying on a lone Doji is essentially a high-risk gamble.
To steer clear of this trap, always weigh the Doji against its surroundings. A Doji wandering through a choppy, sideways market carries little weight. Conversely, if it pops up after a strong trend, right at a well-tested support or resistance zone, that’s when you sit up and pay attention.
Building A Case Beyond A Single Candle
Successful trading is detective work, not guesswork. A Doji offers a clue—but it’s far from the full story. Before you pull the trigger, look for signals that confirm or challenge that initial hint.
Common Errors To Sidestep:
- Ignoring The Trend: Betting on a reversal against a powerful trend after spotting one Doji is like trying to stop a runaway locomotive with your bare hands.
- Forgetting Volume: A Doji on high trading volume matters. It suggests a real struggle between buyers and sellers, making the pause far more meaningful.
- Neglecting Other Indicators: Dojis become far more reliable in tandem with oscillators such as the RSI during overbought or oversold conditions. You can dive deeper into these statistical insights via Fort Hays State University research.
A Doji is not a command to trade; it is a question the market is asking. Your job is to wait for the answer, which comes from the candles and indicators that follow.
By sidestepping these pitfalls and treating the Doji as a prompt for deeper analysis—rather than an automatic entry signal—you’ll harness its real power. Use it as a spotlight, not a flashing “BUY” or “SELL” sign.
Frequently Asked Questions About Doji Candlesticks
Even when you feel you've got a good handle on Doji candlesticks, questions always pop up when you're staring at a live chart. Let's tackle the most common ones head-on, so you can clear up any confusion and start applying what you've learned with more confidence.
Is a Doji Always a Reversal Signal?
Absolutely not. If you remember only one thing from this article, let it be this. A Doji’s primary job is to signal indecision, not a guaranteed reversal.
Think of it like a yellow traffic light. It’s a warning that the current trend might be about to change, but it could just as easily be a brief pause before the cars start speeding up again. The key is to always wait for confirmation from the very next candle—that's what tells you where the market is likely heading next.
A Doji is a question, not an answer. The market’s subsequent price action provides the answer. Acting on the Doji alone is like answering a question before it has been fully asked.
What Is the Difference Between a Doji and a Spinning Top?
Both patterns scream market indecision, that's true. The real difference is subtle and lies in the body of the candle. A Doji has virtually no real body because its opening and closing prices are almost the same. A Spinning Top, on the other hand, has a small but noticeable real body.
So, what does this mean for your trading? A Doji represents a near-perfect stalemate between the bulls and bears. A Spinning Top shows that one side did manage to win the session, but only by a whisker. Because of this, a Doji often points to a deeper, more profound level of indecision.
Which Timeframe Is Best for Trading Doji Patterns?
Doji patterns carry far more weight on higher timeframes. I'm talking about the daily, weekly, or even the 4-hour charts. A Doji on a daily chart represents a full day of conflict that ended in a draw, which is a significant piece of market information.
On the flip side, you'll see Dojis all over the place on lower timeframes like the 1-minute or 5-minute charts. They're usually just random market noise and don't mean much. Stick to the higher timeframes to filter out that noise and focus on the signals that truly matter.
Can I Trade Based on a Doji Alone?
Trading a Doji in isolation is a high-risk gamble that professional traders just don't take. A Doji is a compelling piece of evidence, not a complete trading signal on its own. Your job is to build a solid case for any trade you take.
Before you even think about acting on a Doji, ask yourself a few questions:
- Where did it appear? Is it sitting at a major support or resistance level? That’s a huge clue.
- What is the overall trend? Does it signal a potential end to a strong trend, or just a pause?
- What are other tools telling me? Does an indicator like the RSI show an overbought or oversold condition at the same time?
The real skill is in combining a Doji with other pieces of analysis. That’s how you use it effectively.
At Colibri Trader, we teach you how to build a complete trading strategy around powerful price action signals like these, moving beyond single patterns to create consistent results. Discover your trading potential and learn a proven, indicator-free approach by visiting us at https://www.colibritrader.com.