


What Is a Doji Candle and How to Trade It Effectively

A Doji candle is one of the most powerful signals you’ll find on a chart, and it screams one thing loud and clear: indecision.
It’s a unique pattern that forms when a session’s opening and closing prices are almost exactly the same. The result looks like a cross, a plus sign, or even an inverted cross—a clear visual cue that the market is at a standstill. It represents a temporary truce between buyers and sellers, where neither side managed to win the battle for that period.
Understanding the Doji Candle’s Story of Indecision
Imagine a fierce tug-of-war between two equally matched teams—the bulls (buyers) and the bears (sellers). They pull with everything they’ve got, but when the dust settles, the rope has barely budged from its starting point.
This stalemate is precisely what a Doji candle illustrates in the market. It’s a snapshot of a battle that ended in a draw.
The core anatomy of a Doji is simple but profound. Its real body is either a tiny sliver or completely non-existent. This happens because the price opened, traveled up and down during the session, but ultimately closed right back where it started. The lines stretching above and below the body, known as wicks or shadows, reveal the full extent of the price struggle.
To help break this down, here’s a quick guide to a Doji’s key components.
Doji Candle Quick Reference Guide
| Characteristic | Description | What It Signifies |
|---|---|---|
| Real Body | Extremely small, thin, or non-existent (open ≈ close). | A stalemate; neither buyers nor sellers gained control. |
| Upper Wick | The line extending above the body, marking the session high. | The peak price buyers were able to push to. |
| Lower Wick | The line extending below the body, marking the session low. | The lowest price sellers were able to push to. |
| Overall Shape | Resembles a cross, plus sign, or inverted cross. | Pure market indecision and a potential turning point. |
This table captures the essence of a Doji, but the real magic happens when you understand the psychology behind it.
The Psychology Behind the Pattern
A Doji isn't just a shape on a chart; it's a story about market psychology. It signals a pause, a moment of hesitation where the prevailing momentum has stalled. After a strong uptrend, a Doji might suggest that the buyers are running out of steam. Conversely, after a sustained downtrend, it could indicate that sellers are losing their conviction.
A Doji's true power is not in predicting the future but in revealing the present state of indecision. It’s a warning sign that the market’s current direction is losing momentum, and a potential change could be on the horizon.
To truly grasp the significance of a Doji, it helps to first understand the foundational principles of technical analysis that guide how we interpret chart patterns. This pattern is one of the most widely recognized in the field for a reason.
Ultimately, a Doji is a neutral signal on its own. Think of it as a question mark, not an exclamation point. Its message depends entirely on the context—the preceding price action and where it forms on the chart. To use this pattern effectively, you have to look at the bigger picture, and that starts with a solid foundation in understanding candlestick charts.
Recognizing The Four Main Types Of Doji Patterns
Think of a Doji not as a single signal but as a quartet of clues. Each variation whispers something different about market hesitation. Spotting these subtleties is the key to turning a fleeting moment of indecision into a clear trading trigger.
All Doji share one trait: a tiny or non-existent body. Their wicks, however, vary in length and placement, painting a vivid picture of the tug-of-war between buyers and sellers.
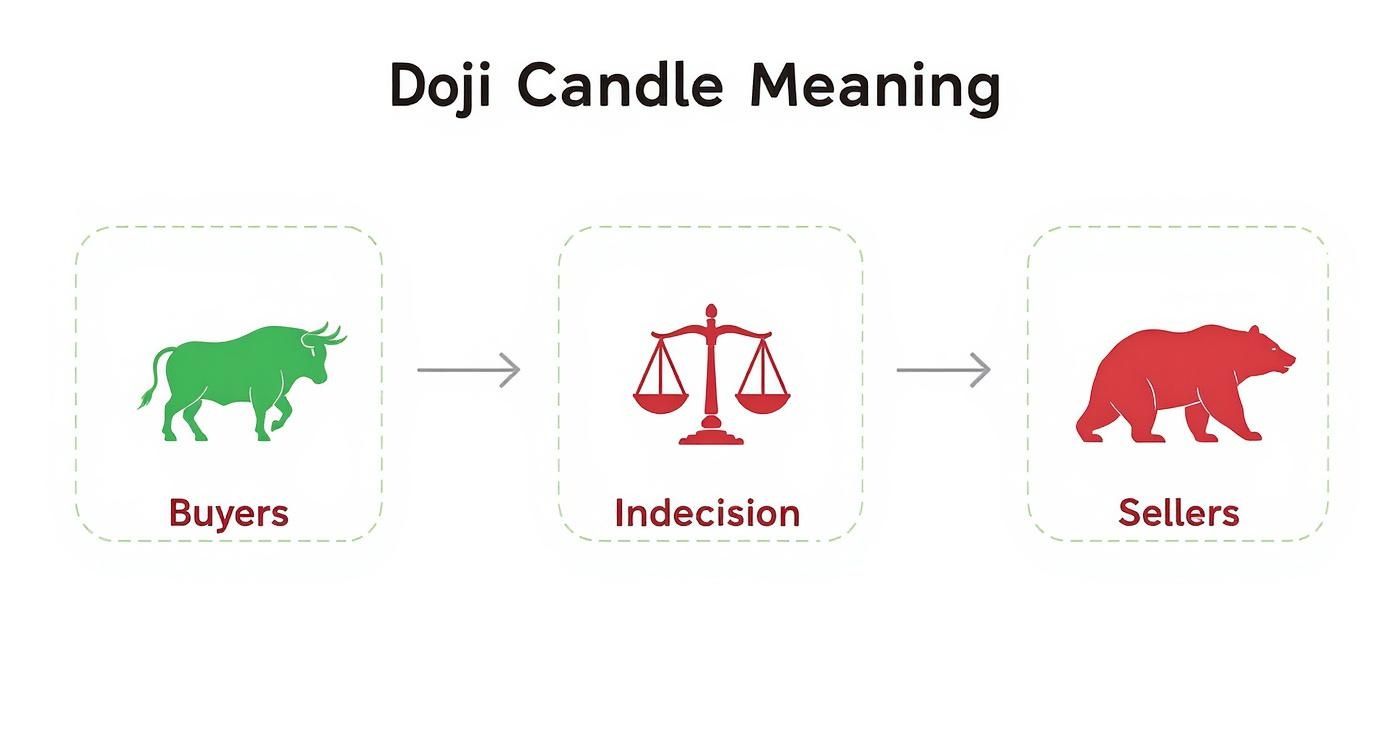
The image above captures that moment of balanced forces—where neither bulls nor bears claim victory. Let’s explore the four main Doji members and decode the tale each one tells.
The Gravestone Doji: A Bearish Warning
Picture a candle resembling an upright tombstone. The open, low, and close all cluster at the bottom of the session’s range, while a long upper wick towers above. That’s your Gravestone Doji, and it signals that buyers’ late surge fizzled under bearish pressure.
Key Takeaways:
- Buyers drove the price sharply higher.
- Sellers then overwhelmed them, dragging price back to open.
- This dramatic rejection of highs hints that sellers are now in control.
After a strong uptrend, a Gravestone Doji often marks a potential reversal. For a detailed breakdown of strategies around this pattern, check our guide on the Gravestone Doji candlestick.
The Dragonfly Doji: A Bullish Signal
Flip the Gravestone on its head and you get the Dragonfly Doji. Here, the open, high, and close sit at the top, with a long lower wick hanging beneath. It tells the story of sellers pushing price down before buyers stormed back in.
A Dragonfly Doji at the end of a downtrend often marks a price floor, indicating that selling momentum has waned and a bullish move may be brewing.
The Long-Legged Doji And The Spinning Top
Beyond the two opposites, two more shapes capture pure uncertainty.
The Long-Legged Doji sports lengthy wicks on both ends, with open and close anchored near the middle. It’s a snapshot of fierce back-and-forth action, ending in a stalemate.
A Spinning Top looks similar but carries a small, visible body. While not a textbook Doji, it shares the same message of market indecision.
Both patterns hint that price is coiling. Stay alert—these neutral candles often precede a significant breakout once the stalemate resolves.
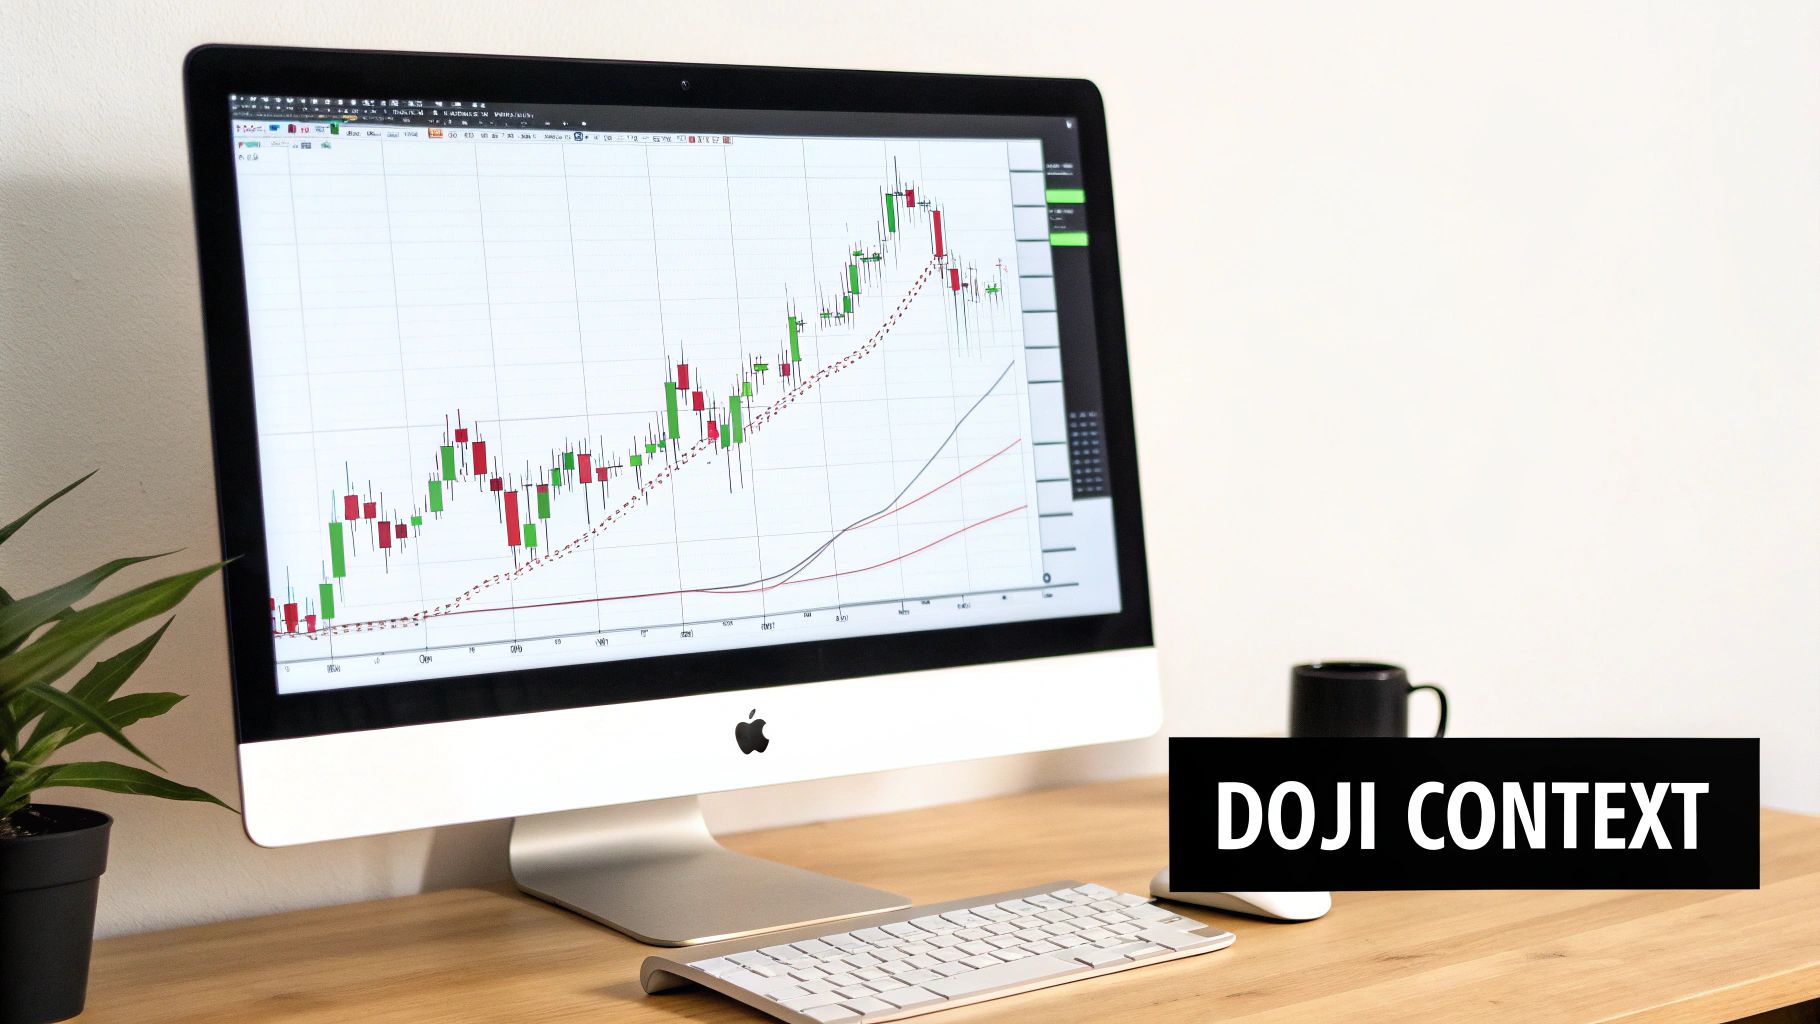
Reading the Doji in Its Natural Habitat
A Doji candle popping up in the middle of a choppy, sideways market is like a whisper in a loud room—it just gets lost in the noise. But when that same Doji appears at a critical turning point on your chart, its message becomes crystal clear. This is where we move beyond simply spotting a pattern and start understanding what it’s actually telling us.
Context is everything. It's the key that unlocks a Doji's true meaning. Its location transforms it from a simple mark of indecision into a powerful clue about what the market might do next. Without understanding the environment, you risk jumping the gun on a false signal.
The Power of Location and Confirmation
Think of a car approaching a red light. The red light (our Doji) signals a stop, but you don't immediately crank the wheel and turn. You wait for the green light (confirmation) before changing direction. Trading a Doji works the same way; it’s a potential pause in momentum, but you absolutely must wait for the next candle to confirm the new direction.
A Doji is a signal of probability, not a guarantee of certainty. The disciplined trader always waits for the next candle to close, validating the Doji’s story before committing to a trade.
This patience—waiting for that confirmation candle—is what separates successful price action traders from those who act on impulse. Trading the Doji itself is a pure gamble; trading after confirmation is a calculated strategy.
Amplifying Signals at Key Zones
The real power of a Doji is unleashed when it appears at a pre-planned technical level. These "hot spots" are where we expect large pools of buy or sell orders to be sitting, making any sign of indecision incredibly meaningful.
- Support and Resistance: A Dragonfly Doji right on a major support level is a huge tell. It shouts that sellers tried to push price lower but were aggressively rejected by a wall of buyers.
- Moving Averages: Key moving averages, like the 50 or 200-day, often act as dynamic support or resistance. A Doji forming right on one of these lines tells you a significant battle is happening at a widely-watched level.
- Trendlines: When a Gravestone Doji forms at the upper edge of a well-defined bearish trendline, it powerfully reinforces the strength of that downward trend.
When you get a Doji pattern meeting up with one of these key levels, you have what we call a high-probability setup. For instance, some backtested scenarios on WTI crude oil showed that a Doji forming near the 200-day moving average led to a reversal confirmation over 70% of the time when combined with other factors. You can explore the full research on combining Doji patterns with key levels to get a deeper sense of this synergy.
Doji Interpretation Matrix
To simplify things, think of reading a Doji like using a map. Its location gives you clues about the terrain ahead and what to watch out for. This matrix is a straightforward guide for translating a Doji's position into a potential trading action.
| Doji Location | Potential Signal | Required Confirmation | Trader Action |
|---|---|---|---|
| Peak of an Uptrend | Bearish Reversal | Next candle is red and closes below the Doji's low. | Look for short entry opportunities. |
| Bottom of a Downtrend | Bullish Reversal | Next candle is green and closes above the Doji's high. | Look for long entry opportunities. |
| Near Strong Resistance | Bearish Rejection | A bearish candle closing below the resistance zone. | Consider a short trade or take profits on a long position. |
| Near Strong Support | Bullish Rejection | A bullish candle closing above the support zone. | Consider a long trade or cover a short position. |
This framework really drives home the point that a Doji is the beginning of a story, not the end. The final chapter is written by the candle that follows, giving you the green light to act with confidence. By mastering this kind of contextual analysis, you can learn to read the market’s subtle hints and position yourself for much higher-probability moves.
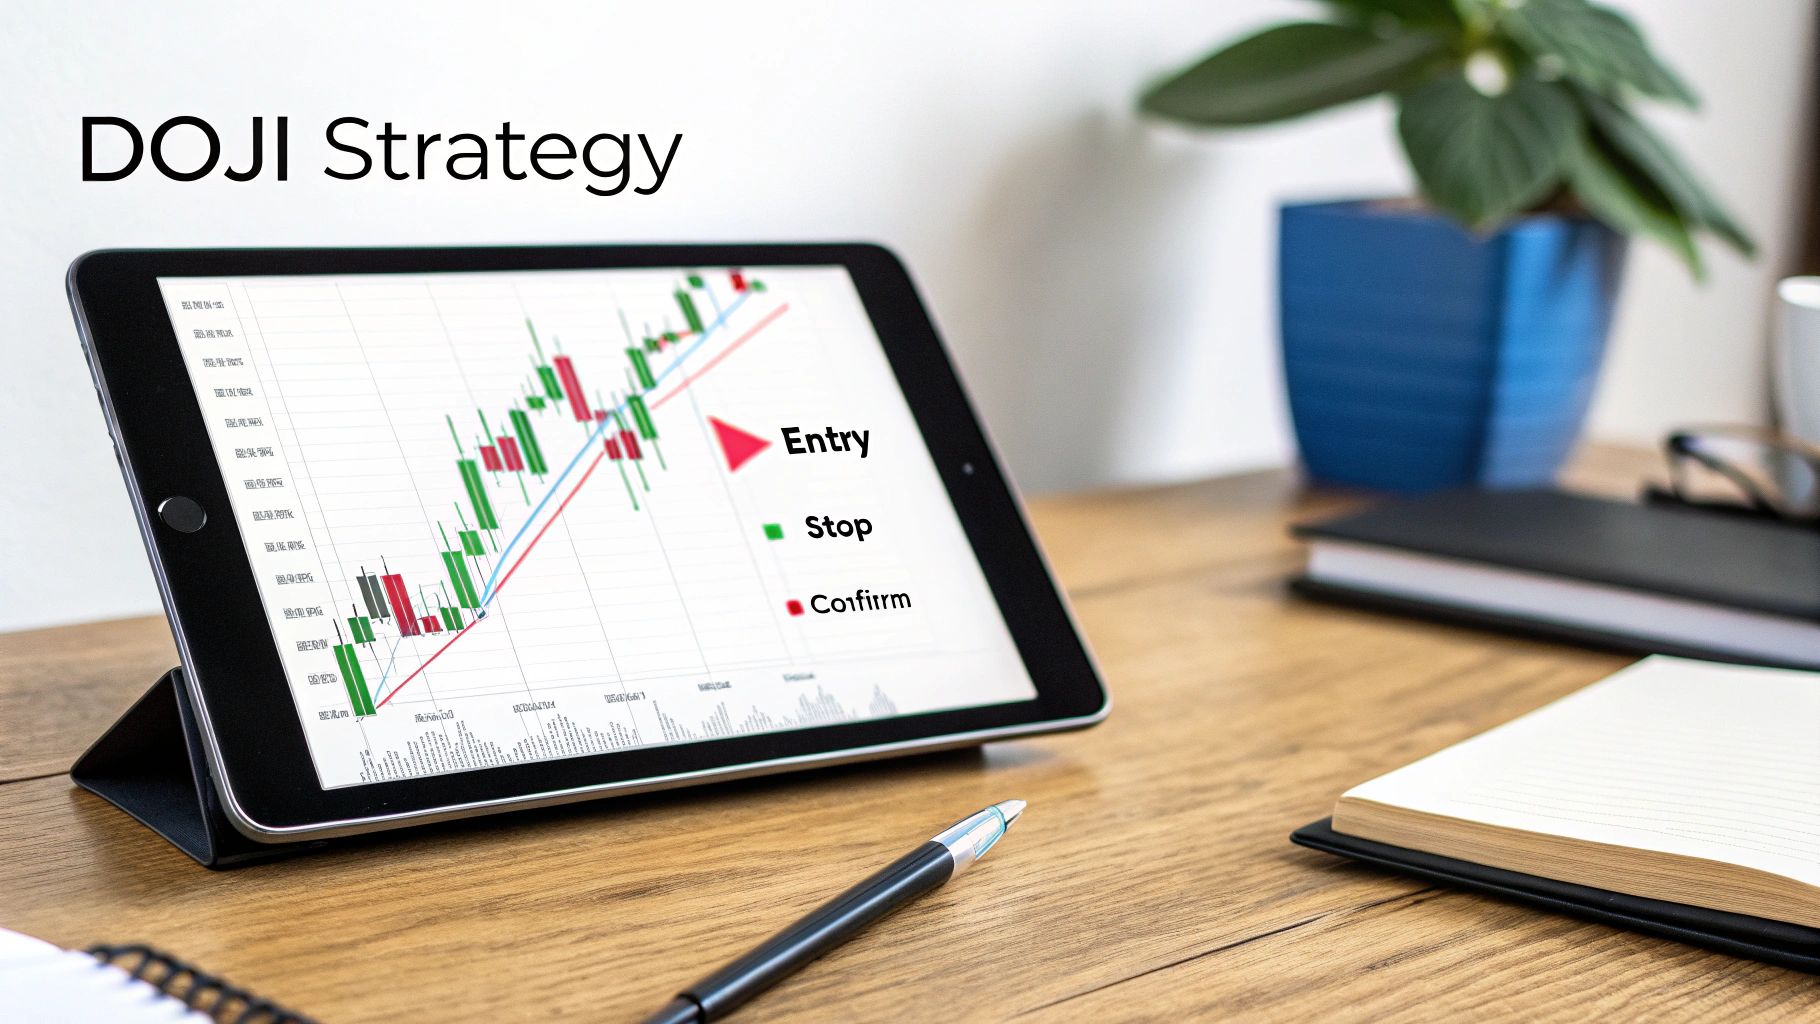
Building a Trading Strategy Around Doji Signals
Recognising a Doji is one thing, but actually profiting from it? That requires a clear, disciplined plan. Just seeing the pattern pop up on your chart isn’t enough to start clicking buttons. To turn this signal of indecision into a high-probability trade, you need a rule-based framework that dictates your every move—entry, exit, and especially risk management. This is how you turn a simple observation into real action.
The cornerstone of any good Doji strategy is patience. The signal itself is just a warning flare—the real trigger comes from the candle that follows it. Jumping the gun before this confirmation is just gambling, not trading. A disciplined trader waits for the market to validate the Doji’s message before putting any capital on the line.
Defining Your Entry and Exit Rules
A solid trading plan leaves zero room for guesswork. It gives you concrete answers for when to get in, where to place your safety net, and when to cash out.
1. The Entry Trigger
Your entry should always be based on the confirmation candle—the one that closes right after the Doji.
- For a bearish reversal (like after a Gravestone Doji): You'd only enter a short position after a red candle closes below the low of that Doji.
- For a bullish reversal (like after a Dragonfly Doji): You'd enter a long position only after a green candle closes above the high of the Doji.
2. Stop-Loss Placement
Risk management is absolutely non-negotiable. Your stop-loss is what saves you when a signal fails, and trust me, they can and will fail. Where you place it is crucial.
- For a short entry: Place your stop-loss just a few pips above the high of the Gravestone Doji. This is the exact point where the bearish signal is clearly proven wrong.
- For a long entry: Your stop-loss goes just below the low of the Dragonfly Doji. If the price breaks this level, the bullish idea is dead in the water.
Learning how to set a stop loss is one of the single most important skills you can develop. It’s what keeps you in the game by controlling your downside on every single trade.
3. Setting Profit Targets
Your profit targets need to be rooted in reality, based on the market structure you can see on the chart—not on wishful thinking. Find the next significant support or resistance level and make that your first target. This ensures you’re trading toward a logical price point where the market is likely to react again.
The goal is not just to find a Doji but to execute a complete trade plan around it. A successful strategy relies on the powerful alignment of the Doji signal, confirmation, and sound risk management rules.
This kind of structured approach takes emotion completely out of the equation. It forces you to be patient and wait for the highest-probability setups, where the what is a doji candle signal aligns with other technical factors to give you a clear edge. By building a concrete plan, you move from just spotting patterns to systematically trading them.
Avoiding Common Mistakes When Trading Doji Candles
While a Doji can be a fantastic signal, it’s also a magnet for costly trading mistakes. Honestly, understanding what not to do is just as important as knowing how to trade them. The most common pitfall I see is traders treating a Doji like a crystal ball that guarantees a reversal.
Too many traders spot a Gravestone Doji after a nice uptrend and immediately smash the "sell" button. More often than not, they get steamrolled as the price continues its march upward. This happens because they're trading the pattern in isolation, forgetting the most critical rule of all: a Doji is a signal of indecision, not a command to act.
Acting Without Confirmation
The single biggest mistake is pulling the trigger on a trade before the next candle closes. Think of the Doji as a question the market is asking. The candle that follows is the answer. Acting before you get that answer is just pure gambling.
Here are the most common traps to sidestep:
- Trading in Choppy Markets: In a sideways, low-volume meat grinder of a market, Dojis pop up all the time and mean next to nothing. They just confirm the obvious—that there's no direction. They are best ignored.
- Ignoring the Broader Trend: A bullish Dragonfly Doji is far less reliable when it appears in a powerful, long-term downtrend. Context is king. A single candle rarely has enough power to reverse a major trend all by itself.
- Treating It as a Mechanical Signal: Relying on a Doji without considering key support and resistance levels is a recipe for disaster. A Doji only gains its real power when it forms at a significant price zone where buyers or sellers have previously stepped in.
A Doji candlestick pattern signals a potential change, but it’s the price action that follows which confirms it. Patience isn't just a virtue in trading; it’s a core component of your profitability.
Research actually backs this up. A 2022 study using neural networks found that while Dojis could be identified with high accuracy, their predictive power in isolation was surprisingly weak. Their directional accuracy rarely got better than 60-65% without extra context, which proves they're most valuable as part of a larger confluence of signals. You can read more about these findings on candlestick pattern analysis to dig into the data.
Failed Signals Are Your Best Teachers
Every trader has war stories of "failed" Doji signals. Instead of getting frustrated, you need to see these moments as invaluable lessons from the market.
When a Doji doesn't lead to the move you expected, analyze why. Was the market in a low-volume holiday session? Did you wait for a confirmation candle? Was the pattern fighting against a freight train of an underlying trend?
By dissecting these instances, you train your eyes to recognize the high-probability setups and, just as crucially, develop the discipline to ignore the noisy, unreliable ones. This realistic perspective, combined with strict risk management, is what separates consistently profitable traders from those who chase every fleeting pattern they see.
Got Questions About Doji Candles?
Working through candlestick patterns always brings up a few questions. That's a good thing—it means you're thinking like a trader. This section will tackle some of the most common things people ask about the Doji, helping to lock in what we've already covered.
Think of it as a quick cheat sheet to sharpen your understanding before you start spotting these powerful little candles on your own charts.
Is a Doji Always a Reversal Signal?
Absolutely not, and this is probably the most important thing to remember. A Doji isn't a reversal signal—it's an indecision signal. It's a snapshot in time where buyers and sellers fought to a perfect standstill.
Now, if that standstill happens at the top of a massive, overextended uptrend, it can absolutely be the first clue that the trend is running out of gas. But in a choppy, sideways market? A Doji is just more of the same—it's noise confirming the existing lack of direction.
My golden rule is simple: always wait for confirmation. A Doji is a hint from the market, not a conclusion. Let the next candle show you who won the fight before you even think about placing a trade.
What’s the Difference Between a Doji and a Spinning Top?
The only real difference comes down to the body. A true Doji has practically no real body at all; the open and close are almost the exact same price, so it looks like a cross or a plus sign.
A Spinning Top, on the other hand, has a small but noticeable real body. Both signal indecision, no doubt about it. But I like to think of a Spinning Top as a whisper of indecision, while a classic Doji is a much louder, clearer statement that the market is completely balanced on a knife's edge.
Which Timeframe Is Best for Trading Doji Patterns?
Dojis become dramatically more reliable on the higher timeframes. A Doji on a daily, weekly, or even a 4-hour chart carries serious weight. Why? Because it represents a full session of battle between bulls and bears ending in a draw, involving a much larger pool of money and participants.
You’ll see Dojis pop up all the time on a 1-minute or 5-minute chart. More often than not, they’re just meaningless market noise. Sticking to the higher timeframes helps you filter out the fluff and focus only on the signals that have a real story to tell.
Ready to stop relying on confusing indicators and master the art of price action? At Colibri Trader, we provide straightforward, action-based programs designed to help you profit in any market. Discover your trading potential with our free quiz today!