


Trendline Trading Strategy: Real Tactics That Actually Work
Understanding What Makes Trendlines Actually Work
Lots of traders seem to think trendlines are some kind of magical line on a chart with the power to predict the future. The truth is way more practical: a good trendline is just a visual cheat sheet for what the market is thinking. It shows the collective actions of buyers and sellers, which is why it's a cornerstone of any solid trendline trading strategy. When enough traders, especially the big institutional players, see and act on the same diagonal level, that line suddenly matters. It becomes a self-fulfilling prophecy, not because of some secret formula, but because of shared psychology.
This is why you have to understand the "why" behind the line. A trendline does more than just connect a couple of dots; it shows you the live-action battle between supply and demand. In an uptrend, a line under the lows highlights where buyers have consistently shown up with more muscle than sellers, driving prices up. In a downtrend, a line above the highs shows where sellers have been in control. The real skill is figuring out which of these battle lines are important to the whole market and which are just random noise.
The Psychology Behind Support and Resistance
So, what makes traders respect these lines anyway? It all comes down to the two emotions that really drive financial markets: fear and greed. A trader might see the price coming down to a well-known uptrend line and decide to buy, driven by the fear of missing out (FOMO) on the next leg up. At the same time, traders who were short-selling might see that same line as the perfect spot to take their profits, which also adds to the buying pressure. This pile-on of activity is what creates the "bounce" that makes the trendline look valid.
This dynamic is exactly why the trendline trading strategy is one of the oldest and most consistently effective methods in technical analysis. Its strength is in its simplicity and how directly it reflects what the market is feeling. Price action studies have shown that strategies based on bounces from these dynamic levels can be quite profitable. This is especially true when you combine them with confirming candlestick patterns like a pin bar or an engulfing pattern. You can dig deeper into the backtested results of these kinds of strategies through various trading research papers.
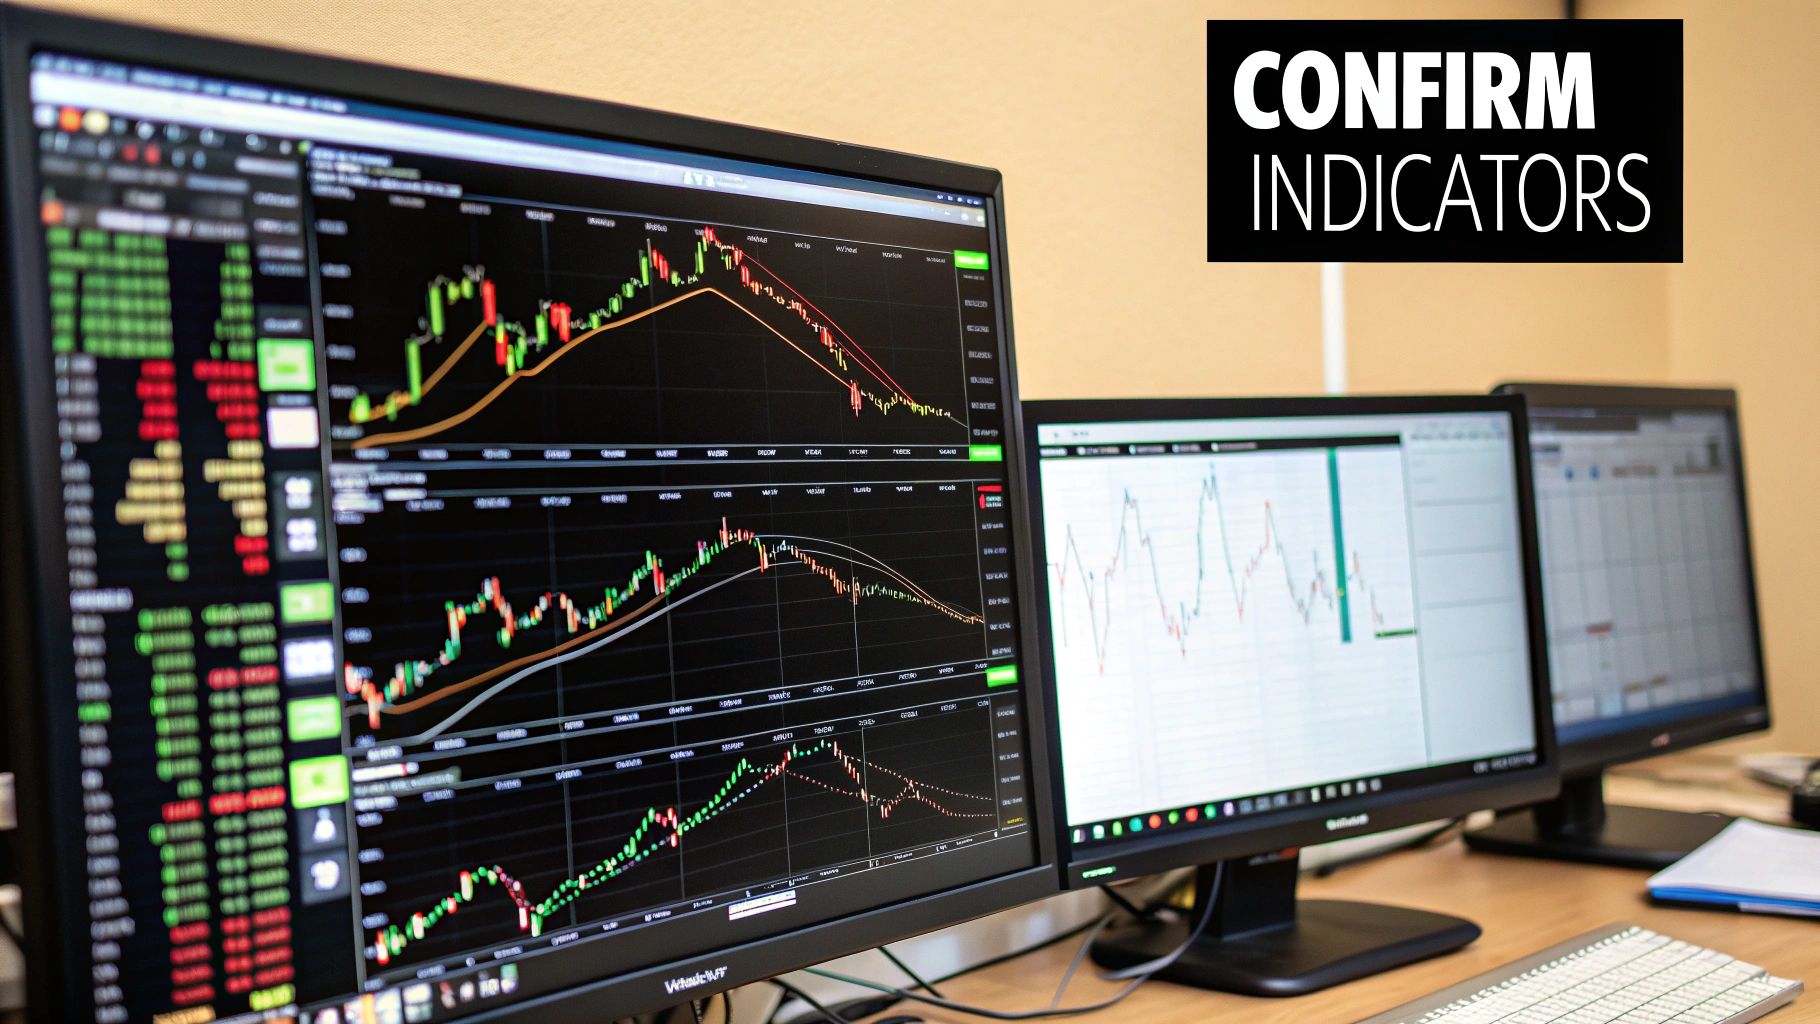
Visualizing the Market's Story
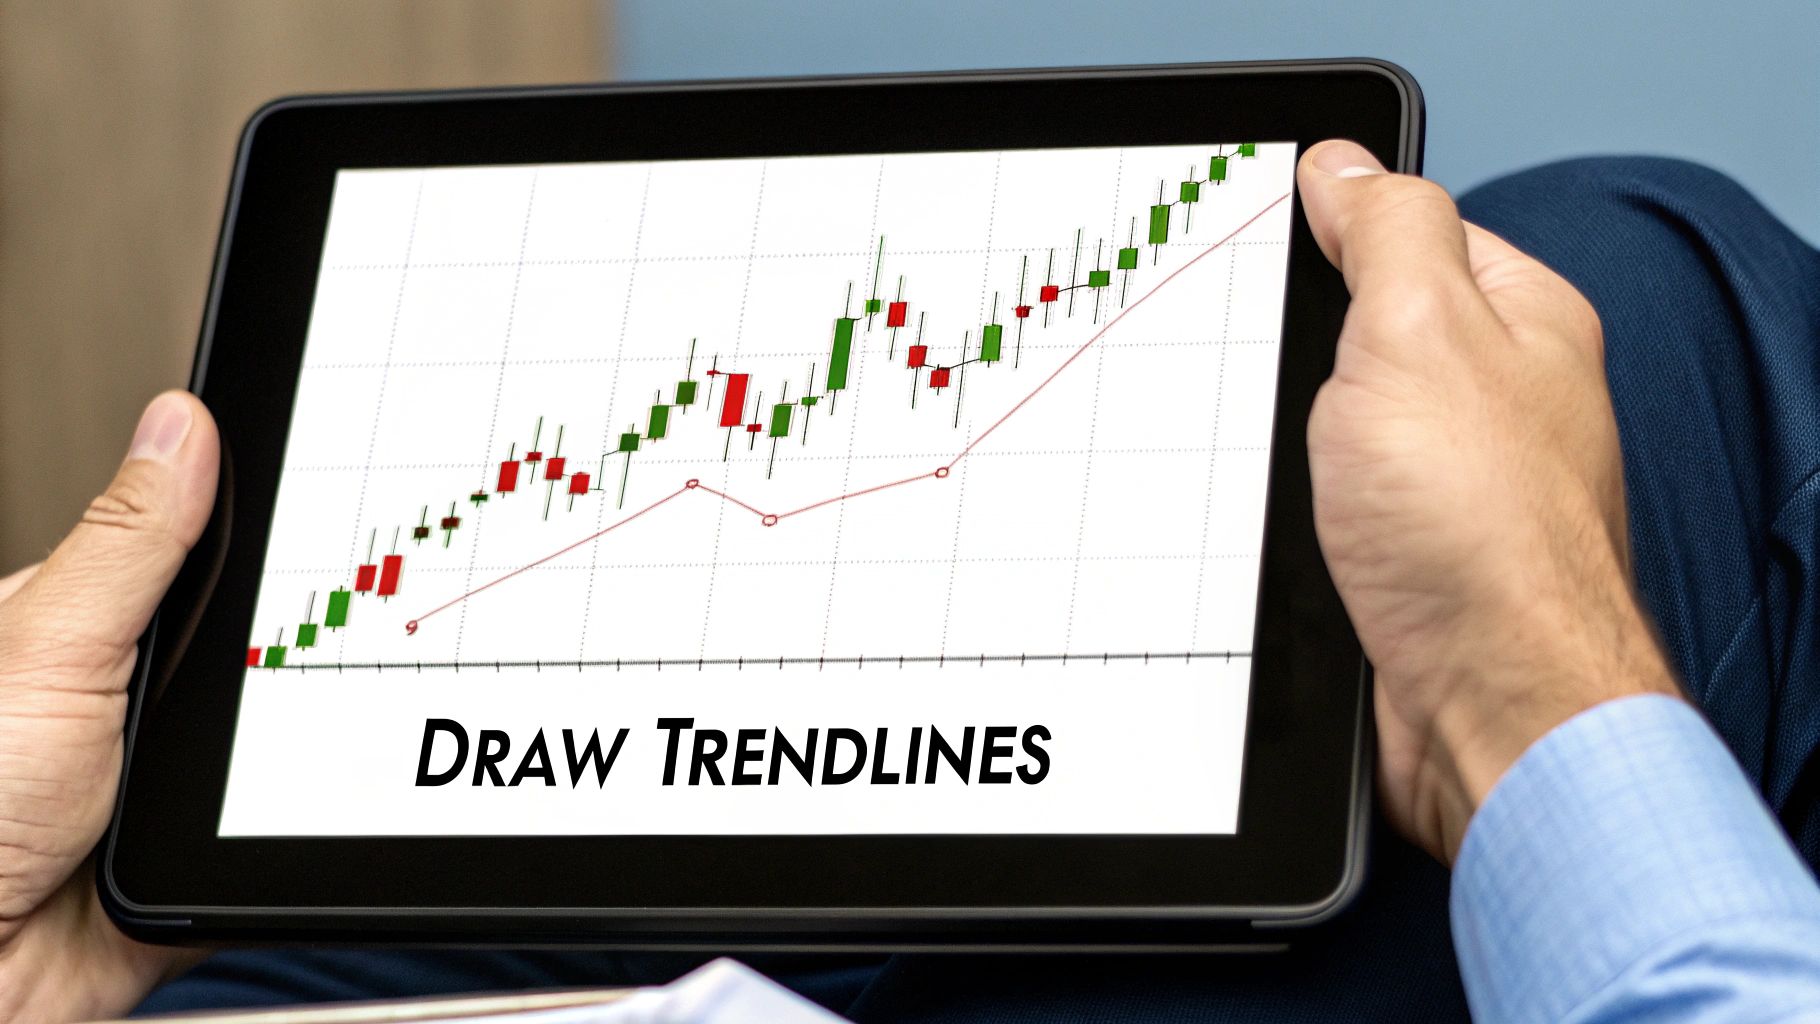
A chart isn't just a bunch of data points; it tells a story about the market's structure. A trendline is like the chapter heading. Take a look at this classic example of how trendlines frame the price action.
This image perfectly shows how a downtrend line acts like a ceiling, stopping every rally until a powerful breakout finally happens. The most successful traders I know don't just draw lines—they read the story. They ask questions like, "Are the bounces getting weaker?" or "Is volume picking up as we test the trendline?" Finding the answers to these questions helps you tell the difference between a simple test of the line and a major, trend-changing event.
Drawing Trendlines That Markets Actually Respect
Let's get one thing straight: anyone can slap a line on a chart. But drawing a trendline that the market actually acknowledges and reacts to? That's a completely different skill. One of the biggest hurdles for developing traders is connecting random highs and lows, creating lines that look good but have no real meaning. A solid trendline trading strategy begins with identifying swing points that carry genuine market weight.
So, how do you spot these significant points? Forget just connecting the most obvious wicks. Instead, look for the pivots that triggered a clear, powerful shift in direction. These are the moments where you can see control decisively flip from buyers to sellers, or the other way around. When you connect these key turning points, you're not just drawing a line; you're mapping the market's real structural support or resistance. For a more detailed breakdown of the mechanics, you can check out this guide on how to draw a trendline.
The Three-Touch Rule for Validation
A line connecting two points is just a starting point. It’s when price respects that line a third time that it becomes a validated trendline you should pay close attention to. This is a core principle many seasoned traders rely on. Each subsequent touch—whether it's the third, fourth, or fifth—reinforces its importance in the minds of other market participants. The more touches a trendline gets, the more traders are watching it, which in turn increases its predictive power.
This isn't just theory; the data backs it up. Professional traders using trendline analysis consistently look for at least three pivot points to consider a trendline confirmed. Backtesting studies show that breakouts from these validated trendlines can forecast market moves with success rates often between 60% and 70%, though this can vary with market conditions. You can find more insights on trendline reliability on platforms like Investopedia. This validation step is what separates a hopeful line from a level that is actively shaping trading decisions.
To help you distinguish a weak line from a strong one, it's useful to have a clear set of criteria. The table below outlines what to look for when validating your trendlines.
| Criteria | Minimum Requirement | Ideal Standard | Red Flags |
|---|---|---|---|
| Number of Touches | At least 2 distinct pivots to initially draw the line. | 3 or more confirmed touches, with price reacting cleanly. | A single touch or points that are too close together. |
| Pivot Significance | Touches should be clear swing highs or swing lows. | Touches represent major market turning points with strong momentum shifts. | Connecting minor wiggles or insignificant price fluctuations. |
| Line Angle | Not excessively steep (over 60 degrees) or too flat. | A moderate angle (around 30-45 degrees) suggesting a sustainable trend. | A vertical-looking line (unsustainable) or a nearly horizontal line (ranging). |
| Timeframe Consistency | The trendline is visible and respected on your primary trading timeframe. | The trendline holds significance across multiple timeframes (e.g., Daily and 4-Hour). | The line only "works" on a very low timeframe and disappears on higher ones. |
Ultimately, having a checklist like this helps you build confidence in the levels you're trading. It ensures the trendlines on your chart are based on objective market behavior, not just wishful thinking.
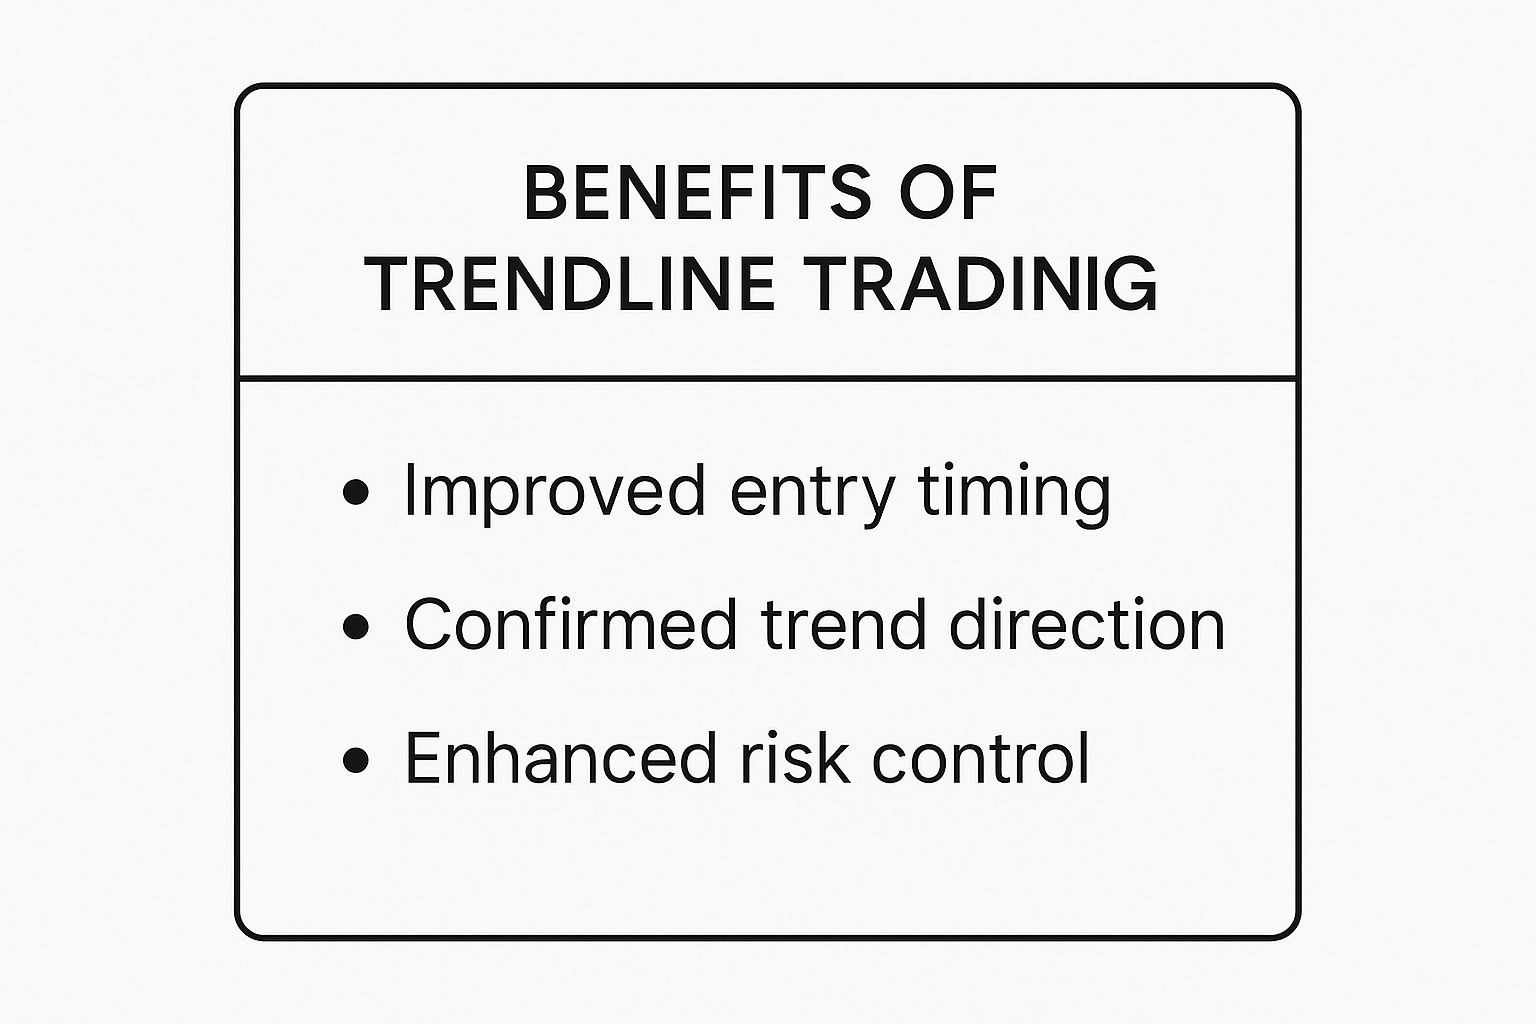
The benefits of drawing a proper trendline are immense. It helps you refine your entry timing, get confirmation of the prevailing trend, and apply much tighter risk control. These elements combine to provide a solid framework for your trading, shifting you from making random guesses to executing calculated decisions based on levels the market truly respects.
Spotting High-Probability Entry Signals
A solid, validated trendline is a fantastic starting point, but it's not a complete trendline trading strategy by itself. The real skill is telling the difference between a weak, indecisive bounce and a powerful rejection that screams "high-quality entry." I like to think of the trendline as the stage; you still need to wait for the main event—strong price action—before making your move. Just buying every time the price nudges an uptrend line is a quick way to get chewed up by market noise.
I always wait for a few things to line up. A simple touch of the trendline is just an alert, a heads-up. The real signal is in how the price reacts. Does it poke the line and get smacked down with force? Or does it meander toward it, hang out for a while, and show no real desire to go anywhere? That difference is crucial. A strong rejection often leaves behind a clear candlestick pattern, giving me the final confirmation I need to enter a trade.
Reading the Price Action Clues
Specific candlestick patterns forming at a key trendline are like getting a sneak peek at what the market is thinking. They can seriously boost the probability of your trade working out. I have a few favorite patterns I always watch for:
- Pin Bars: A pin bar (you might also hear it called a hammer or shooting star) with a long tail rejecting the trendline is a classic, powerful signal. That long wick shows that the price tried to break through the level but was forcefully pushed back by opposing pressure. The longer that wick, the stronger the rejection.
- Engulfing Candles: Seeing a bullish engulfing pattern at an uptrend line is a fantastic sign. This is where a big green candle completely swallows the previous red one, showing a sudden and dramatic shift in control. The buyers just steamrolled the sellers right at that critical spot.
- Volume Spikes: Did the trading volume jump up right as the price hit the trendline and reversed? A spike in volume on that rejection candle confirms there was a lot of money and conviction behind that move, making it much more reliable. It’s like hearing a massive cheer from the crowd, validating the play on the field.
To help you visualize these signals, here’s a quick comparison of what I look for, how often it tends to work out, and the market conditions where each signal shines.
Trendline Trading Signals Comparison
| Signal Type | Success Rate | Best Market Condition | Risk Level | Profit Potential |
|---|---|---|---|---|
| Pin Bar Rejection | High (~75%) | Strong, established trends | Medium | High |
| Engulfing Candle | Very High (~80%) | Volatile, trending markets | Low | Very High |
| Simple Touch (No Confirmation) | Low (<50%) | Choppy or ranging markets | High | Low |
| Rejection with Volume Spike | Very High (~85%) | Any trending market | Low | Very High |
As you can see, waiting for a confirming signal like a pin bar or an engulfing candle dramatically improves your odds compared to simply trading a touch. The addition of a volume spike provides the highest level of confirmation, signaling major market participation.
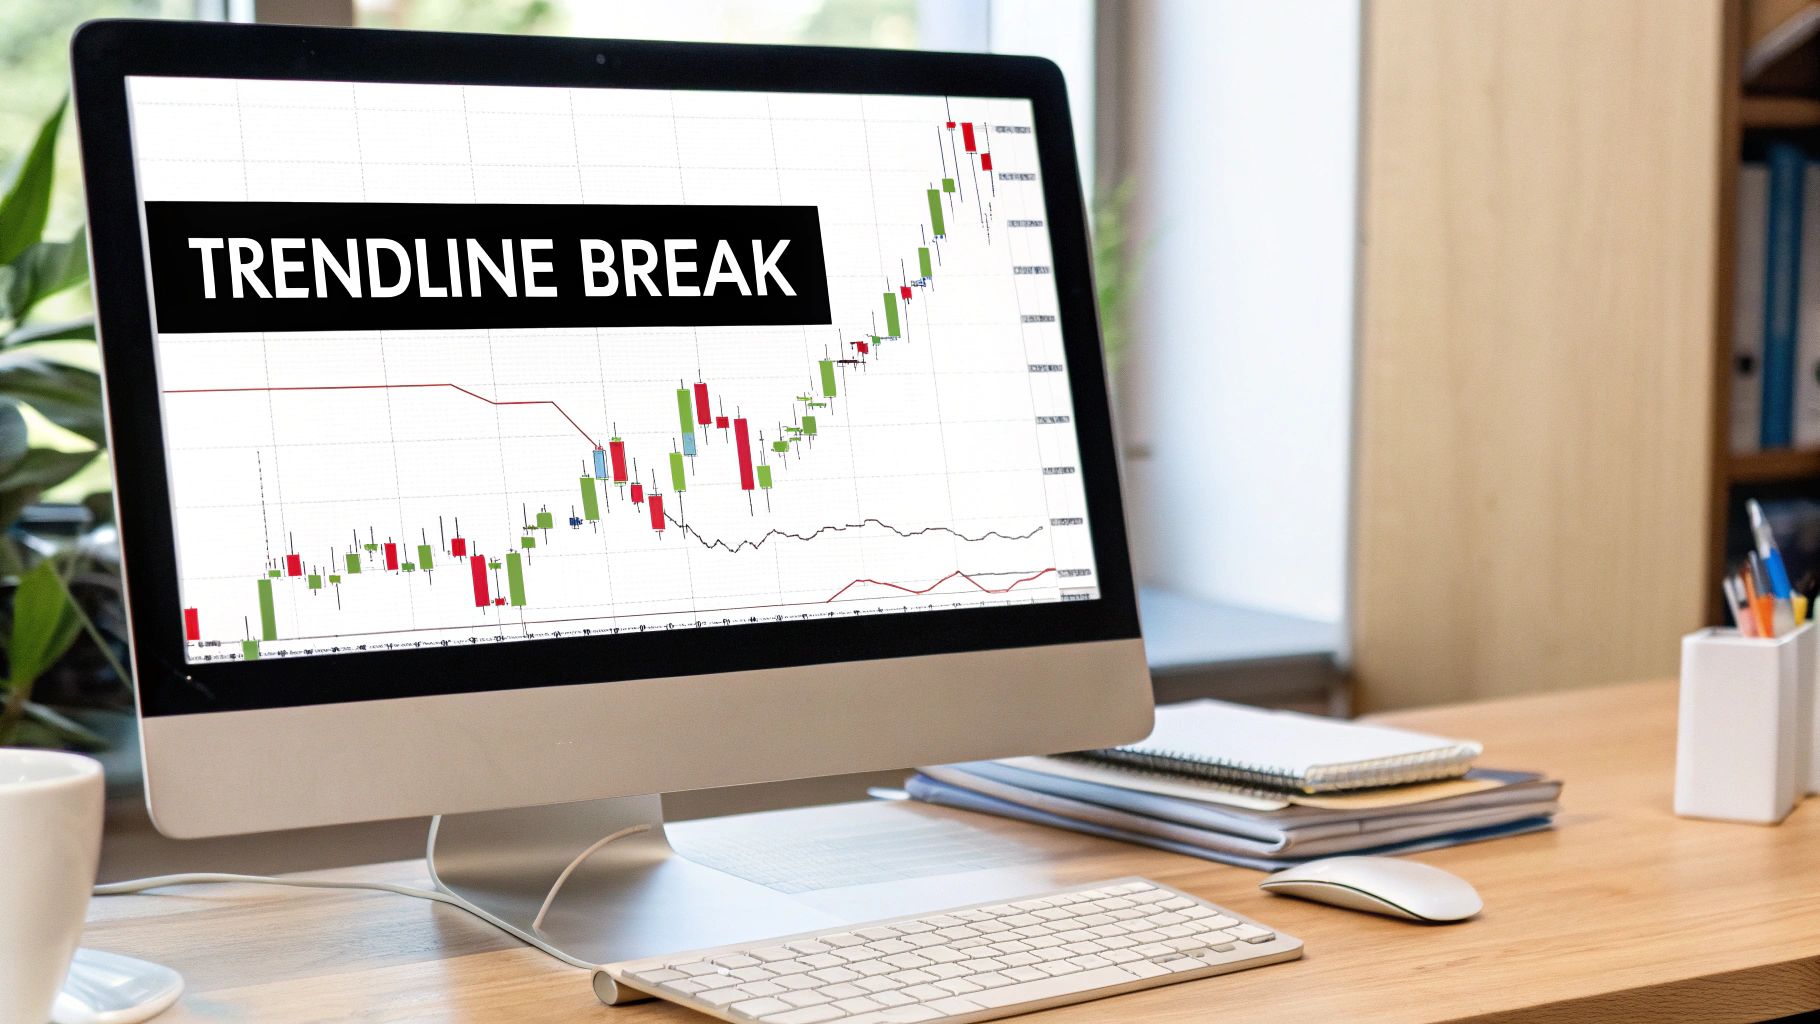
Let's look at a chart from TradingView to see this in practice. The chart below has a clear uptrend line that has been respected multiple times.
Look closely at that chart. The best entry wasn't just any random touch. It was the one that formed a perfect pin bar, signaling a powerful rejection by buyers at that dynamic support level. This mix of location (the trendline) and specific price action (the pin bar) is what creates a high-probability setup. Having the discipline to wait for this confluence is what separates traders who react on impulse from those who trade with a plan. By stacking these confirmations, you're not just trading a line on a chart; you're trading a clear story of market conviction.
Protecting Your Capital When Trendlines Fail
Even the most picture-perfect setup in a trendline trading strategy can—and will—fail. How you manage these unavoidable losses is what separates traders who stay profitable from those who blow up their accounts. The goal isn't just about maximizing winners; it's about protecting your capital from the losers so you can live to trade another day. This all comes down to smart risk management, especially how you place your stop-loss orders.
A classic mistake I often see is placing a stop loss exactly on the trendline. On the surface, it seems logical, but it's a move that experienced traders avoid. Why? Because market makers and algorithms know that's where retail traders cluster their stops. Prices will often spike just past a key level to trigger those orders—a "stop hunt"—before reversing and heading in the direction you originally predicted.
To keep from getting shaken out, always give your trade some breathing room. Place your stop loss a little beyond the trendline, typically on the other side of the candlestick pattern that signaled your entry. For instance, if you entered on a bullish pin bar that touched an uptrend line, your stop should sit just below the low of that pin bar's tail.
Smart Stop Placement and Position Sizing
Where you set your stop loss is just one piece of the puzzle; how much you risk on the trade is just as important. Your position size should never be static. Instead, adjust it based on your stop-loss distance and current market volatility. A wider stop requires a smaller position size to risk the same percentage of your account, which should usually be between 1-2%.
This leads us to the critical concept of the risk-to-reward ratio. A successful trendline strategy doesn't mean you have to win every single trade. In fact, many consistently profitable traders have win rates under 50%. They succeed because their winning trades are substantially larger than their losing ones. A solid rule of thumb is to only consider trades that offer at least a 2:1 risk-to-reward ratio. This means for every dollar you risk, you have a realistic chance to make at least two.
Here’s a chart that shows how to place a protective stop in relation to an entry signal and trendline.
The image illustrates a trade where the stop loss is smartly positioned below the recent swing low. This provides a buffer against market noise, rather than being placed right on the trendline itself. This discipline ensures that a minor, temporary dip doesn’t kick you out of a potentially great trade too early. If you want to take a deeper dive into this, you can learn more about managing trading risk in our detailed guide.
The Psychology of Cutting Losses
Finally, we have to talk about the mental game, which is often the hardest part. You must develop the discipline to honor your stop loss without a second thought. If the price breaks a trendline and hits your stop, the trade is over—period. Don't start dragging your stop further down, hoping for a miraculous turnaround. That’s emotional trading, and it’s a quick way to empty your account.
Accept the small loss, see what you can learn from it, and patiently wait for the next high-probability setup to appear. Remember, your number one job as a trader is to protect your capital.
Advanced Techniques For Consistent Profits
Once you have a good handle on drawing basic trendlines and finding entry signals, it’s time to add more depth to your analysis. A trendline trading strategy that brings in consistent profits isn't just about simple bounces. It involves using more advanced ideas to filter out market noise and identify setups with a higher probability of success.
One of the most effective techniques is multi-timeframe analysis. Before you jump into a trade on your main chart, say the 4-hour, take a moment to zoom out to the daily chart. Is the trendline you're watching on the 4-hour chart moving in the same direction as the dominant daily trend? Making sure your trades are in sync with the larger market flow can be a real game-changer. This bigger-picture perspective helps you avoid "counter-trend" traps, where you might unknowingly be fighting against a much stronger market force.
Another powerful addition to your toolkit is the trend channel. A channel is created by drawing a parallel line to your main trendline, which forms a corridor where the price often moves. This simple addition changes your trendline from just a floor or ceiling into a more dynamic map, giving you clear potential price targets. For example, if the price bounces off the lower trendline in an uptrend channel, the upper channel line becomes a logical place to consider taking profits.
Combining Trendlines With Other Tools
As powerful as trendlines can be on their own, they become much more reliable when you pair them with other forms of analysis. When different signals point to the same conclusion, it’s known as confluence, a practice that many professional traders rely on. A trendline that lines up perfectly with a key Fibonacci retracement level, for instance, carries a lot more weight than a trendline that's just floating by itself. This layering of evidence builds more confidence in your trade setups.
Technical indicators can also offer excellent confirmation. Imagine you see a bullish divergence on an oscillator like the RSI right as the price is testing a major uptrend line. This could be a strong signal that the downward momentum is wearing out and a reversal is likely. To get a better feel for which tools work well together, our guide on the 7 best trend indicators is a fantastic starting point. You don't need to overload your chart, but one or two confirming tools can make a significant difference.
Here is a chart showing a trendline channel in action, providing clear boundaries for price movement.
The screenshot above clearly shows how the price respects both the primary support trendline and the upper channel line, offering predictable areas for both entries and profit-taking.
Adapting to Different Markets
Finally, it's important to remember that not all markets behave the same way. A trendline strategy that works beautifully in the Forex markets, which tend to have cleaner technical patterns, might need some tweaks for the wild swings of cryptocurrencies. Crypto markets are known for more aggressive price movements and frequent "false breakouts."
When trading more volatile assets like crypto, you might need to adjust your approach. This could mean using wider stop losses to avoid getting knocked out of a trade prematurely or focusing on trendlines on higher timeframes (like the daily or weekly) to filter out the intraday noise. The core principles of trendline trading remain the same, but your execution and risk management must adapt to the unique personality of the asset you're trading. Mastering these advanced techniques will elevate your trendline trading from a simple method to a truly adaptable and consistent strategy.
Learning From Real Trades And Market Examples
Theory and textbook charts are great for understanding the basics, but the real learning happens when you see a trendline trading strategy unfold in a live, unpredictable market. Let's step away from the perfect diagrams and look at some real trade scenarios. We'll examine both winners and losers to see what really makes a setup work—or fail. My own trading education truly began when I started analyzing real price action, not just sterile illustrations.
The Anatomy of a Winning Trade
Picture a stock that's been in a solid uptrend for a while. You can draw a clean trendline that connects three key swing lows over the past few weeks. Now, as the price comes down to test this line for the fourth time, something interesting happens. The price briefly pokes below the trendline, but then buyers rush in aggressively, pushing the price back up to close the day well above the line. This forms a perfect bullish pin bar.
So, what turned this into a high-probability entry?
- Established Trend: The trade was going with the flow, not against it. The dominant momentum was clearly upward.
- Validated Level: The trendline wasn't just a guess; the market had already proven its importance by respecting it multiple times.
- Confirmation Signal: The pin bar was the final piece of the puzzle. It showed a powerful rejection of lower prices, signaling that buyers were back in control.
- Risk Management: By placing a stop-loss just below the low of that pin bar, the risk was clearly defined. The potential profit, aiming for the previous swing high, offered a reward of more than 3:1.
When all these factors line up, a simple trendline touch becomes a powerful trading opportunity. It's a great example of how patience and waiting for clear confirmation can stack the odds in your favor.
Learning from a Losing Trade
Now, let's dissect a losing trade, because that's where some of the most important lessons are learned. Imagine a currency pair that's been moving sideways, stuck in a choppy range with no clear direction. A trader spots a minor, short-term downtrend line and decides to go short when the price touches it for a third time.
The problem? The rejection is weak. The candles are small and indecisive, showing no real selling pressure. Soon after entering the trade, the price just chops around before suddenly surging upward, blowing past the trendline and stopping the trader out for a loss.
The big mistake here was ignoring the bigger picture. A trendline trading strategy thrives in trending markets. Trying to force it in a directionless, range-bound market is a classic way to get whipsawed. The weak rejection signal should have been a major red flag, screaming that sellers had no real power at that level. This loss offers a vital lesson: the market's overall condition is more important than any single pattern. Ignoring the context is how a decent-looking setup can quickly become an expensive, avoidable mistake.
Your Practical Trendline Trading Blueprint
Let's put all the pieces together into a practical approach you can actually use for your next trade. A solid trendline trading strategy isn't just about drawing a line on a chart; it's about having a clear, repeatable process from beginning to end. Think of this blueprint as your personal checklist, designed to keep your decision-making objective and steer you away from emotional reactions. This is the framework that helps you stay consistent, no matter what the market throws at you.
This whole process kicks off way before you even think about clicking "buy" or "sell." It starts with a calm, methodical look at the chart to build a solid case for a potential trade.
The Pre-Trade Checklist
Before you risk even a single dollar, it's crucial to run through these checkpoints. If you can't confidently give a "yes" to each of these questions, it's probably best to sit on your hands and wait for a clearer opportunity to come along.
- Is the Market Actually Trending? First things first, zoom out. Look at a higher timeframe. Is there an obvious, dominant direction? A trendline strategy works best when you’re swimming with the current, not trying to fight against it.
- Has the Trendline Been Validated? Have you connected your line through at least three significant swing points? A line with just two touches is still just a guess. That third touch is confirmation that other traders are watching and reacting to the same level.
- Is There a Clear Confirmation Signal? Don't just trade the instant the price touches the line. Be patient and wait for a convincing price action signal. A strong pin bar or a powerful engulfing candle shows that the market is genuinely rejecting the level and ready to move.
- Is the Risk-to-Reward Worth It? Before you even think about entering, you need to know where your stop-loss will go and what a logical profit target looks like. As a rule of thumb, the potential reward should be at least twice your potential risk. If the numbers don't stack up, the trade simply isn't worth taking.
Managing the Trade and Learning from Results
Once you're in a trade, your role switches from analyst to manager. The most important thing now is to stick to your plan. If the price hits your stop loss, you take the small loss and move on. If the trade goes your way, you can think about trailing your stop to protect your profits as they grow.
After the trade is closed—whether it's a win or a loss—the most important step begins: the review. This is where real growth happens. Keep a detailed trading journal to log your setups, why you entered, and what the outcome was. Over time, you’ll start to see patterns in what works for you and what doesn't. This constant feedback loop of trading, reviewing, and refining is the true secret to long-term success.
This blueprint isn't just a collection of rules; it's a road map for building discipline. Are you ready to build a trading approach based on proven price action instead of a mess of confusing indicators? See how our focused strategies can bring clarity and confidence to your trading. Take the first step by exploring the Colibri Trader methodology.