


Master Trading the Trend: Strategies for Consistent Success

Trading the trend is just what it sounds like: you figure out which way the market is moving and place your trades in that same direction. The whole philosophy is built on a simple, time-tested idea—an object in motion tends to stay in motion. It’s all about capturing profits from those long, sustained runs, whether they're heading up or down.
Riding The Market's Momentum

Think of it like being a surfer. A good surfer doesn't try to predict where the next perfect wave will form out of thin air. Instead, they sit patiently, watching the ocean, ignoring the small, choppy stuff. When a real swell starts to build, that's when they act—paddling hard to catch it and ride its power for as long as it lasts.
That's the heart of trading the trend. You're not trying to be a fortune teller calling exact market tops and bottoms. You're a momentum surfer, aligning yourself with the powerful, established flow of the market.
This whole guide is based on one of the oldest sayings in finance: "the trend is your friend." It's a strategy that favors observation over prediction. Forget getting tangled up in confusing financial news or trying to guess every tiny price wiggle. A trend trader keeps their focus on one critical question: which way is the market actually moving right now? Answering that one question simplifies everything.
Why Following The Trend Works
The logic here is pretty straightforward and comes down to market psychology. Once a stock or asset starts to move decisively, it grabs attention. Prices going up attract more buyers, which in turn pushes prices even higher. It's a self-feeding loop that can create powerful trends lasting for weeks, months, or even years. Your job is to spot these moves, get in for the main part of the ride, and get out before it runs out of steam.
This approach brings some huge advantages to the table, especially if you're looking for a more structured way to trade:
- It clears things up. The guesswork is gone. You have a simple framework: buy in an uptrend, sell (or short) in a downtrend.
- You can catch big moves. By riding a sustained trend, you position yourself for significant gains that can easily dwarf the small losses from the trades that don't pan out.
- It's less stressful. You stop fighting the market's main force and start flowing with it. That alone can make trading a lot less of an emotional rollercoaster.
The goal of a successful trader is to make the best trades. Money is secondary.
When you focus on a solid process like trading with the trend, profits become the natural result of a well-executed strategy. You're no longer just chasing the money.
This guide will be your roadmap. We’ll cover everything from spotting a trend with simple tools to managing your risk like a pro. Let's cut through the jargon and get down to a practical, repeatable way of trading.
How To Identify The Three Market Trends
Before you can even think about trading a trend, you first have to see it clearly on a chart. It sounds simple, but this is the foundational skill that separates disciplined traders from those who are just guessing.
At any given moment, every market is in one of three possible states. Think of it like a landscape. Are you climbing a mountain, walking down into a valley, or crossing a flat, open plain? Your first job as a trader is to answer that question correctly. Everything else you do will flow from that initial read of the market.
The Mighty Uptrend
An uptrend is the easiest direction for most people to spot. Picture yourself climbing a staircase—you take a step up, pause on a landing, and then take another step up. That’s an uptrend in a nutshell.
Technically, it's defined by a series of higher highs (HH) and higher lows (HL). Each new price peak pushes beyond the last one, and every little dip or pullback finds its footing at a level higher than the previous dip. This stair-step pattern is a clear signal that buyers are in charge, consistently driving prices higher despite those temporary pauses.
The Dominant Downtrend
On the flip side, a downtrend is like walking down that same staircase. The price takes a step down, levels out for a bit, and then continues its journey lower. This market state is marked by a series of lower highs (LH) and lower lows (LL).
In this kind of market, every attempt to rally falls short of the previous peak, and each wave of selling drags the price to a new low. A consistent pattern of lower highs and lower lows tells you that sellers have seized control, pushing the asset's value down over time. When you're trading with the trend here, you're looking for clean spots to sell or short.
The market is a device for transferring money from the impatient to the patient. A trend trader's patience lies in waiting for the trend to clearly establish itself before acting.
The Sideways Range
The third state of the market is the sideways range, which traders often call a consolidation period or a "trendless" market. This is when the price just bounces back and forth between a solid floor (support) and a ceiling (resistance).
You won't find a clear sequence of higher highs and higher lows, nor will you see a pattern of lower highs and lower lows. The price action just looks choppy and directionless. This is the market taking a breather, trying to figure out where it wants to go next. For a trend trader, this is usually a signal to sit on your hands and wait. Trying to force a trend trade in a sideways market is like trying to sail a boat with no wind—you’ll just get frustrated and go nowhere.
This simple diagram breaks down what a trader looks at to figure out the market's direction.
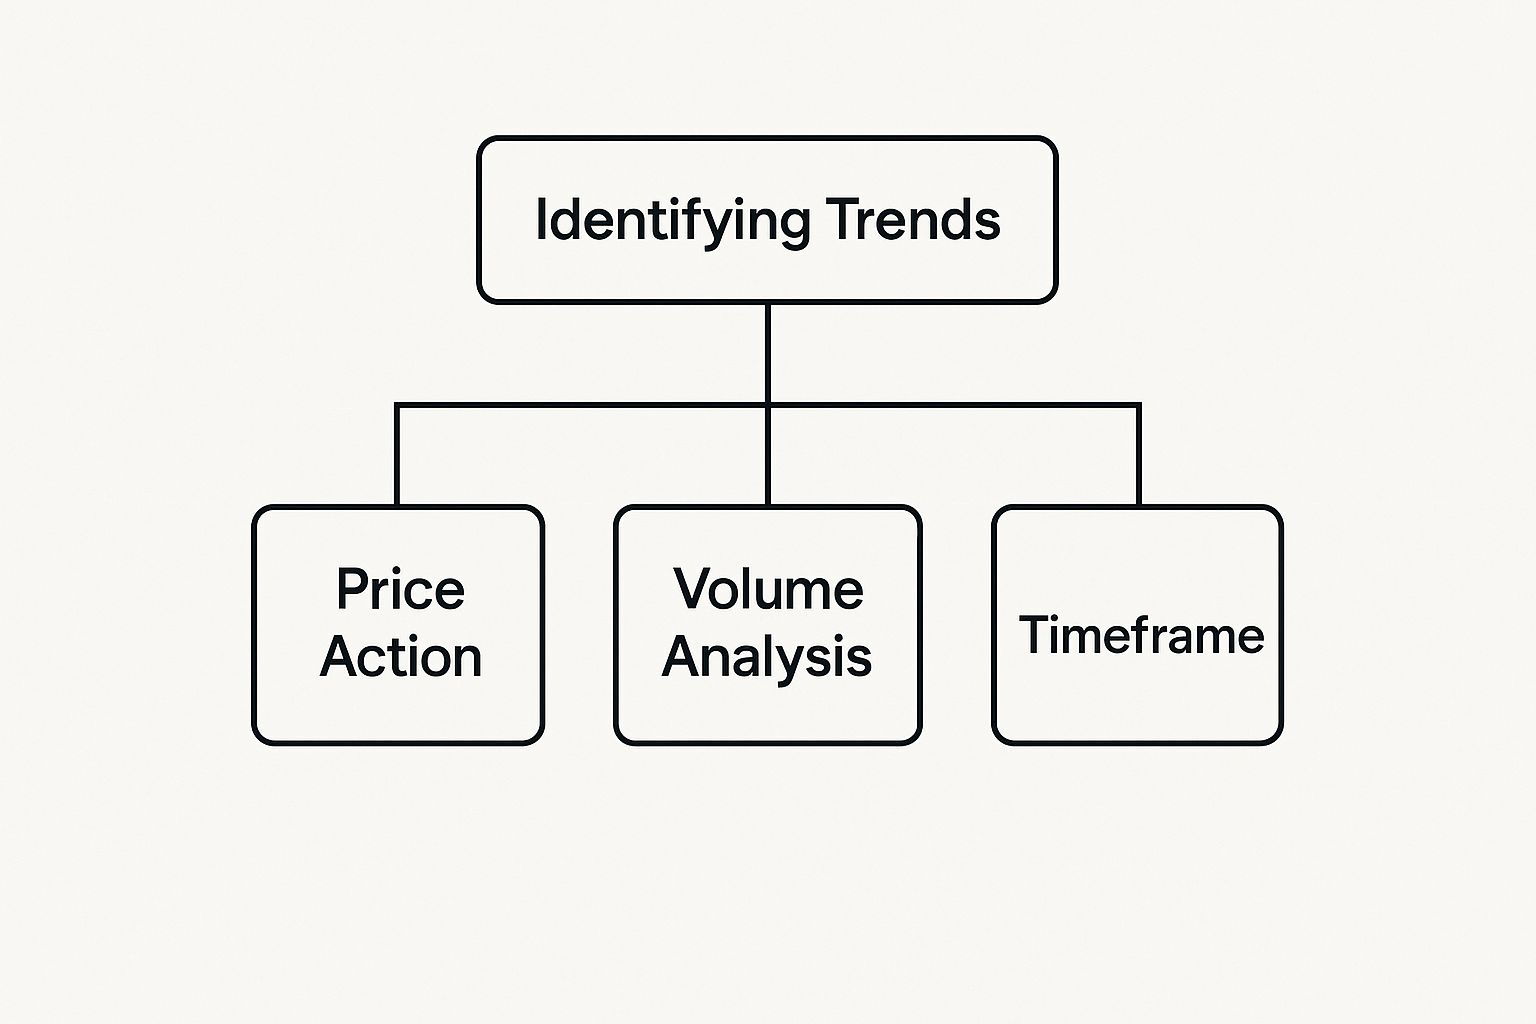
As you can see, price action is your primary signal, but you can often get more conviction by looking at volume and the specific timeframe you’re trading.
To help you quickly grasp the key differences, here's a simple breakdown of each trend type.
Key Characteristics Of Market Trends
| Trend Type | Price Action | Moving Average Behavior | Trader's Objective |
|---|---|---|---|
| Uptrend | Higher Highs & Higher Lows | Price is above key MAs (e.g., 50 & 200 SMA); shorter MA is above longer MA. | Buy on pullbacks to support or moving averages. |
| Downtrend | Lower Highs & Lower Lows | Price is below key MAs; shorter MA is below longer MA. | Sell on rallies to resistance or moving averages. |
| Sideways | No clear HH/HL or LH/LL | Price whipsaws around flat MAs; MAs may cross frequently. | Wait for a breakout or trade the range (buy support, sell resistance). |
This table serves as a quick cheat sheet. As you get more experience, you'll start to recognize these characteristics almost instantly.
Tools To Help You See The Trend
A really powerful—and simple—tool for visualizing these trends is the humble trendline. By drawing a line connecting the higher lows in an uptrend, or the lower highs in a downtrend, you create a visual boundary that helps define the market's path. If you want to get good at this, we've got a detailed guide on how to draw trend lines that walks you through it.
Another incredibly popular method involves using moving averages, like the 50-day and 200-day Simple Moving Averages (SMA). In a strong uptrend, the price will tend to stay above these averages, with the faster 50-day staying above the slower 200-day. In a downtrend, the opposite holds true. When they start to flatten out and cross over each other, it’s often a big clue that the market is shifting into a sideways range.
Mastering trend identification is non-negotiable. It’s the first step in every successful trend trade.
Building Your Trend Trading Toolkit
Spotting a potential trend is one thing. Trading it with real confidence is another game entirely. For that, you need a solid toolkit to help you confirm the trend’s strength and pinpoint smart entry points.
Think of yourself as a detective building a case. The more clues you gather that all point in the same direction, the stronger your argument for placing a trade becomes. This is where a few select technical indicators can make all the difference.
The idea isn't to plaster your screen with dozens of confusing lines. Instead, we want to choose a few reliable tools that work together, telling a clear story about what the market is doing.
Using Moving Averages To Define The Trend
Moving averages (MAs) are the absolute bedrock of trend analysis. What they do is simple but powerful: they smooth out the chaotic, jerky movements of price to create a single, flowing line. This makes it infinitely easier to see the real underlying direction.
Instead of getting tripped up by short-term market noise, an MA gives you a clean, objective view of the trend’s path.
You'll mainly come across two types:
- Simple Moving Average (SMA): This is the straightforward average price over a set period. It gives equal weight to all prices, making it a steady, reliable tool for seeing long-term direction.
- Exponential Moving Average (EMA): The EMA also calculates an average, but it gives more weight to the most recent prices. This makes it more responsive to new information and quicker to signal potential changes in momentum.
A classic trend trading strategy is to use two MAs on your chart—a "fast" one (like a 20-period EMA) and a "slow" one (like a 50-period EMA). When the fast MA is trading above the slow one, it’s a strong confirmation of an uptrend. If it crosses below, it signals that a downtrend might be taking hold.
This "MA crossover" gives you a simple, visual rule for staying on the right side of the market. For a deeper look, check out our guide on the 7 best trend indicators traders should know about.
Gauging Trend Strength With The ADX
Here’s a hard truth: not all trends are created equal. Some are powerful and decisive, while others are weak and choppy, just waiting to reverse and stop you out. Trying to trade a weak trend is a fast path to frustration.
This is exactly why the Average Directional Index (ADX) is such an invaluable tool.
Think of the ADX as a speedometer for the trend. It doesn’t tell you if the trend is up or down, but it measures how strong it is. It’s just a single line that moves between 0 and 100.
A rising ADX line means the current trend is gaining strength, no matter which direction it's headed. On the flip side, a falling ADX suggests the trend is losing steam and the market might be about to go sideways.
Here’s a simple way to read it:
- ADX below 25: The trend is weak or non-existent. It's time to sit on your hands and avoid trend-following setups.
- ADX above 25: A solid trend is in play. This is the green light you’re looking for.
- ADX above 50: This signals an extremely strong trend, but it can also be a warning that things are getting overstretched and a pullback could be near.
Adding the ADX to your analysis helps you filter out the junk trades in choppy markets and focus your capital only on trends that have real power behind them.
Finding Entries With Momentum Oscillators
Okay, so you've found a strong trend. Now what? The next challenge is finding a low-risk spot to jump in. This is where momentum oscillators like the Relative Strength Index (RSI) and the Moving Average Convergence Divergence (MACD) shine.
A common mistake traders make is using these tools to look for reversals—selling when RSI is "overbought" or buying when it's "oversold." In trend trading, we flip that logic on its head.
We use these tools to spot temporary pullbacks within the trend. This gives us a chance to join the move at a much better price.
For example, in a powerful uptrend (confirmed by your MAs and a high ADX), you’d watch for the RSI to dip down toward the 40-50 range. This dip often signals a brief pause or profit-taking, creating a perfect buying opportunity just before the main trend kicks back into gear. It helps you avoid chasing the price at its peak and instead get in during a moment of temporary weakness.
By layering these tools, you build a robust trading system. You use moving averages to define the direction, the ADX to measure its strength, and oscillators to time your entries. This turns trading from a guessing game into a methodical, repeatable process.
Executing Your Trades With Confidence
Spotting a great trend is only half the battle. A brilliant setup means nothing if you can’t pull the trigger. This is the moment your analysis becomes action, and for many traders, it's where things fall apart.
Executing a trade properly boils down to three simple, yet critical, steps: finding your entry, managing your risk, and knowing when to get out.
Think of it like a pilot's checklist. You don't just yank the plane into the air and hope for the best. There's a precise, repeatable process for takeoff, navigation, and landing. This section is your checklist for getting into, managing, and exiting your trades like a pro.
Finding The Perfect Entry Point
Timing is everything. Your goal is to find a low-risk moment to hop aboard an already established trend. Chasing a stock after it's already shot up a huge amount is a classic rookie mistake and often a recipe for disaster.
Instead, seasoned trend traders let the price come to them. We wait patiently for the right opportunity. Two of the most reliable ways to do this are by trading pullbacks and breakouts.
1. Trading the Pullback
A pullback is just a temporary dip during a bigger uptrend or a quick rally during a downtrend. Think of it as the market taking a breather before continuing its main journey.
These moments are gold because they let you enter the trend at a discount, which seriously improves your potential reward-to-risk ratio.
-
In an Uptrend: You're watching for the price to pull back to a key area of support. This could be a rising trendline you've drawn on your chart or, more commonly, a key moving average like the 20-period or 50-period EMA. When the price taps that moving average and starts to bounce, that’s your green light to buy.
-
In a Downtrend: Just flip the logic. You wait for the price to rally up to a resistance level, like a falling trendline or a moving average. Once the rally fizzles out at that level, you've got a solid entry point to sell short.
2. Trading the Breakout
Sometimes a trend will hit the pause button and just chop sideways for a while. It builds up energy in a tight range or consolidation pattern, like a spring coiling up before it’s released.
A breakout is when the price finally explodes out of that consolidation in the direction of the main trend.
By entering on a breakout, you're catching the very beginning of the next wave of momentum. A clean, decisive move above the consolidation's resistance in an uptrend is a crystal-clear buy signal. On the flip side, a break below the support level in a downtrend tells you it's time to sell.
Setting Your Stop-Loss The Right Way
Before you even dream about profits, you have to define your risk. Every single trade you take needs a stop-loss order. This is an automatic exit that gets you out if the market turns against you. It's your non-negotiable safety net.
The secret to trading isn't about being right all the time. It's about making more money when you're right than you lose when you're wrong. A proper stop-loss is what makes this possible.
A fantastic guideline for protecting your capital is the "1% rule." It’s simple: never risk more than 1% of your total trading account on any single trade. If you have a $10,000 account, your maximum loss on one position should be no more than $100. Period.
This rule is what determines your position size. You first figure out the logical place for your stop-loss on the chart—usually just below a recent swing low for a long trade, or just above a recent swing high for a short. Then, you calculate how many shares or units to trade so that if your stop gets hit, the loss equals exactly 1% (or less) of your account.
Knowing When To Take Profits
Let's be honest, exiting a trade is the hardest part. Get out too early, and you leave a pile of cash on the table. Get out too late, and you watch your hard-earned gains vanish into thin air.
The goal isn't to nail the absolute top or bottom. That’s a fool’s errand. The goal is to capture the "meat" of the move.
Here are two effective exit strategies that trend traders live by:
-
Exit on Signs of Weakness: As a trend gets older, it starts to show its age. For an uptrend, this could be a failure to make a new higher high, or a decisive break below a key moving average that's been acting as support. These are early warnings that the momentum is dying, and it's a smart time to cash in your profits.
-
Use a Trailing Stop-Loss: This is a dynamic stop-loss that you manually move up as the price moves in your favor. For example, in an uptrend, you could trail your stop just below each new higher low that forms. This genius method lets your profits run wild while automatically locking them in. Once the trend finally breaks its pattern and hits your trailing stop, you're out, securing a huge chunk of the move.
By combining a disciplined entry, a pre-defined stop-loss, and a clear exit plan, you build a complete trading framework. This is how you turn trading from an emotional rollercoaster into a structured business.
Putting It All Together With Real Chart Examples

Theory and tools are great, but the real "aha!" moment comes when you see them play out on an actual price chart. This is where it all clicks. Let's move from abstract ideas to concrete action by breaking down a few historical trends.
We'll put on the hat of a disciplined trend trader. For each example, we'll identify the trend, pinpoint a logical entry, and figure out how to manage the trade from start to finish.
Case Study 1: The S&P 500 Uptrend
Major indices like the S&P 500 are fantastic for studying trends. Why? Because they reflect broad market sentiment, often carving out clean, sustained moves that are perfect for this style of trading.
Think back to the market action in 2025. Amidst global uncertainty, the S&P 500 demonstrated classic trending behavior. After some initial turbulence, the index posted massive single-day gains when tariff hikes were paused on April 9. By mid-May, it was positive for the year. And on June 27, both the S&P 500 and NASDAQ rocketed to all-time highs, showing just how powerful momentum can be.
This wasn't a one-and-done event. The index climbed another 1.91% in August, bringing its year-to-date gain to 9.84%. Traders who caught this wave early and simply held on were rewarded handsomely. You can see a full breakdown of these market-moving events on Wikipedia.
So, how could a trader have systematically played this?
-
Trend Identification: The first clue is price breaking and holding above key moving averages, like the 50-day and 200-day. The big confirmation? A "golden cross"—when the shorter-term 50-day SMA moves above the longer-term 200-day SMA. That's a classic sign that a new long-term uptrend is underway.
-
Entry Point: A smart trader doesn't chase the first big green candle. They wait. The professional entry comes on the first pullback to a dynamic support level, like the now-rising 50-day EMA. Buying as the price bounces off this level offers a much better risk-to-reward setup.
-
Risk Management: Your stop-loss goes just below the recent swing low formed during that pullback. Simple. If the trend fizzles out immediately, your loss is small and contained, sticking to the 1% rule.
-
Trade Management: As the S&P 500 carves out higher highs and higher lows, you trail your stop. Every time a new, significant higher low is established, you move your stop-loss up just beneath it. This locks in profit step-by-step while still giving the trend room to run.
The chart from that period shows this perfectly—a clear stair-step pattern. That’s the textbook signature of a market firmly in the hands of buyers.
Case Study 2: Gold’s Powerful Downtrend
Of course, trends don't just go up. Commodities like Gold can produce viciously strong downtrends, creating huge opportunities for anyone comfortable with short selling.
Let's imagine Gold enters a bearish phase.
"The trend is your friend, except at the end when it bends." – Ed Seykota
This famous quote from trading legend Ed Seykota sums it up perfectly. Our job isn't to perfectly pick the top or bottom; it's to ride the big, meaty part of the move in the middle.
Here’s the game plan for a downtrend:
-
Trend Identification: The first warning sign is a decisive break below the 200-day moving average. The real confirmation comes with a "death cross"—the 50-day EMA crossing below the 200-day EMA. That's a strong signal that sellers have taken control.
-
Entry Point: Just like in an uptrend, you don't chase the initial drop. You wait for a rally—a pullback up to the now-falling 50-day EMA. When price hits that moving average and gets rejected, it’s a high-probability entry to sell short.
-
Risk Management: Your stop-loss is placed just above the peak of that small rally. This protects you from a sudden reversal and keeps your potential loss clearly defined.
-
Exit Strategy: You trail your stop down with each new lower high. The trade closes automatically when the downtrend structure finally breaks and price rallies past the most recent lower high, hitting your trailing stop and banking the profit.
These two examples show that whether the market is screaming higher or plunging lower, the process is identical. It’s all about combining trend identification, patient entries, and disciplined risk management to build a repeatable strategy that works in any market.
Mastering The Trend Trader Mindset
Technical skills can teach you how to read a chart, but they won't prepare you for the emotional rollercoaster that is live trading. The real difference between traders who make it long-term and those who burn out isn't found on a chart. It’s found in their mindset.
Truth is, mastering the psychology of trading the trend is every bit as important as mastering any technical indicator.
This isn't about diving into complex psychological theories. It really boils down to two core pillars: discipline and patience. Discipline is what forces you to stick to your trading plan, even when a trade goes against you and every instinct is screaming to panic. Patience is that quiet confidence to let your winners run instead of snatching tiny profits just because you're scared.
Without a solid mental game, even the most brilliant strategy is doomed to fail. Your emotions will hijack your decisions, turning a well-thought-out plan into a mess of impulsive mistakes.
Conquering Your Trading Demons
Every single trader battles the same emotional enemies. The most dangerous one? The Fear of Missing Out (FOMO).
This is that gut-wrenching panic you feel when a stock takes off without you. It tempts you to chase it, to jump in and buy at a dangerously high price. It’s a purely emotional reaction, and it almost always leads to a terrible entry.
Just as destructive is the anxiety that creeps in during a perfectly normal pullback. A healthy, strong trend rarely moves in a straight line; it has to breathe. It pulls back before continuing its journey higher. Inexperienced traders see this minor dip as a full-blown disaster and bail out of a great trade, leaving massive profits on the table.
"The psychological element of trading is the most difficult to master. Greed, fear, hope, and regret are all powerful emotions that can cloud your judgment and lead to costly mistakes."
Developing an objective, resilient mindset is all about learning to see these emotions without letting them take the wheel. For a deeper dive, our guide offers 7 practical tips to master your trading psychology and beat the market's mental games.
The Power of Patience and Compounded Gains
In trend trading, patience isn't just about sitting on your hands waiting for the perfect setup. It’s about having the conviction to stay in a winning trade long after the initial excitement wears off.
The biggest, career-making profits come from riding a single trend for weeks or even months, not just a few days. This requires you to truly trust your analysis and fight that constant urge to meddle with your positions.
A quick look at market history shows exactly why this patience pays off. Take the S&P 500. It delivered a 14.37% return in the 12 months ending August 2025, rebounding powerfully from a down year. Even with a slight dip in April 2025 (-0.76%), the bigger trend quickly took back control with huge gains in May (6.15%) and June (4.96%).
A patient trader who held through that minor, nerve-wracking pullback was rewarded handsomely as the trend continued. That's how compounded gains are made—by riding sustained momentum, not by jumping in and out. You can find more insights on these US equities market attributes on spglobal.com.
Actionable Tips for a Resilient Mindset
Building a professional trader's mindset isn't a passive activity. It requires daily practice and a heavy dose of self-awareness.
Here are a few actionable steps you can start with today:
- Create a Detailed Trading Plan: Before you risk a single dollar, write down your exact rules for entry, exit, and risk management. This document becomes your shield against making emotional decisions in the heat of battle.
- Keep a Trading Journal: After every trade—win or lose—write down what you did and, more importantly, why you did it. This simple practice will shine a spotlight on your emotional patterns and help you learn from your mistakes.
- Focus on Execution, Not Outcomes: You can't control whether any single trade is a winner or a loser. The market will do what it does. What you can control is how well you follow your plan. Judge your performance on your discipline, not your P&L for the day.
By making mindset training a core part of your daily routine, you're building the psychological armor needed to navigate the markets with clarity and confidence. In the end, this is your ultimate edge.
Common Questions About Trend Trading
Even when you have a solid game plan, questions pop up. It's only natural. Let's tackle some of the most common ones I hear from traders learning to follow the trend, so you can build your confidence and navigate the market with a clearer head.
How Long Does A Market Trend Last?
This is the million-dollar question, isn't it? There's no single answer because trends play out across all different timeframes. The real key is to match your trading style to the trend's likely lifespan.
- Short-Term Trends: Think days to a few weeks. These are the bread and butter for swing traders looking to catch quick, sharp moves.
- Intermediate-Term Trends: These can run for several weeks to many months. For most of us trend followers, this is the sweet spot—long enough to offer some really substantial moves.
- Long-Term Trends: We're talking about major market shifts that can last a year or even longer. These are the big currents that position traders and long-term investors ride.
Can I Trade The Trend In Any Market?
Absolutely. The beauty of trend trading is that its principles are universal. Momentum is momentum, whether you're looking at stocks, forex, commodities like gold, or even the wild world of crypto.
Any market with good liquidity and clean price movement is a prime candidate. The same tools you use in one market—like moving averages, trendlines, and momentum indicators—will work just as well in another. The patterns of human psychology are visible on any chart.
The biggest mistake new traders make is fighting the primary trend. They try to pick tops in a strong uptrend or catch bottoms in a freefall. Successful trend trading requires the discipline to go with the flow, not against it.
What Is The Biggest Mistake New Traders Make?
Hands down, the most common and costly mistake is fighting the trend. Newcomers seem obsessed with calling the exact top or bottom. They see a market that's been climbing for weeks and think, "This has to be it, time to sell." Or they'll see a market in a nosedive and try to be the hero who buys at the perfect low.
This is the exact opposite of what we're trying to do. Real success in this game comes from the discipline to trade in the same direction as the established momentum. It's about having the patience to wait for a low-risk pullback that lets you join the trend, even if it feels like you're buying high. Learning to accept that the trend is your friend is the first giant leap toward consistency.
Ready to stop guessing and start trading with a clear, repeatable strategy? At Colibri Trader, we provide action-based programs that teach you how to read price action and profit in any market condition. Find out how you can transform your trading performance by visiting https://www.colibritrader.com.