


A Modern Trading Strategy Guide to Price Action
A winning trading strategy guide isn't some secret formula I can just hand you. It's a deeply personal framework that you have to build yourself, brick by brick, based on your own goals, your personality, and what you're willing to risk.
Think of it as the documented system that separates disciplined, professional traders from market gamblers. It's your map for navigating the often-chaotic world of the financial markets, dictating every move you make before you ever put a single dollar on the line.
Building Your Foundational Trading Framework
Before you even think about placing a trade, you need a system. I can't stress this enough. A solid trading strategy is your business plan, designed specifically to give you a statistical edge over the long haul.
Without one, you're just reacting to market noise. That's a surefire recipe for emotional decisions and, frankly, costly losses. The entire goal here is to construct a framework so clear and objective that it completely removes the guesswork from your trading.
This framework is built on a few non-negotiable pillars. Each one supports the others, creating a solid plan you can follow with real confidence, even when the market gets choppy.
Choosing Your Trading Style and Market
First things first: you need to define your style of operation. This isn't about what kind of trader you want to be in a perfect world. It’s about what your real-life personality and daily schedule can actually sustain.
- Scalping: Can you handle the intensity of making dozens of trades a day for tiny, rapid-fire profits? This is a high-focus, high-stress style. It's best suited for extremely liquid markets with tight spreads, like the major forex pairs (think EUR/USD) or futures contracts like the S&P 500 E-mini.
- Day Trading: This involves getting in and out of your positions within the same trading day. It demands a lot of screen time but involves fewer trades than scalping. It works well in stocks, forex, and crypto markets that show clear trends during the day.
- Swing Trading: This is my personal preference. You hold trades for several days or even weeks to catch the larger "swings" in the market. This style is a much better fit for people who can't be glued to their charts all day. You'll spend more time analyzing daily or weekly charts, looking for major support and resistance levels.
The style you pick has a direct impact on the markets you'll trade. A swing trader might keep an eye on a handful of specific stocks, whereas a scalper absolutely needs the deep liquidity you only find in a major currency pair.
Key Takeaway: Your trading strategy absolutely must align with your personality. If you're an impatient person, you're going to fail as a swing trader. Likewise, someone with a demanding full-time job will burn out trying to scalp. Be honest with yourself about your own temperament—it’s the most important first step.
Defining Your Core Methodology
Once you've settled on a style, you have to pick your method of analysis. For the purpose of this guide, we're focusing on price action. This means you're making all of your trading decisions based on the movement of price on a "naked" chart, without all the clutter of lagging indicators.
This approach is all about learning to read the story the market is telling you through its candlestick patterns, its support and resistance zones, and the overall market structure. You learn to see who’s in control—the buyers or the sellers—and you position yourself to trade with the dominant force.
For example, a price action trader might build a specific set of rules around a "Pin Bar Rejection" pattern that appears at a key daily resistance level. That specific, observable event becomes a potential trigger to enter a trade. It's the foundation of a repeatable setup.
This is a proactive way to trade. It's completely different from indicator-based strategies that usually just tell you what has already happened. When you commit to price action, you're committing to learning the universal language of the market itself.
Learning the Language of Price Action
Price action trading is all about reading a clean chart. That’s it. You're learning the market's native tongue, seeing the raw story of supply and demand as it happens.
Forget about lagging indicators. Those are just translators telling you what already happened. When you master price action, you understand the psychology driving the moves in real time. Every single candle, every peak and valley, is a battle between buyers and sellers. Your job is to figure out who has the upper hand and trade with them. It’s a powerful approach and the foundation of my own trading plan.
Decoding Candlestick Patterns
Think of candlesticks as the alphabet of the market. Individual bars and small formations give you powerful clues about momentum and potential turning points. There are dozens of patterns out there, but a solid trading strategy guide will tell you to focus on the handful that scream "pressure."
A bullish engulfing bar, for example, isn't just a pattern. It’s a moment of shock and awe where buyers came in so aggressively they completely erased the prior period's selling. When you see that at a key support level, it’s a massive clue that the downtrend could be over.
Then you have the pin bar (also called a hammer). Its long lower wick tells an equally powerful story, but one of rejection. Sellers tried to slam the price down, but buyers fought back hard, pushing it all the way back up. That rejection is your signal. It shows you exactly where the buying pressure is.
Identifying Key Market Structure
Now, reading those candlestick patterns without context is a rookie mistake. Market structure—the framework of swing highs and swing lows—is that context. It tells you if you're in an uptrend, a downtrend, or just chopping sideways.
- An uptrend is just a series of higher highs and higher lows.
- A downtrend is the opposite: lower highs and lower lows.
A crucial mistake I see traders make all the time is fighting the dominant trend. If the daily chart is clearly in an uptrend, trying to short a little 5-minute pattern is a low-probability, high-stress way to lose money. Always trade in the direction of the larger structure.
When the market isn't making new highs or lows and is just bouncing around, it's consolidating. These ranges give you incredibly clear support and resistance levels, which are prime hunting grounds for reversal patterns.
The Power of Support and Resistance
Support and resistance levels are the most important lines on your chart. Period. They are zones where the market has reversed before, meaning there’s a high concentration of orders waiting there.
- Support: A price floor where buyers have historically stepped in.
- Resistance: A price ceiling where sellers have historically taken control.
These aren't laser-precise lines; they're more like zones. The magic happens when you get a powerful candlestick signal, like a pin bar, forming right at a major support or resistance zone that also happens to align with the overall trend. For anyone wanting to really nail this down, there are some great practical price action tips that work available from traders who live and breathe this stuff.
When you combine these three elements—candlesticks, structure, and support/resistance—you're no longer just spotting patterns. You're reading the market’s story. A big bearish engulfing bar at a major resistance level in a clear downtrend isn't just a setup; it's a complete, coherent narrative of seller dominance. That’s how you start thinking like a true price action trader.
Crafting Your Personal Trading Rulebook

A trading idea is one thing. Turning it into a professional operation is something else entirely. This is where your personal rulebook comes in. It’s the bridge from a rough concept to a mechanical, non-negotiable process that will be your anchor in the heat of the moment.
Think of it as your business plan for every single trade. It's what you'll lean on when fear or greed inevitably tries to take the wheel. Without a concrete set of rules, you're just improvising. And in the markets, improvisation is the enemy of consistency. The mission here is to define a process so precise that you can execute it flawlessly, almost like a robot, stripping the emotion out of your decisions.
Defining Your Exact Entry Triggers
Your entry rules need to be crystal clear. There can be zero room for interpretation. "I'll enter when it looks like a good setup" isn't a rule; it's a recipe for disaster. What you need are specific, observable conditions that must be met before you even think about putting capital on the line.
Let's say you're a price action swing trader. A truly precise entry rule might look like this:
- Condition 1: The daily chart must show a clear uptrend (a distinct series of higher highs and higher lows).
- Condition 2: The price has to pull back and test a major support level you've already identified.
- Condition 3: A bullish pin bar or a bullish engulfing pattern must form on that daily chart, right at the support level, confirming its rejection.
The trade is only valid when all three of those conditions are ticked off. It's black and white. You either see the pattern at the right location in the right trend, or you don't. No grey areas allowed.
Setting Logical Exit Criteria
Knowing when to get out is just as critical as knowing when to get in. Your exit points—for both a loss and a profit—have to be decided before you place the trade. This is a bedrock principle of risk management and a non-negotiable part of any solid trading strategy guide.
Your stop-loss is your safety net, and it needs to be logical. Don't just pick an arbitrary percentage or dollar amount. Place it based on market structure. For that bullish pin bar example, a smart stop-loss would sit just below the low of the pin bar's wick. Why? Because if the price breaks that level, the whole reason you entered the trade—the bullish rejection—is invalidated.
Your profit target should also be dictated by market structure. Look left on your chart. Where is the next key resistance level where sellers are likely to show up? Set your target just below that level. This gives your trade a high-probability destination and helps you lock in a favorable risk-to-reward ratio. Aim for at least 2:1, meaning your potential profit is double your potential loss.
A trader's discipline is measured by their ability to honor pre-defined stops and targets. Moving your stop further away when a trade moves against you or cancelling a take-profit order out of greed are the cardinal sins of trading. They break your entire system.
The Role of Data in Rule Creation
Building a robust rulebook isn't just about what feels right; it's about finding a genuine statistical edge. This is where historical data is your best friend. Take the well-known Moving Average Crossover strategy. It's built entirely on defined rules for entries and exits based on historical price action.
In fact, extensive backtesting of this system shows it can produce a Compound Annual Growth Rate (CAGR) of around 8.5%. More importantly, it did so with a maximum drawdown of about 15% and a win/loss ratio of 1.8. This is a perfect example of how a rule-based approach, proven with data, can grow an account while managing the inevitable downside. If you want to dive deeper, you can learn more about leveraging historical data on Bookmap.com.
Ultimately, your rulebook is a contract you make with yourself. It's your commitment to disciplined processes over emotional whims. Document everything, review it daily, and treat it as the most valuable tool in your arsenal. It’s what turns a reactive gambler into a proactive, consistent trader.
Why Backtesting Your Strategy Is Non-Negotiable
How do you build unshakable confidence in your strategy? Where does the gut feeling come from that lets you pull the trigger without hesitation?
It comes from one place: rigorous, honest backtesting. This is the crucial step where you prove to yourself that your trading rulebook has a genuine statistical edge before a single dollar is ever at risk. Without it, you're just gambling on a hunch.
Backtesting is your strategy’s trial by fire. It’s not just about running numbers; it’s about conditioning your mind to recognise and act on your setups when the pressure of the live market hits. This process turns your theory into a tangible, proven method.
The Mechanics of Manual Backtesting
So, how do you actually do it? For a price action trader, the most effective method by far is manual backtesting.
This involves going back in time on your charting platform, hiding all the future price data, and then scrolling forward one candle at a time. It’s like being a detective, piecing together the market's story as it unfolds.
When one of your predefined setups appears—let's say a bearish engulfing bar at a known resistance level—you simulate the trade. You log the entry price, your pre-determined stop-loss, and your profit target, all based on your rules. Then, you "play" the trade forward to see the outcome. Was it a win, a loss, or a break-even?
You have to meticulously record every single detail of every trade in a spreadsheet. I won't lie, this isn't a quick process. To gather any meaningful data, you need a solid sample size of at least 100 trades. It takes patience, but the insights you gain are priceless. This is a core part of any legitimate trading strategy guide.
Interpreting Your Backtesting Data
Once you've logged 100 or more trades, you'll have a treasure trove of data. Now it's time to crunch the numbers and see if your strategy actually holds water. This isn’t just about the win rate; it’s about understanding the complete performance profile.
You'll need a clear picture of your strategy's performance. The table below outlines the essential metrics you should be tracking to get a full understanding of its effectiveness and risk profile.
| Metric | Description | What to Look For |
|---|---|---|
| Win Rate | The percentage of trades that were profitable. | Don't get fixated on this alone; a high win rate with small wins can still lose money. |
| Profit Factor | The gross profit divided by the gross loss. | A value above 1.5 is generally good, while anything over 2.0 is excellent. |
| Maximum Drawdown | The largest peak-to-trough drop in your equity. | This shows you the worst losing streak to expect and helps you size positions realistically. |
| Avg. Risk/Reward | Your average win size compared to your average loss size. | Aim for winners that are significantly larger than your losers (e.g., 2:1 or higher). |
This data tells the true story of your strategy's viability. A high win rate means nothing if your few losses are so large they wipe out all your gains. Conversely, you can be profitable with a surprisingly low win rate if your winners are substantially bigger than your losers. To really get into the nitty-gritty, you can explore a more detailed guide on how to backtest a trading strategy that breaks down the steps even further.
Backtesting is the only way to experience a 10-trade losing streak without losing any real money. By doing so, you mentally prepare for the inevitable drawdowns, building the resilience needed to stick to your plan when it happens in your live account.
The Importance of High-Quality Data
The quality of your backtest is only as good as the quality of your data. It's a "garbage in, garbage out" situation. This is precisely why major financial institutions spend fortunes on comprehensive historical datasets to validate their models.
These firms use incredibly detailed tick-level data that captures every single price fluctuation. This allows for simulations that mirror real market conditions with extreme precision, accounting for things like slippage and latency. For a glimpse into what the pros use, you can check out details on professional historical market data on Pico.net. This just underscores a vital point: the more accurate your data, the more reliable your backtesting results will be.
This bar chart gives a great visual of how common risk management metrics relate to each other during the testing phase.
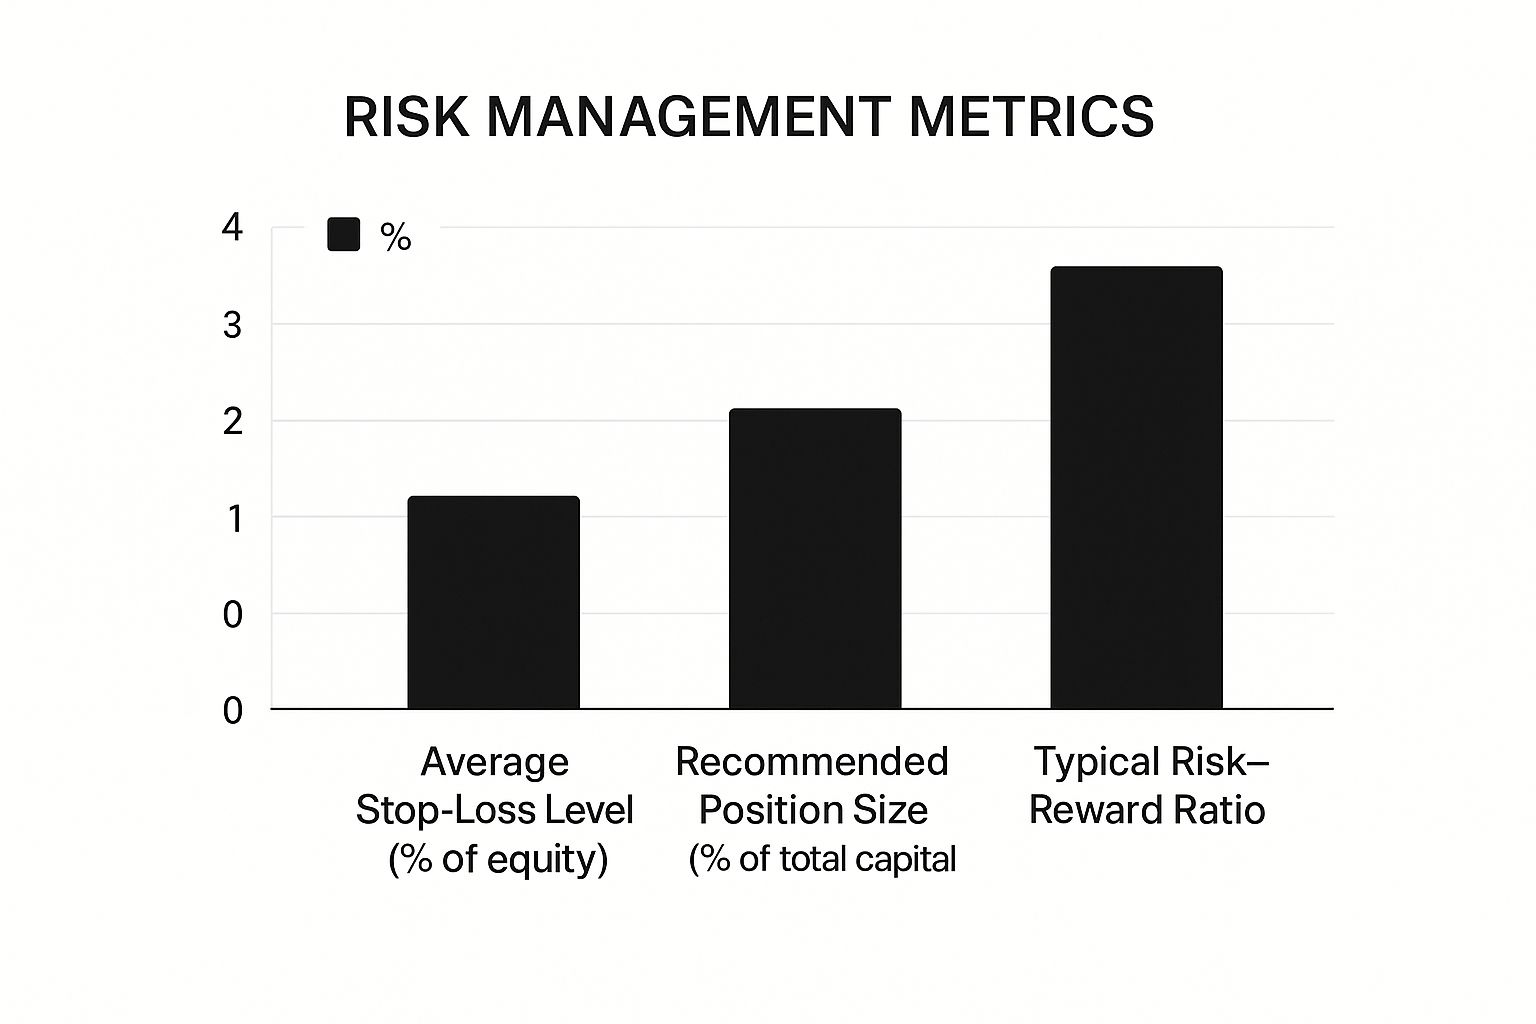
As you can see, a tighter stop-loss often goes hand-in-hand with a smaller position size and a more favourable risk-to-reward ratio. This is the core of a balanced and sustainable risk management approach.
Executing Your Plan With Discipline and Precision
You can have the most incredible, data-backed trading strategy in the world. I'm talking about one with a fantastic profit factor and a gorgeous equity curve in testing. But it's all completely useless if you can’t actually execute it when real money is on the line.
This is the hard truth. It's the great filter where most aspiring traders wash out.
That gap between a successful backtest and profitable live trading is a psychological minefield. This is where fear, greed, and impatience come out to play, sabotaging even the most well-thought-out plans. This part is all about building the mental fortitude required to follow your rules with almost robotic consistency.
It's about learning to trust your edge and operate like a professional, even when every emotional impulse is screaming at you to do the exact opposite.
Overcoming Psychological Hurdles
The live market brings emotional pressures to the table that simply don't show up in a spreadsheet. We've all felt them. The fear of missing out (FOMO) when a market is ripping higher, or that burning desire to "revenge trade" after a loss to win your money back immediately. These are powerful, account-killing forces.
Hesitation is another one. You see your perfect, A+ setup—the one you've documented and studied—but you freeze. You second-guess it, wait for "just one more confirmation," and then watch the trade take off without you. The only way to beat this is to internalize that your job isn't to be a fortune teller; it's simply to execute your proven edge every single time it appears.
The professional trader focuses on flawless execution of their strategy. The amateur trader focuses on the money. If you get the execution right, the money will naturally follow as a byproduct of your discipline.
To fight back against these hurdles, you need solid routines and systems to keep your mind right. Building a professional approach takes more than knowing your setups; it requires managing yourself. For anyone serious about this, diving deep into trading discipline is a crucial first step in building the right habits from day one.
Establishing a Pre-Market Routine
Your trading day doesn't start with the opening bell. It starts much earlier, with a pre-market routine designed to get you prepared, both mentally and strategically. This isn't about chasing hot stock tips; it's about grounding yourself in your own plan.
A solid routine might look something like this:
- Review your rulebook: Go over your entry and exit criteria. Remind yourself exactly what your best setups look like on a chart.
- Identify key levels: Before the market gets chaotic, mark the major support and resistance zones on your charts. This prepares you for where the best opportunities are likely to show up.
- Mental rehearsal: Close your eyes and visualize yourself executing your plan flawlessly. See yourself taking a valid setup without a flicker of hesitation. Picture yourself calmly accepting a small, manageable loss if a trade hits your stop.
This routine primes your brain for a session of disciplined trading. It allows you to approach the market calm and proactive, not frantic and reactive.
The Power of a Trading Journal
If there's one tool that will accelerate your growth more than any other, it's a trading journal. This is the most critical tool in this entire trading strategy guide. And it goes way beyond just logging wins and losses. A proper journal tracks your performance and your state of mind.
For every single trade you take, you need to document:
- The setup: Why did you enter? What were the technical reasons? Grab a screenshot of the chart at the moment of entry.
- Your execution: Did you follow your rules for entry, stop-loss, and profit targets to the letter? If you deviated, be honest about why.
- Your emotions: How did you feel before, during, and after the trade? Were you anxious? Greedy? Impatient? Calm?
Review your journal at the end of every week. You will quickly start to see patterns jump off the page. Are most of your losses coming from impulsive trades that broke your rules? Are you constantly cutting your winners short because of fear?
This journal is your ultimate accountability partner. It provides the cold, hard feedback you need to refine both your strategy and, more importantly, yourself. It's how you turn painful lessons into profitable habits.
Frequently Asked Questions on Trading Strategies
Even with a solid strategy on paper, the live markets have a way of throwing curveballs that test your rules and your nerve. It’s only natural for questions to pop up along the way.
Let's dive into some of the most common hurdles I see traders face. My goal here is to give you some clear, experienced-based answers to help you build a trading plan that actually holds up under pressure.
How Do I Know When My Trading Strategy Needs an Adjustment?
This is one of the toughest calls a trader has to make: Is this just a normal losing streak, or is my strategy fundamentally broken? It's a very fine line.
The first real clue is when your live trading results start to seriously and consistently lag behind what your backtesting showed. I’m not talking about a few bad trades. You need a decent sample size to make this call, at least 50 to 100 trades. If your win rate, profit factor, or average risk-to-reward has completely fallen off a cliff over that period, something is likely wrong.
Another major red flag is a sudden, sharp spike in your maximum drawdown. This can be a strong signal that the market environment your strategy was designed for has changed in a big way.
Your job isn't to constantly tinker with your rules after every loss. It's to spot a true statistical deviation from your proven edge. The goal is intelligent adaptation, not nervous, emotional reactions.
Can I Use the Same Price Action Strategy on Different Markets?
At its core, price action is universal. The reason is simple: it’s all driven by human psychology. Fear and greed show up on a chart the same way whether you're looking at forex, stocks, or crypto.
But—and this is a big but—that doesn't mean you can just copy and paste your exact rules from one market to another and expect them to work. You absolutely have to adjust your approach for the unique "personality" of each asset.
Here's what I mean:
- Volatility: A stop-loss that's perfectly reasonable for a slow-moving blue-chip stock like Johnson & Johnson would get you knocked out of a trade instantly on a volatile crypto like Bitcoin. You must adjust your stop distances based on the asset's Average True Range (ATR).
- Structure: Major forex pairs often respect key levels and trend beautifully. Certain individual stocks, on the other hand, might be stuck in a choppy, range-bound mess for months. Your strategy has to fit the structure you're seeing on the chart.
- Session Times: A breakout strategy that kills it during the high-volume London session for EUR/USD might get chopped to pieces in the quiet Asian session. Market behaviour changes dramatically depending on who is trading.
The bottom line is straightforward. You must backtest and prove your entire rulebook on each specific market and timeframe before risking a single dollar. A one-size-fits-all approach is a fast track to draining your account.
What Is the Most Common Mistake When Building a Strategy?
Hands down, the single most destructive mistake is overcomplication. It's a trap almost every new trader, and even some experienced ones, fall into.
There’s this belief that more indicators, more rules, and more confirmation signals will somehow lead to a better strategy. Traders clutter their charts with so many oscillators and lines that it becomes impossible to read. This leads to what's known as "analysis paralysis," where you're so swamped with conflicting information that you freeze up and miss the best trades.
In my experience, the most durable and successful strategies are built on simplicity. Your rules need to be so crystal clear that you can execute them without a second thought, especially when the pressure is on.
Concentrate on truly mastering a few core price action concepts.
- Get really good at identifying clean support and resistance zones.
- Master one or two high-probability candlestick patterns.
- Become an expert at reading the prevailing trend.
A simple plan executed with discipline will always beat a complex one that's impossible to follow. Strip away the noise. Focus on what actually matters on the price chart. That's the real secret to building a strategy that can deliver consistent results over the long haul.
Ready to stop guessing and start trading with a proven, indicator-free plan? At Colibri Trader, we provide the practical education and mentorship to help you master price action. Take our free Trading Potential Quiz and discover how our action-based programs can give you the skills and confidence to succeed in any market.