


Trading Analysis 20th September
Dear traders,
I have just launched my trading room, where I do share my daily trades.
If you are interested, you are welcome to join. You can do that from HERE.
Last week, we had a phenomenal success and one of the trades returned 10 times the risk!
In other words, that was a 1:10 risk:reward ratio.
Here is a screenshot of the trade that I shared as I was taking it in my trading room:
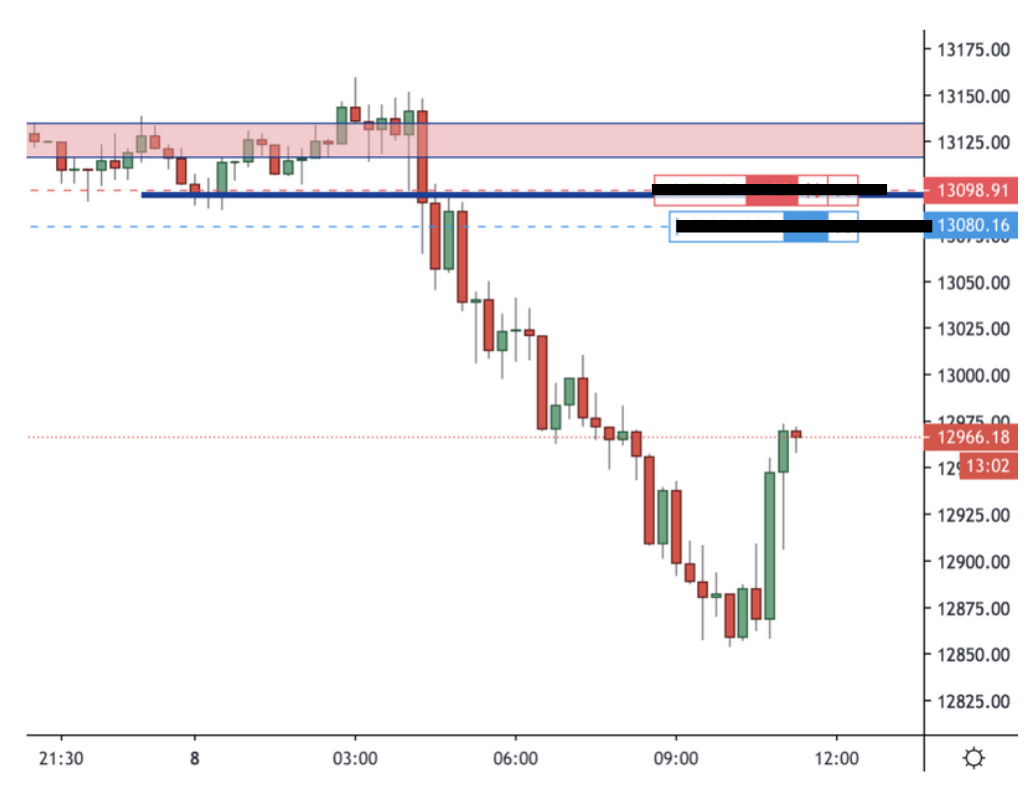
We managed to pull 5 winning days out of 5 trading sessions, so I must say it was a good week.
I did share with you on my website a potential Gold trade, which still has not materialised, but I do share my thoughts behind taking a trade in the trading room.
Another very profitable trade we took was a Dow Jones short trade that managed to make about 1:6 risk:reward return.
Again, I cannot emphasise enough how important it is to run a trade as much as possible while minimising the risk.
This trading room is the practical side of what I am sharing with you on this website.
But enough of a show-off for today.
Let’s have a look at a few possible trading scenarios that I am expecting for this upcoming week.
They aim to cover a few different timeframes and instruments.
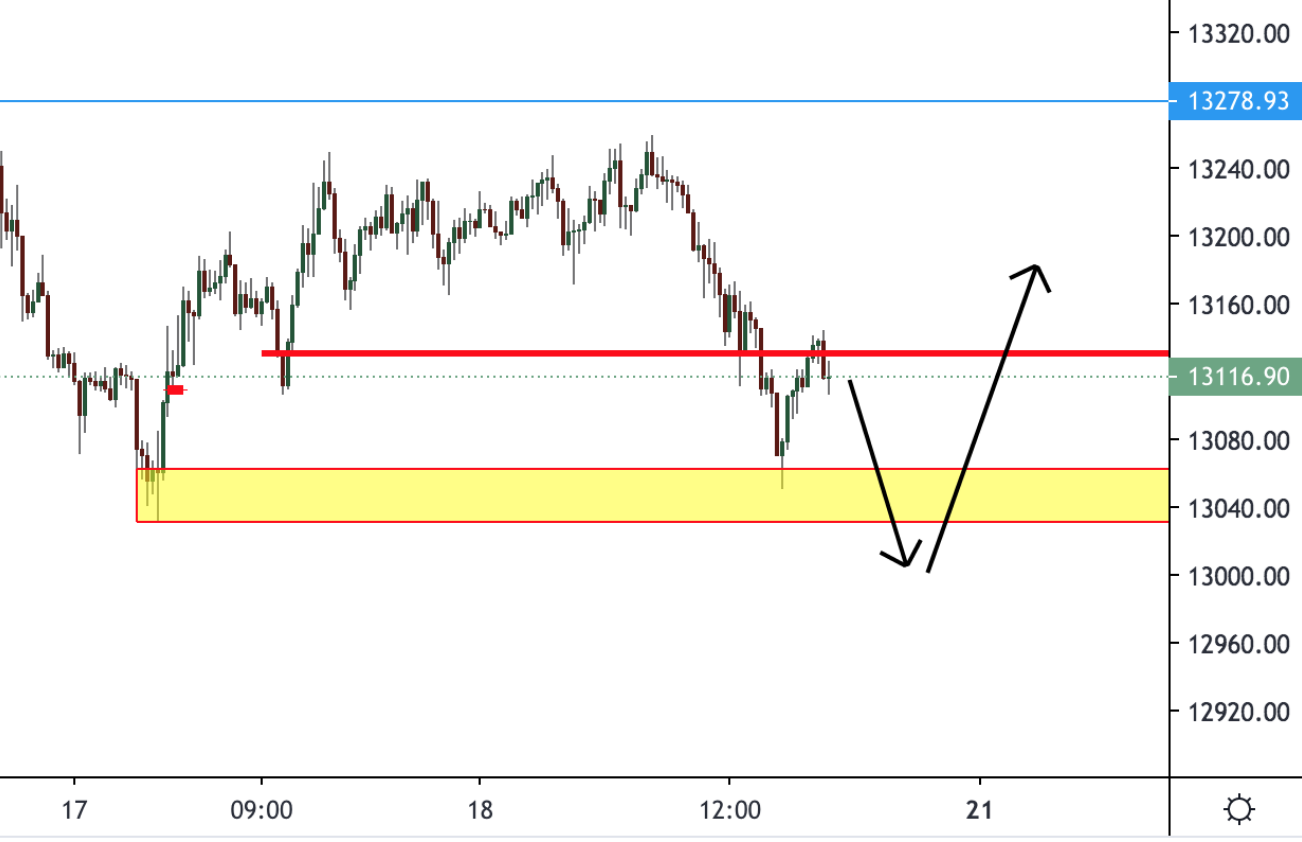
DAX 15M Chart
Hi guys, during the next open I will be looking for a potential reversal.
I will be following the rules from my day trading course to potentially enter in a long trade if the price ticks all boxes.
Then if all good, this might turn into a powerful reversal.
Here is the 15M chart below.
Gold 4 Hour Chart
There is a bearish engulfing on the 4H chart.
I will be looking at the open at potentially try to enter in a short if I see a good entry point with good risk:return
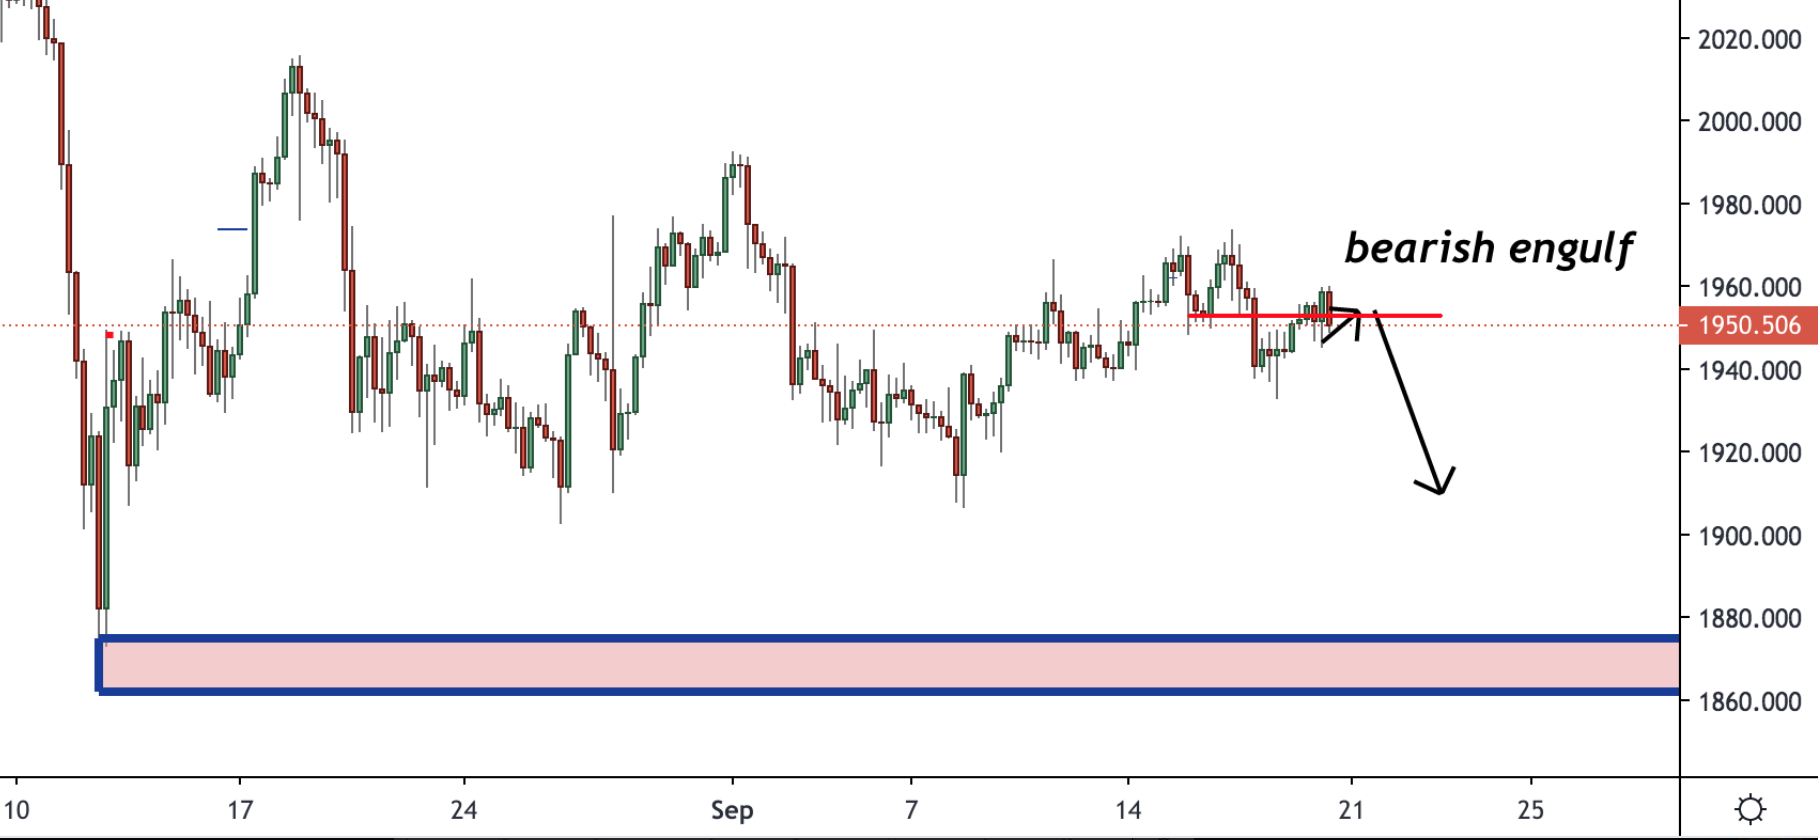
So far Gold has been locked in a range, but it needs to break at some point.
If you miss a short trade I believe that the red demand zone below the price will give us a chance to go long.
This depends on price action of course and time.
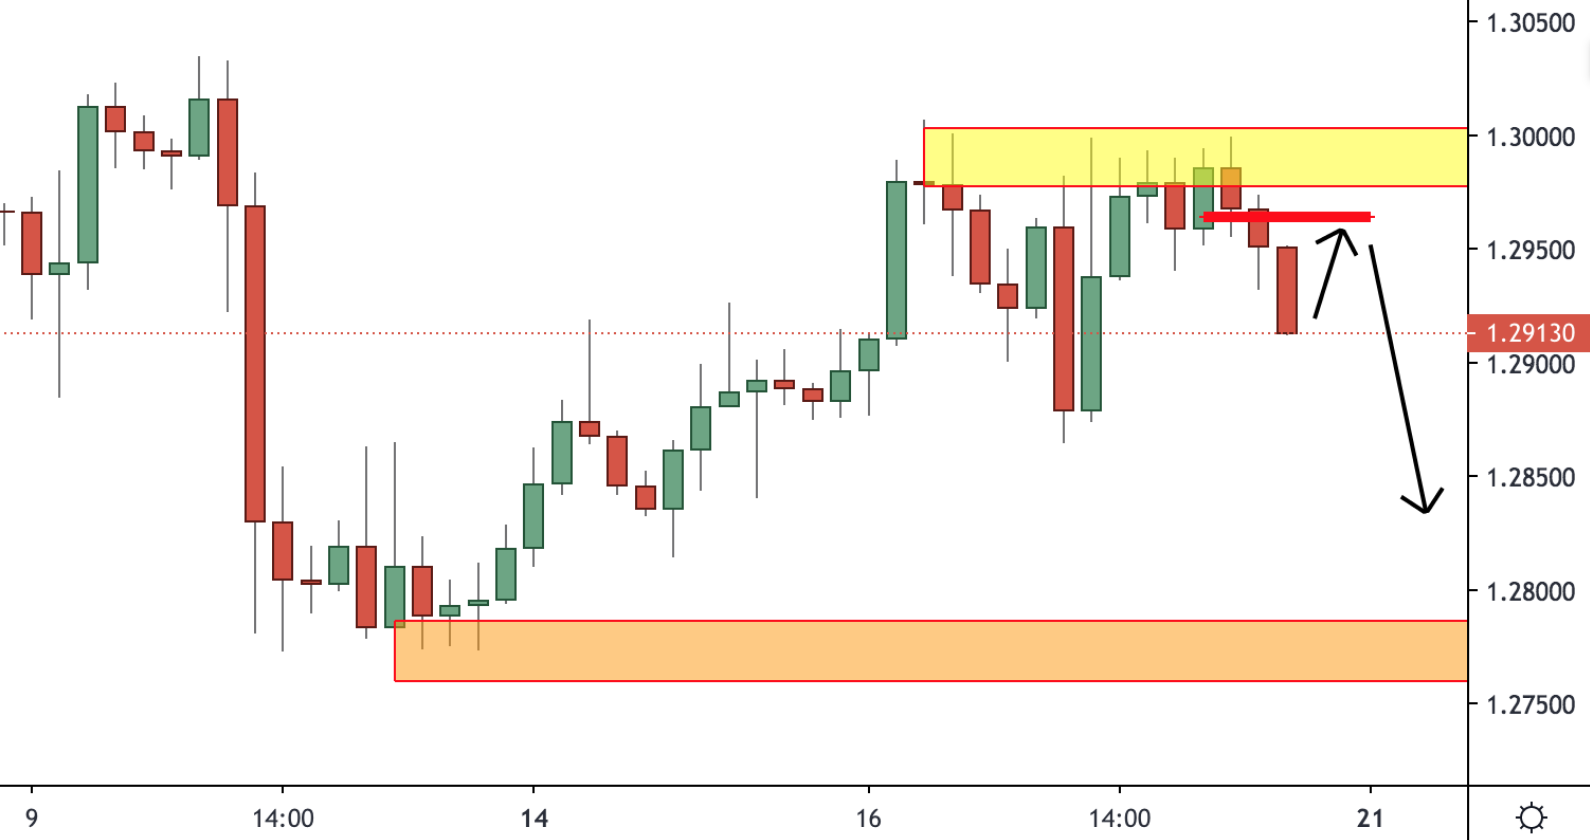
GBPUSD 4 Hour Chart
Here is the GBPUSD chart.
That is 4H and as the yellow supply zone suggests, it was a good shorting opportunity.
There was an inside bar, which led to some selling pressure.
Will that materialise into a trade from my side, I will let you know this coming week in the trading room.
The daily timeframe is showing a bearish engulfing pattern.
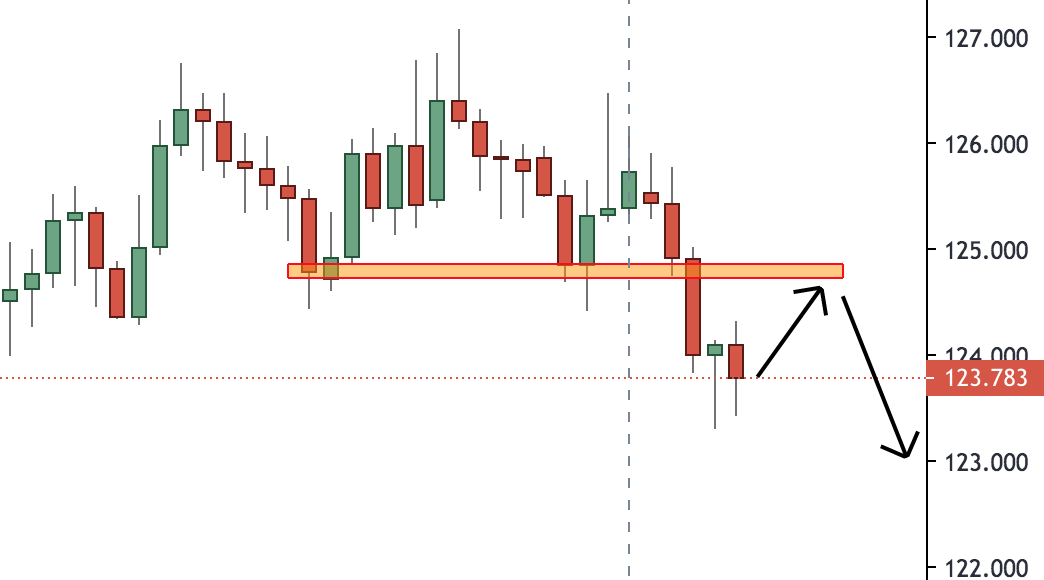
EUR/JPY Daily Chart
Here is the daily chart of EUR/JPY.
I will be looking for a potential return of the price back to the marked area.
If that occurs then I will consider taking a short trade if of course price confirms my bearish outlook.
For my on this analysis or if I will take any of those trades or others, you can join us in the trading room.
For anything else, you can drop me a line at: admin@colibritrader.com
Happy trading,
Colibri Trader