


Master Risk Reward Ratio Calculation for Better Trading
Why Most Traders Get Risk Reward Ratios Completely Wrong
It’s a peculiar situation in trading: the risk-reward ratio is a concept everyone seems to know, yet very few understand how to use it effectively. Many new traders get hung up on their win rate, feeling proud about winning 7 or 8 out of every 10 trades. The problem is, a lot of them are just treading water or, even worse, watching their account balance slowly shrink. This happens because a high win rate is meaningless if your occasional losses are big enough to erase all your careful gains.
The root of this issue is a psychological game we play with ourselves. We are naturally inclined to chase wins and run from losses. It feels fantastic to lock in a small, quick profit on what seems like a sure thing, even if that trade had the potential for much more. On the flip side, we tend to cling to losing positions, hoping for a turnaround, which can turn a small, manageable loss into a significant one. This emotional approach completely disregards the straightforward math of a risk-reward ratio calculation.
The Seduction of a High Win Rate
Let’s face it, being right feels good. A trading strategy that boasts an 80% win rate sounds incredibly appealing. But picture this: each of your eight winning trades nets you $50, for a total of $400. Then, your two losing trades cost you $250 each, totaling a $500 loss. Despite being right most of the time, you've ended up $100 in the red. You've fallen into a negative expectancy trap where the numbers are working against you.
This is the complete opposite of how professional traders operate. They know that you don't need to win the majority of your trades to be consistently profitable. In fact, many successful pros have win rates under 50%. They don't have a secret formula; they have an unwavering commitment to positive risk-reward principles.
Thinking in Probabilities, Not Certainties
A professional trader treats every trade as a calculated risk where the potential upside is much larger than the potential downside. They aren't searching for guarantees; they're looking for favorable odds that play out over a large number of trades. The risk-reward ratio is a cornerstone of stock trading and investing strategies globally, helping measure expected returns against potential losses. For this reason, market strategists often aim for an optimal risk-reward ratio around 1:3, meaning for every dollar risked, the potential return is three dollars. You can explore the strategic thinking behind this in more detail in a comprehensive paper on the subject.
This disciplined mindset shifts trading from a form of gambling to a methodical business. By consistently applying a risk-reward ratio calculation to every trade setup, you ensure that your winning trades are substantial enough to cover your inevitable losses, setting the stage for steady, long-term account growth.
The Math Behind Profitable Trading Decisions
Let's get into the actual risk-reward ratio calculation so you can start using it with confidence. You don't need a complicated spreadsheet for this; the core idea is simple enough to work out in your head. Essentially, you're just comparing the distance from your entry point to your stop loss (your risk) with the distance to your profit target (your reward).
The formula looks like this:
Risk-Reward Ratio = (Entry Price – Stop Loss Price) / (Profit Target Price – Entry Price)
This straightforward calculation provides a crucial piece of insight. For example, if you risk $1 with the potential to make $3, your ratio is 1:3. This means you could be wrong on two separate trades, win the third, and still be profitable. This is the mathematical edge that helps separate consistent traders from those just getting lucky.
A Real-World Stock Trade Example
Let's say you're watching Apple (AAPL) and spot a solid support level at $150. You decide to buy the stock if it dips to $155, betting it will rebound to its recent high of $170.
- Entry Price: $155
- Stop Loss: $150 (placed just beneath the support)
- Profit Target: $170 (the recent peak)
Here, your potential risk per share is the difference between your entry and your stop loss ($155 – $150 = $5). Your potential reward is the difference between your profit target and your entry ($170 – $155 = $15). This gives you a risk-reward ratio of $5 to $15, which simplifies to an attractive 1:3. For every dollar you put on the line, you stand to make three.
This next visual clearly illustrates how the potential reward dwarfs the risk in a 1:3 setup.

As you can see, the potential gain is significantly larger than the initial risk. This is exactly what you should look for in a high-quality trade setup.
Calculating for Different Setups
The great thing about this calculation is its versatility. It works the same whether you're trading stocks, forex, or commodities. Let's look at a short-selling scenario to see it in action. Imagine you want to short the EUR/USD pair at 1.0800, setting a stop loss at 1.0850 and a profit target at 1.0700.
- Risk: 1.0850 – 1.0800 = 50 pips
- Reward: 1.0800 – 1.0700 = 100 pips
- Ratio: 50 : 100, which simplifies to 1:2
To help you visualize this across various scenarios, I've put together a few examples in a table. This shows how the formula applies to different assets and trade directions.
Risk Reward Ratio Calculation Examples
Real trade scenarios showing entry price, stop loss, profit target, and calculated ratios
| Trade Setup | Entry Price | Stop Loss | Profit Target | Risk Amount | Reward Amount | R:R Ratio |
|---|---|---|---|---|---|---|
| Long on Apple (AAPL) | $155 | $150 | $170 | $5 | $15 | 1:3 |
| Short on EUR/USD | 1.0800 | 1.0850 | 1.0700 | 50 pips | 100 pips | 1:2 |
| Long on Gold (XAU/USD) | $2,350 | $2,340 | $2,380 | $10 | $30 | 1:3 |
| Short on Tesla (TSLA) | $180 | $185 | $165 | $5 | $15 | 1:3 |
This systematic approach forces you to define your exit points before you ever enter a trade. It's a fundamental shift that removes emotion from the equation and introduces much-needed discipline, turning your trading from a gamble into a calculated business.
Your First Calculated Trade Setup That Actually Works
Let's move from theory to actual trading. A solid risk reward ratio calculation is more than just a formula; it's about creating a consistent process that takes the emotion and guesswork out of your decisions. This is how you stop making hopeful bets and start identifying trade setups where the math is clearly on your side before you risk a single dollar.
Identifying a High-Probability Setup
A great trade starts with a clear reason to enter the market. Instead of just chasing price momentum, I always look for established technical patterns. For example, one of my favorite high-probability setups is buying at a confirmed support level during an uptrend. Support is simply a price zone where buyers have historically stepped in and pushed the price back up. Your job is to enter near this "floor" to give your trade a strong foundation.
- Look for Confirmation: Don't just place a buy order because the price touched a support line. I wait for a clear bullish signal, like a strong engulfing candle or a pin bar. These patterns show me that buyers are actively taking control.
- Context is Key: Is the overall market trending up? Trading with the dominant trend significantly stacks the odds in your favor. A setup that aligns with the bigger picture is always more reliable.
Setting Logical Entry and Exit Points
Once you've spotted a promising setup, it's time to define your trade with precision. Your stop-loss shouldn't be a random number plucked from thin air; it needs to be based on the chart's structure. For a long trade, a logical place for your stop-loss is just below the support level you've identified. If the price breaks below this level, your trade idea is proven wrong, and the stop-loss protects you from a much larger loss.
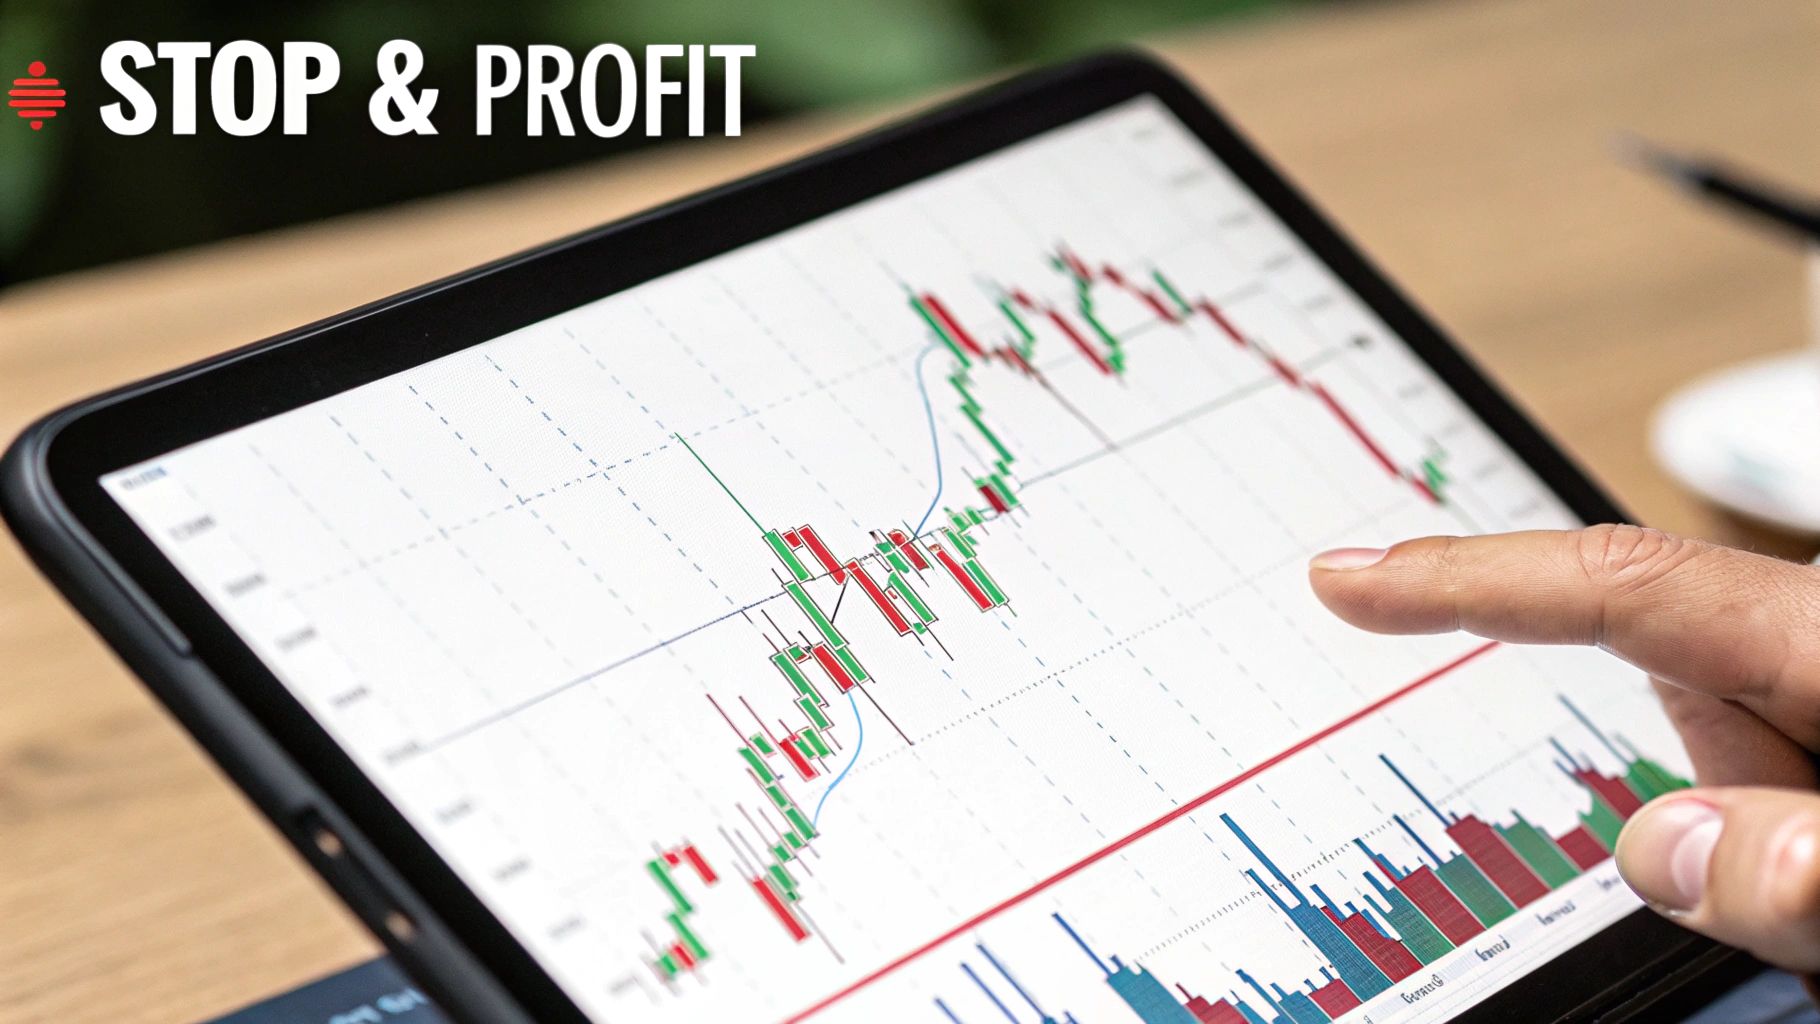
Likewise, your profit target should be placed at a sensible resistance area, such as a previous swing high. This is where sellers might regain control and push the price down. Here’s a real-world example using a chart from TradingView.

The chart above shows a trade with an entry just above a support zone, a stop-loss placed safely below it, and a profit target at the next obvious resistance level. This creates a very favorable 1:3 risk-to-reward ratio. This visual method makes the risk reward ratio calculation much more concrete and easy to see at a glance. For traders looking to build this kind of discipline into their daily routine, our guide on how to day trade for a living offers deeper strategies for developing a professional approach.
By grounding your entries, stops, and targets in the market's structure, you ensure that every trade is a calculated decision, not an emotional reaction. This disciplined process is the foundation of long-term trading success.
Advanced Strategies for Different Market Environments
One of the biggest mistakes a new trader can make is using a static risk reward ratio calculation for every trade. The market is a living, breathing thing, and your strategy needs to be just as dynamic. An aggressive 1:4 ratio might feel great in a powerful trend, but it can lead to a string of painful losses in a choppy, sideways market where price just doesn't have the legs to run that far.
The real skill lies in tailoring your expectations—and your calculations—to what the market is actually doing right now.
Adjusting Ratios for Trends vs. Ranges
When the market is in a strong trend, either up or down, you have momentum on your side. This is when you can be more ambitious with your profit targets. Aiming for a 1:3 or even 1:4 risk-to-reward ratio becomes a much more realistic goal. You can place your profit target at a distant support or resistance level and give the trade plenty of room to move in your favor.
On the other hand, when the market is stuck in a range, price action is contained between obvious boundaries. Being overly optimistic here is a quick way to see a winning trade turn into a loser because it never reached your far-off target. A more conservative approach is called for.
- For ranging markets: Try aiming for a more modest 1:1.5 or 1:2 ratio. Your profit target should be set just inside the top of the range for a long trade or near the bottom for a short trade.
- For high volatility: During major news events or company earnings announcements, volatility can explode. While this creates big moves, it also increases risk. In these scenarios, it's often wise to tighten your stop-loss and aim for smaller, quicker profits to limit your exposure. Learning to read price action signals is critical here; our guide on candlestick patterns in forex can offer some valuable pointers.
Managing Risk Across Your Portfolio
Smart risk management isn't just about individual trades; it's about looking at your entire portfolio's risk exposure. It's a hidden danger to hold multiple, highly correlated positions—like being long on several different tech stocks. If that one sector takes a hit, all your positions could suffer at once, making their individual risk-reward setups meaningless.
A large-scale analysis of market portfolios revealed something interesting: while a globally diversified portfolio had similar risk-adjusted returns to holding only equities, it provided much greater stability over the long run. This shows the power of managing correlated risk. You can explore more findings from this extensive $150 trillion market study to get a better grasp on portfolio stability.
By paying close attention to both the current market conditions and how your trades relate to each other, your risk reward ratio calculation becomes a much sharper tool for achieving consistent results.
Real Trades, Real Money, Real Results
Theory and formulas are one thing, but seeing how they perform with real money on the line is where the lesson truly sticks. Let's move past the hypotheticals and walk through a couple of my own trades to see how a disciplined risk-reward ratio calculation works in a live market environment. These examples pull back the curtain on the entire thought process, from finding the setup to making the final exit.
Case Study 1: The Winning Forex Trade (EUR/USD)
My trading scanner flagged a strong uptrend in the EUR/USD pair. It was pulling back to a key level around 1.0750, which had previously been resistance but was now showing signs of becoming support. I patiently waited for a bullish signal—a solid pin bar candle forming right on that support line—before I even considered an entry. My logic was straightforward: if this support holds, the path of least resistance is back toward the recent highs.
Here’s how the trade broke down:
- Entry: I went long (bought) at 1.0760, just above the high of that confirmation pin bar.
- Stop Loss: My exit plan for a losing trade was a stop loss at 1.0730, safely below the pin bar's wick and the support zone. This meant I was risking 30 pips.
- Profit Target: I set my take-profit order at 1.0850, just under a significant resistance area where selling pressure was likely to increase. My potential reward was 90 pips.
The risk-reward ratio calculation was simple: 30 pips of risk for 90 pips of reward, which simplifies to a crisp 1:3 ratio. The trade moved as anticipated, and I exited at my target. The real win here wasn't just the profit; it was the discipline to stick to my pre-defined plan without getting greedy or panicking during a minor dip.
Case Study 2: The Calculated Commodity Loss (Gold)
Now, let's look at a trade that didn't go my way, because losses are an unavoidable part of trading. Gold (XAU/USD) appeared to be breaking down from a tight consolidation range. I identified an opportunity to go short if it broke below a key support level at $2,320, hoping to ride the downward momentum to the next support zone.
This was the plan:
- Entry: I entered a short position at $2,318 as the price moved decisively below support.
- Stop Loss: I placed my stop at $2,328, just above the support level that had just been broken. My total risk on the trade was $10.
- Profit Target: My target was set at $2,288, a clear area of prior support. The potential reward was $30.
This was another solid 1:3 setup. However, the market had other ideas. Unexpected geopolitical news triggered a flight to safety, causing gold to reverse course and hit my stop loss at $2,328. Was this a bad trade? Not at all. It was a well-structured trade based on my strategy that simply lost. My risk-reward ratio calculation did its job perfectly by keeping the loss small and manageable.
This highlights the core reality of trading: you can have a perfect setup and still lose. The goal isn't to win every trade, but to ensure that your winning trades are mathematically larger than your losing ones. A solid risk management plan keeps you in the game, allowing you to be profitable even if you're wrong a good portion of the time.
Optimizing Your Risk Reward Approach for Consistent Profits
Knowing the basic risk-reward ratio calculation is one thing, but making it work for you is where the real skill comes in. The secret to consistent profits lies in shaping your strategy to fit your trading personality, account size, and the market's current mood. A strict 1:3 ratio might be perfect for a patient swing trader, but it could spell disaster for a scalper who thrives on frequent, smaller wins. It’s all about tailoring your approach so it feels natural, not forced.
A powerful way to do this is with dynamic position sizing. Instead of blindly risking a flat 2% of your account on every single trade, why not adjust your risk based on how confident you are in the setup? For an A+ trade with multiple confirming signals, you might risk your full 2%. But for a more speculative idea, you could scale it back to just 0.5% or 1%. This simple adjustment gives your best ideas more weight while protecting your capital from those less-certain trades.
Factoring in Real-World Trading Costs
The clean examples in textbooks often forget the little details that can slowly bleed an account dry. You absolutely have to account for real-world costs like commissions, spreads, and slippage. Let’s say your risk-reward ratio calculation shows a $10 risk for a $30 reward, a nice 1:3 ratio. But if commissions cost you $2 to get in and $2 to get out, your actual risk is now $12 and your potential reward is only $28. Your true ratio has dropped to 1:2.3. That difference might seem small, but over hundreds of trades, it adds up significantly.
This chart illustrates the classic relationship between risk and return, a fundamental concept every trader needs to internalize.
As you can see, chasing higher returns (moving right) means you must be willing to accept more risk (moving up). This principle should be the bedrock of your personal risk tolerance and how you adjust your ratios from one trade to the next.
Avoiding Hidden Portfolio Risks
Finally, be careful not to let a string of individually "good" trades create a single, massive portfolio risk. Imagine you take five separate long trades on five different tech stocks, each with a perfect 1:3 ratio. You haven't diversified; you've concentrated your risk. One piece of bad news for the tech sector could hit all five of your stop-losses at once.
Always step back and look at your portfolio for correlation. If you're already long on several stocks in one sector, maybe your next trade should be in a completely different area, like commodities or healthcare. For traders who want to dive deeper into these kinds of professional strategies, our comprehensive guide on risk management for traders offers a ton of practical advice. This portfolio-level thinking is what separates casual speculators from professional risk managers.
Your Personal Trading Success Framework
All the calculations and strategies in the world are useless without a system to apply them consistently. It’s time to build your personal framework—a systematic approach that turns the principles of a risk-reward ratio calculation into daily, profitable habits. This isn't about some secret formula; it's about creating a disciplined process that fits your specific trading goals and what you're comfortable risking.
I like to think of it as a pre-flight checklist for a pilot. Before you even think about entering a trade, you should be running through a standard set of questions. Does this setup meet my minimum risk-to-reward criteria? Where is my logical stop-loss? Is my profit target actually realistic given what the market is doing right now?
Creating Your Trading Checklist
A simple checklist can be your most powerful defense against emotional decisions. It makes you slow down and verify every piece of a trade before you put your capital on the line. Here’s a basic template to give you some ideas:
- Trend Confirmation: Is this trade going with the flow of the bigger picture (the higher timeframe trend)?
- Setup Signal: Do I have a clear price action signal, like a pin bar or an engulfing candle, at a level that matters?
- Risk-Reward Ratio: Have I done the risk-reward ratio calculation? Does it meet my personal minimum, for instance, a 1:2 or higher?
- Position Size: Is my position size calculated correctly based on my account risk rules, like my standard 1% risk per trade?
Tracking Performance Beyond Profit
To genuinely improve, you have to track more than just your wins and losses. Keeping a detailed trading journal helps you spot the hidden patterns in your own behavior. Maybe you’re consistently cutting your winners short. Or perhaps you tend to widen your stop-loss on certain types of trades. Tracking these metrics shines a light on the flaws in your execution that need fixing.
This kind of accountability system keeps you focused on long-term success, not just the outcome of a single trade. By building and sticking to this framework, you begin to treat trading less like a gamble and more like a business. To help you put these ideas into practice, check out the free resources and professional courses at Colibri Trader, which are designed to give you a clear, action-based path to more consistent trading.