




Build Pattern Recognition Skills for Price Action Trading
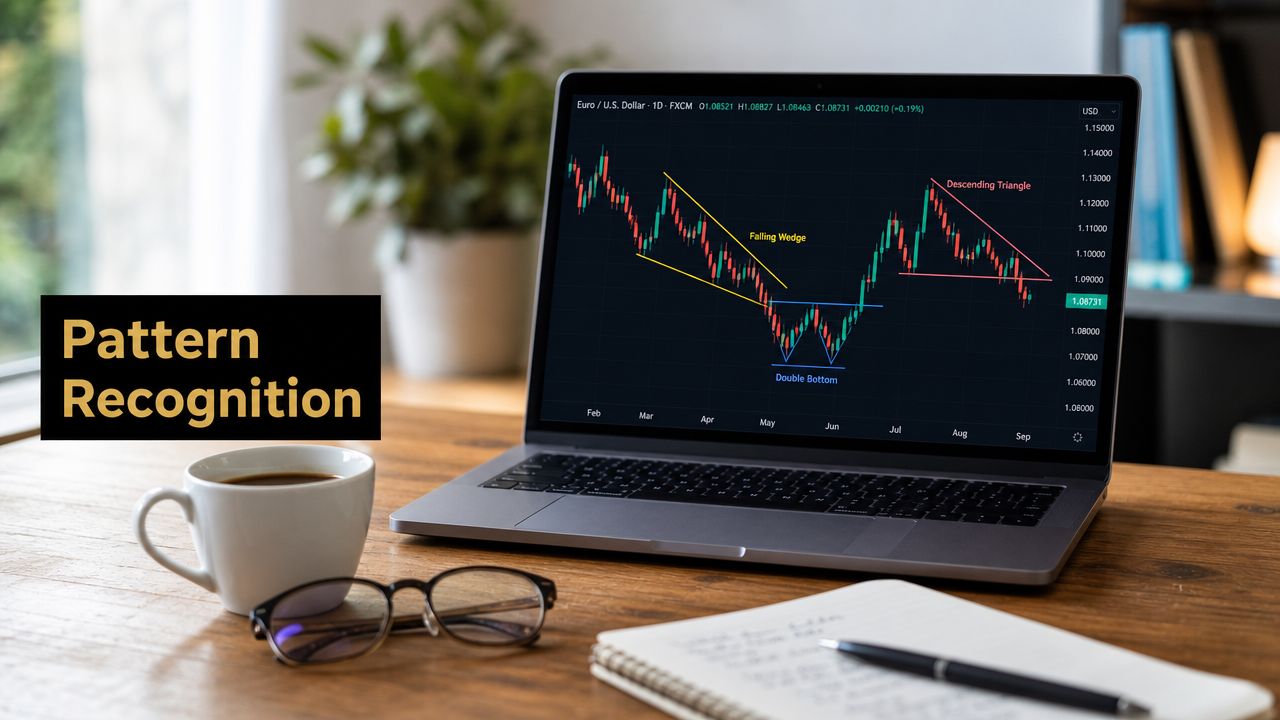
You open a chart to mark up a clean setup. Ten minutes later, you've drawn three levels, spotted two possible reversals, talked yourself into a breakout, then talked yourself out of it. Price keeps moving, every candle looks important, and somehow the more you stare, the less clear it gets.
That's where most traders are when they say they need a better strategy. In many cases, the strategy isn't the primary problem. The problem is that they haven't built the pattern recognition skills to separate a meaningful price story from random movement.
I've seen this over and over with price action traders. They aren't short on information. They're overloaded with shapes, levels, opinions, and hindsight. What changes a trader isn't memorizing more patterns. It's learning to recognize which details matter, which ones don't, and how to read the chart in context.
From Market Noise to Clear Signals
A raw chart can feel like static. Candles overlap. Wicks fake out both sides. A market that looked bullish an hour ago suddenly tags supply and rolls over. If you don't have a framework, you'll read significance into every push and pause.
That confusion is normal. Human pattern recognition is a major branch of psychology, and research summarized in this overview of pattern recognition in psychology) shows that this ability isn't fixed. It improves with deliberate practice as the brain compares new information against stored examples and contextual cues.
What this skill looks like on a chart
In trading, pattern recognition isn't an academic concept. It's the practical ability to look at price and answer a few essential questions fast:
- Where is price located relative to a meaningful level?
- Who just lost control, buyers or sellers?
- Is this movement organized or messy?
- Does this candle mean anything here, or only in hindsight?
A trader with weak pattern recognition sees shapes. A trader with strong pattern recognition sees relationships.
Most bad trades don't start with bad execution. They start with a bad read.
That's why I tell traders to stop hunting for magic candles in isolation. A pin bar in the middle of nowhere is just a candle. The same pin bar rejecting a clean level after a stretched move can carry real information.
Why most traders stay stuck
They jump straight to entries. They don't build the eye first.
If you want cleaner reads, start by studying the chart from higher time frames down. That process forces you to rank information instead of reacting to every candle. A simple top down analysis routine helps you see structure before you look for triggers, which immediately cuts a lot of noise.
The good news is that this skill is trainable. You're not born with a “trader eye.” You build it the same way any recognition skill gets built. Repetition, feedback, and exposure to the right examples.
Why Pattern Skills Are Your Trading Superpower
Price action trading lives or dies on interpretation. If you trade without indicators, you don't get a lagging tool to make the chart feel clearer. You have to read price directly, and that means your pattern recognition skills become the core engine behind every decision.
Financial markets are huge, noisy datasets. Pattern recognition became critical in fields that had to deal with large, noisy data, and its methods underpin financial signal detection, where identifying recurring structures materially affects outcomes, as described in this pattern recognition reference.

The chart has a language
Most traders think of pattern recognition as spotting formations. That's too shallow. The true job is learning the grammar of the market.
A breakout, rejection, retest, failed push, compression, and momentum shift all mean something because they describe behavior. They show how participants respond around price levels. Once you can read that behavior, you stop depending on someone else's signal group, indicator stack, or market commentary.
Here's the difference in practical terms:
| Trader habit | What it produces |
|---|---|
| Indicator dependence | Late entries, delayed exits, borrowed conviction |
| Pattern-based reading | Faster context, cleaner invalidation, independent decisions |
What strong pattern recognition gives you
It doesn't guarantee profits on every setup. Nothing does. But it gives you several advantages that compound:
- Cleaner market selection because you can tell when a chart is structured versus sloppy
- Better timing because you know when a level has reacted and when price is just flickering
- More disciplined risk because you can define invalidation from price itself
- Less mental noise because you stop inventing reasons to be in weak setups
That last one matters more than people think. A lot of inconsistency comes from psychological drift. Traders start reading what they want to see. That's why strong chart reading and mindset are connected. If you struggle with forcing trades, this guide on mastering trading psychology for consistent profits fits naturally alongside chart training.
Practical rule: If you can't explain the behavior behind the setup, you probably don't understand the setup.
Independence is the real edge
The market rewards traders who can think clearly under uncertainty. Pattern recognition helps you do that because it turns a chart from a random picture into an organized decision environment.
You stop asking, “What indicator confirms this?” and start asking, “What is price doing, where is it doing it, and what would prove me wrong?”
That shift is huge. It's the difference between reacting and interpreting.
Decoding the Market's DNA Foundational Patterns
Most traders learn patterns backwards. They memorize names first and logic second. That creates rigid chart reading, and rigid chart reading breaks as soon as the market changes shape.
The better approach is to read patterns as combinations of features. In machine learning, pattern recognition works by extracting features from data and then classifying them. For traders, that means looking at things like candlestick shape, wick size, and location, then classifying that combination as a valid setup or noise, as explained in Coursera's overview of pattern recognition.

Start with two building blocks
I care most about two layers of information:
- Candlestick behavior
- Market structure
Candlesticks show the fight inside a small window of time. Structure shows where that fight matters.
A rejection candle at random is forgettable. A rejection candle at a fresh demand zone after a selloff deserves attention. The candle is the trigger. The structure is the reason to care.
Read a pin bar the right way
Take a simple bullish pin bar.
By itself, it's just a candle with a long lower wick and a body closing higher. Traders love to label it and move on. That misses the true question. Why did price reject lower prices there?
Here's what I want to see before I classify that candle as useful:
- Location matters first. Is it rejecting demand, prior support, or a meaningful swing point?
- The wick tells the story. Did sellers push down and fail?
- The close matters. Did buyers recover enough ground to show response?
- The lead-in matters. Did price arrive with momentum, or was it already chopping sideways?
If those features line up, the pin bar becomes evidence of rejection. If they don't, it's decoration.
Add structure to the candle
Many traders improve quickly when they stop asking, “Is this a pin bar?” and start asking, “Is this a pin bar at a place where order flow could plausibly shift?”
A simple way to organize that thought process:
| Feature | What you're checking |
|---|---|
| Shape | Body size, wick length, close position |
| Location | Supply, demand, prior swing, breakout level |
| Context | Trend, momentum into level, recent reactions |
| Response | Follow-through on the next candles |
You can study named setups in resources like these forex candlestick patterns, but don't stop at labels. Use them to train your eye for behavior.
A pattern isn't the picture. It's the message inside the picture.
One clean example
Suppose price sells into a clear demand area. The move down is sharp, then a bullish engulfing candle forms. That candle doesn't matter because it's large. It matters because it shows that buyers absorbed selling pressure at a level where they had a reason to respond.
Now add one more detail. The next candle holds above the low and pushes higher. That follow-through tells you the first reaction wasn't just a random spike.
That's how strong pattern recognition skills are built. Not by collecting names, but by linking shape, location, context, and response into one read.
Actionable Drills to Train Your Trading Eyes
Recognition gets sharp through repetition, not inspiration. If you want faster, cleaner chart reads, you need drills that force your brain to sort signal from noise under controlled conditions.
This is the training block I'd give any trader who wants to improve. Do these consistently and your chart reading changes.

The blank chart drill
Strip the chart down. No indicators. No trade history. No notes from previous sessions.
Then do three things:
- Mark structure first. Identify swing highs, swing lows, and the clearest zones where price previously reacted.
- Label the path into those areas. Was price impulsive, overlapping, compressed, or exhausted?
- Wait for the trigger last. Only after context is mapped should you start looking for entry candles.
This drill teaches patience. It also shows you how often traders reverse the order and hunt signals before they understand the battlefield.
The screenshot flashcard method
Build a folder of chart screenshots. Some should be clean setups. Some should be traps. Don't label them on the front.
Flip through them fast and answer out loud:
- Buy, sell, or pass?
- Where is the key level?
- What feature makes this chart attractive or dangerous?
Then check your notes on the back. This works because quick classification forces your brain to focus on core features instead of overanalyzing.
If you want a broader feel for how pattern recognition tests work, that framework is useful. The trading version is different, but the underlying idea is similar. Repeated exposure improves speed and discrimination.
A short video can help you reset how you practice chart reading instead of just watching the market passively:
Focused backtesting beats random backtesting
Most traders backtest badly. They look at everything, record nothing, and come away with vague confidence.
Pick one setup only. For example, a bullish rejection from demand in an uptrend. Then review months of charts for that setup and log the same details every time.
Use a simple review sheet like this:
| Field | What to record |
|---|---|
| Market context | Trending, ranging, accelerating, slowing |
| Location | Fresh level, tested level, midpoint, extreme |
| Trigger | Pin bar, engulfing, break and retest |
| Outcome quality | Clean follow-through, weak bounce, immediate failure |
| Mistake note | Forced read, late entry, poor location, no confluence |
You'll notice patterns inside the pattern. Some versions work better. Some fail repeatedly. That's where real edge develops.
Journal the misses, not just the winners
A strong journal isn't a trophy cabinet. It's a diagnostic tool.
Write down:
- What you saw
- Why you thought it mattered
- What the chart looked like one candle later
- Whether the trade idea came from evidence or desire
Pattern overfitting starts to become exposed. A lot of weak trades look reasonable in the moment because the trader never documents the exact read.
Use one training environment at a time
Don't mix six markets, four time frames, and ten setups while you're building recognition. Narrow the field.
One practical route is to train with one market, one session, and two setup types for several weeks. That gives your brain stable inputs. If you want a structured way to study raw price action patterns, Colibri Trader offers courses built around candlesticks, support and resistance, and supply and demand, which fits this kind of focused training.
The trader who studies one setup deeply usually learns more than the trader who scans twenty setups loosely.
The Hidden Risk Seeing Patterns That Are Not There
You mark a level, wait for price to tap it, and spot a rejection candle that looks clean enough to trade. Ten minutes later the move stalls, chops, and stops you out. On review, the level was average, momentum was flat, and the rejection only looked strong because you wanted a trade.
That is pattern overfitting.
In real markets, the danger is not just missing a good setup. It is forcing meaning onto noise, then risking capital as if that read were objective. Price can print endless little shapes. A trader with no filter can justify almost anything.

I see this most often after a slow week or a missed winner. Traders start hunting. They zoom in, redraw structure after the move starts, and give too much weight to a single candle while ignoring the path price took into the level. The setup feels intelligent because the explanation sounds detailed. The trade is still weak.
What pattern overfitting looks like in real trading
Pattern overfitting usually wears respectable clothes. It does not look reckless on the chart.
It looks like taking a pin bar in the middle of nowhere because the wick is obvious. It looks like calling a messy three-candle bounce an accumulation pattern. It looks like buying a retest with no expansion, no urgency, and no space into the next barrier. The common thread is simple. The trader starts with the conclusion, then hunts for evidence to support it.
That habit is expensive. Financially, it creates low-quality entries with poor follow-through. Psychologically, it trains you to trust narratives more than location, structure, and behavior.
A practical filter for real signal versus invented signal
I use a short filter before every discretionary trade. If the chart fails one of these tests, I pass and move on.
Location
Price needs to be sitting somewhere that can reasonably produce a reaction. Old support turned resistance, a clean swing extreme, or a level that already mattered. A pretty candle in dead space has little value.Behavior into the level
The approach matters as much as the signal. Clean impulsive travel into an area often gives a better read than slow, overlapping chop that weakens both sides.Agreement
Structure, candle behavior, momentum, and available room should support the same idea. If one piece says long and three pieces argue caution, I do not force a vote.Risk shape
The trade needs a clear invalidation point and enough room to justify taking it. Tight stop fantasies on messy setups are one of the fastest ways traders fool themselves.
One question helps when the chart is borderline. Would I mark this setup before the signal candle printed, or am I building the case after the fact?
If the setup needs a courtroom argument, it usually does not need your money.
The real cost shows up after the loss
A bad trade from a false pattern is rarely an isolated event. It changes how traders see the next chart.
After a cluster of these trades, good setups start to look suspicious and bad setups start to look familiar. Some traders become trigger-happy because they want to win back control. Others get hesitant and miss the one clean opportunity the session offered. I have done both. Neither problem starts with execution. It starts with a contaminated read.
Strong pattern recognition is not about spotting more formations. It is about rejecting the ones that do not meet your standards, even when the market is slow and your hands want action.
Passing is part of the edge
A chart does not become tradable because you spent time staring at it. Some sessions trend cleanly. Some compress and fake in both directions. Some should be left alone.
One of the biggest improvements in my own trading came when I stopped asking whether I could label a pattern and started asking whether price had earned a trade. That shift cuts noise trades, protects confidence, and keeps your pattern recognition tied to risk, not hope.
Building Your Rules Based Trading Plan
Recognizing a pattern is only the first half of the job. The second half is converting that read into a rule set you can execute repeatedly.
Many traders falter at this point. Their eye improves, but their process stays loose. They spot a valid rejection, then enter too early, place the stop in the wrong location, or take profits at random. A rules-based plan closes that gap.
A useful reminder comes from AI research. Systems can perform very well on narrow recognition tasks, but their performance degrades when conditions shift. Humans still hold an important advantage because they can generalize and apply context, including knowing when a pattern is less likely to work in a changed environment, as discussed in this review on AI and pattern recognition.
Turn your read into execution rules
Your plan should answer four questions before the trade happens:
| Decision | Rule example |
|---|---|
| Setup definition | Price reaches a pre-marked demand zone after a directional move |
| Entry trigger | Enter only after a bullish engulfing candle closes, or on break of its high |
| Invalidation | Stop goes below the rejection low or below the demand boundary |
| Target logic | Scale at opposing structure, hold remainder only if momentum confirms |
The exact rules can vary. The key is that they're written before the trade, not improvised during it.
Keep discretion where it belongs
A rules-based plan doesn't mean robotic trading. It means controlled discretion.
For example, you may allow yourself to pass a textbook pattern if the broader environment has changed, if the level has been tested too many times, or if price is chopping into your zone instead of moving with intent. That's not breaking the plan. That's applying context.
What doesn't work is vague language like “enter when it feels right” or “take profit when momentum looks weak.” Those phrases sound flexible, but they create inconsistency fast.
Execution note: The pattern gets you interested. The rules decide whether you trade it.
Review the plan against real trades
After each trade, journal the gap between your rule set and your behavior.
Focus on three questions:
- Did the setup meet my written criteria?
- Did I execute the trigger as planned?
- If the trade failed, was it a valid loss or a rule violation?
That distinction matters. A valid loss is part of trading. A rule violation is training data. Treat them differently.
A strong trading plan makes your pattern recognition skills usable under pressure. Without that structure, even a good chart read turns into a weak decision.
If you want to sharpen your price action reading in a structured way, Colibri Trader offers a practical next step. You can start with the free Trading Potential Quiz, study the first chapters of its price action material, or use its training programs to practice candlesticks, support and resistance, and supply and demand with a rules-based approach.