


Mastering the Order Block Trading Strategy

An order block trading strategy is all about learning to see the footprints of "smart money" on your charts. We’re looking for specific price zones where large institutions have placed massive orders. Once you can spot these zones, you'll find they often become powerful areas of future support or resistance, letting you align your trades with the market's biggest players.
Decoding the Footprints of Smart Money

So, what exactly is an order block? At its core, it’s the last opposing candlestick right before a strong, impulsive move that breaks market structure. Think of it as the launchpad for a major price shift.
You have to remember, large institutions can't just dump a massive order on the market all at once without causing huge slippage. Instead, they build their positions within these specific, concentrated zones.
When price eventually circles back to that order block, the leftover unfilled institutional orders can trigger a powerful reaction. This gives us a high-probability area to plan an entry with very clearly defined risk. It's less about guessing and more about following the evidence.
The Anatomy of Bullish and Bearish Order Blocks
The concept really clicks once you can distinguish between the two types of order blocks. They are essentially mirror images of each other, but they signal opposite moves.
- A Bullish Order Block is the last bearish (down) candle before a strong, impulsive move to the upside. This zone is where institutional buyers soaked up all the selling pressure before pushing the price higher. When price returns here, it's a hot spot for demand.
- A Bearish Order Block is the last bullish (up) candle before a sharp drop. This marks a zone where institutional sellers overwhelmed the buyers, creating a supply area that can act as a brick wall of resistance if retested.
The real edge of an order block strategy is its precision. Unlike a broad support or resistance level, an order block highlights the exact candle where control flipped, allowing for much tighter stop-losses and better risk-to-reward ratios.
This whole approach boils down to finding where the big money has been active, since those areas often become pivotal in the future. For traders who get good at spotting these zones, the results can be impressive. Some traders report win rates over 60% in markets like stocks, futures, and forex by combining order blocks with volumetric data to really pinpoint where the big orders are sitting.
If this sounds familiar, you might see the parallels with other price action concepts. You can learn more about how order blocks relate to traditional supply and demand zones in our detailed guide.
Bullish vs Bearish Order Blocks at a Glance
To make spotting these on a live chart easier, it helps to have a quick reference. This table breaks down the core differences between bullish and bearish setups.
| Characteristic | Bullish Order Block | Bearish Order Block |
|---|---|---|
| Formation Candle | The last bearish (down) candle before a strong move up. | The last bullish (up) candle before a strong move down. |
| Market Signal | Indicates a potential area of strong buying demand. | Indicates a potential area of strong selling supply. |
| Location in Trend | Typically found at the bottom of a swing or after a downtrend. | Typically found at the top of a swing or after an uptrend. |
| Trader Action | Look for long (buy) opportunities when price returns. | Look for short (sell) opportunities when price returns. |
Getting these distinctions down is the first real step. Once you train your eyes, you'll start seeing these high-probability setups everywhere.
How to Find High-Probability Order Blocks

Moving from theory to a live chart is where the rubber meets the road. This is where you actually build the skill of trading order blocks. The goal isn't just to spot every last up or down candle before a big move; it's about filtering for the setups that have the best shot at working out.
A weak, poorly formed order block is just a random candle. A powerful one, though, is a clear institutional footprint.
To separate the good from the bad, I stick to a strict, three-part checklist. If a potential order block doesn't tick all three boxes, I'm not interested. Period. This discipline is what separates consistent traders from those who chase every little wiggle on the chart.
The First Clue: A Clean Break of Structure
The single most critical sign of a valid order block is a break of structure (BOS). This is completely non-negotiable. An order block is only significant because it's the origin of a move strong enough to smash through a prior market high or low, signaling a real shift in momentum.
For a bullish order block, this means the push away from it must break a previous swing high. For a bearish one, the move has to break a previous swing low.
Without that break, the candle is just noise. The BOS confirms that serious institutional weight was behind the move, making the starting point—the order block—a key area to watch for a retest.
Key Takeaway: No break of structure, no valid order block. This one rule will filter out the vast majority of weak setups and keep your focus on zones with genuine institutional backing.
The Second Signal: A Strong Impulsive Move
The nature of the move away from the order block tells a story. Was it a slow, grinding crawl? That suggests uncertainty. Or was it a sharp, powerful, impulsive move? Now you're talking. That tells you institutions stepped in with force.
This kind of strong move often creates a price imbalance, where buying or selling was so one-sided that it left behind inefficiencies in the market. This is a huge clue.
You can spot this visually:
- Look for long-bodied candles that show a clear, aggressive direction.
- See minimal wick overlap between the candles in the move.
- Get a sense of speed as price explodes away from the area.
This explosive price action confirms one side of the market was completely steamrolled. When price eventually comes back to where that move started, you can expect a similar reaction as unfilled orders get triggered.
The Final Confirmation: The Fair Value Gap
The last piece of the puzzle is the Fair Value Gap (FVG), sometimes just called an imbalance. An FVG is a three-candle pattern where the wicks of the first and third candles don't overlap, leaving a literal "gap" in the middle.
This gap represents a pocket of inefficiency where price moved so fast that orders weren't properly matched. Finding an FVG right next to your order block is an incredibly strong sign of institutional activity.
Why? Because big institutions are often the ones driving these rapid moves, and the market has a tendency to revisit these inefficient areas to "rebalance" price. An order block with an FVG attached to it becomes a magnet for price, seriously upping the odds that it will be revisited and defended. To get a better feel for how these zones work, you might also find our guide on how to identify support and resistance levels helpful.
Using order blocks is really about understanding the broader market story. Across all major markets, from forex to futures, these zones give you a peek into what the big players are doing. The most reliable order blocks are usually found on higher timeframes like the daily or weekly charts, since they represent more significant institutional positions. Once you spot those key zones, you can drill down to lower timeframes, like the 4-hour or 1-hour, to pinpoint your entry.
Executing Trades And Managing Your Risk
Spotting a high-probability order block is a fantastic first step, but real gains come from disciplined execution and sound risk control. Your charts might light up with perfect setups, but without a plan, they’re just potential.
Here’s a quick visual of the core risk management process—from pinning your protective stop-loss to locking in profits at your target.
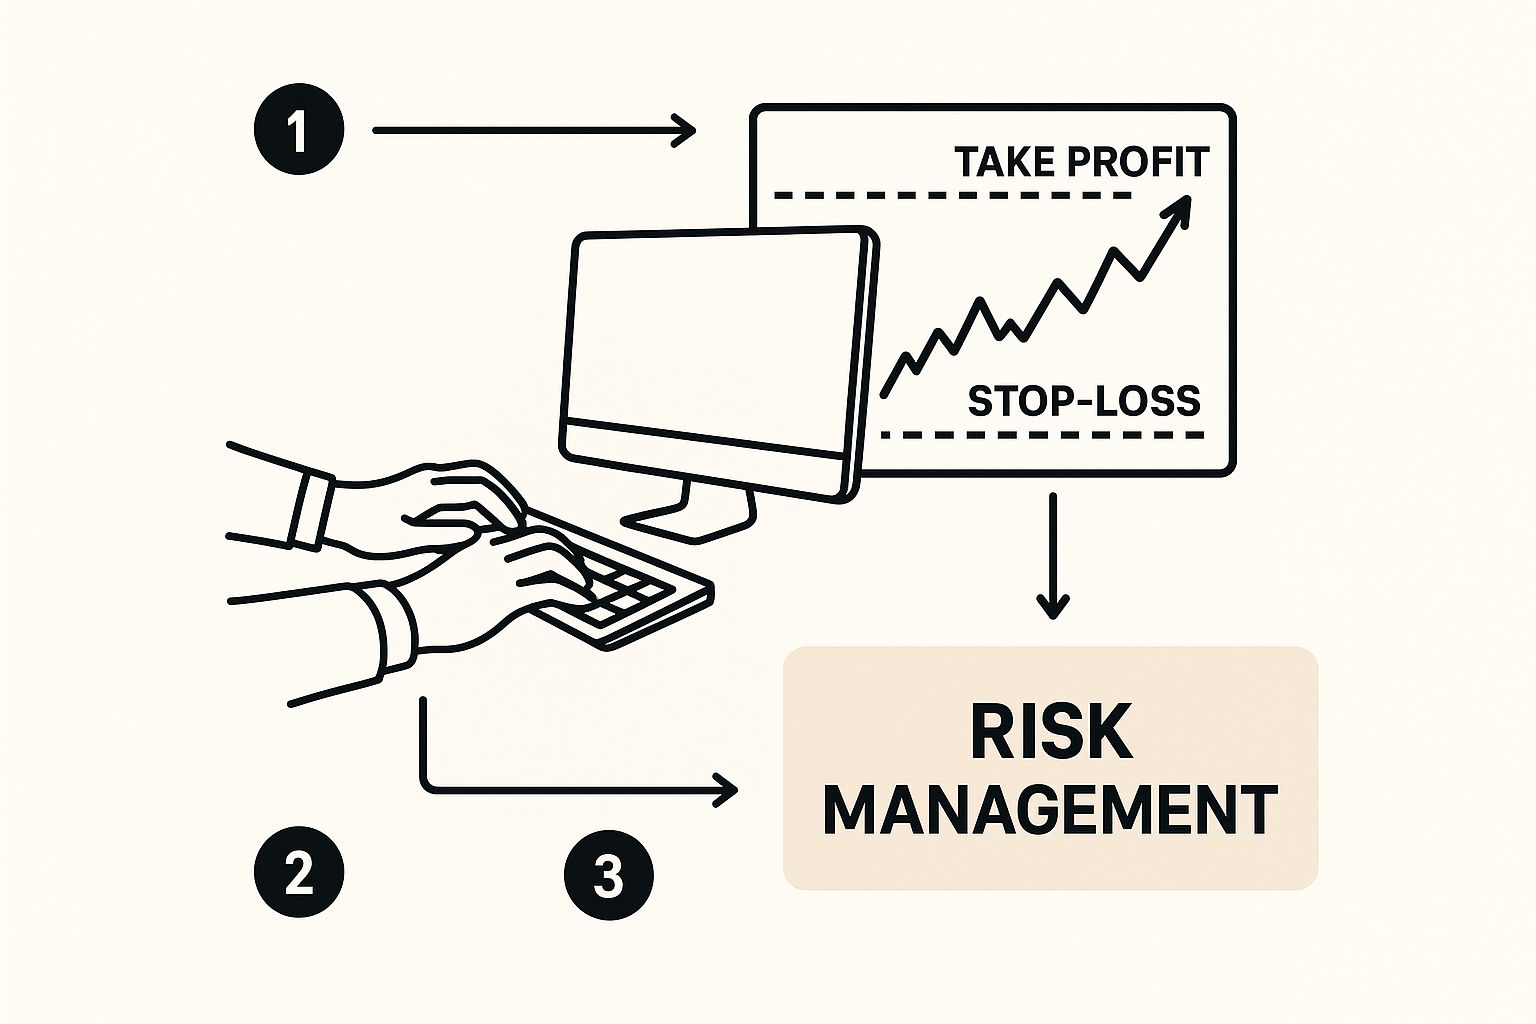
The layers you see illustrate why strict rules around entry, stop-loss, and take-profit are non-negotiable. They stop a single failed trade from wiping out weeks of winners.
Order Block Trade Execution Checklist
Before you click buy or sell, run through this step-by-step checklist to keep your trade aligned with your plan.
| Step | Action Required | Purpose |
|---|---|---|
| 1. Identify Order Block | Highlight the institutional candle zone on your chart | Pinpoint high-probability supply or demand zones |
| 2. Confirm On Lower Timeframe | Spot a break of structure on a 15-minute or 5-minute chart | Validate genuine buying or selling pressure |
| 3. Set Stop-Loss | Place your protective stop just beyond the block’s wick | Exit before a bad trade deepens your loss |
| 4. Define Take-Profit | Target the next swing high (long) or swing low (short) | Align profit objectives with market structure |
| 5. Verify Risk-Reward | Check for at least 2:1 reward-to-risk before entry | Preserve an edge by ensuring winners outgrow losers |
Keep this checklist handy each time you set up an order block trade. It’s your blueprint for consistency.
Defining Your Entry Trigger
Entry isn’t just about price touching a highlighted zone. It’s about waiting for the market to nod—literally.
Imagine spotting a bullish order block on a 4-hour chart. Instead of guessing, let price dip into that zone. Then switch to your 15-minute or 5-minute window. You want to see a fresh break of structure—like a 15-minute swing high giving way in your direction. That snap on the lower timeframe confirms real buying interest at your level.
By waiting for a lower-timeframe confirmation, you're essentially getting a green light from the market that your initial analysis was correct. This simple step filters out many trades where price just slices right through an order block without hesitating.
Placing Your Stop-Loss Correctly
A stop-loss is your safety net—where you admit you were wrong and step aside. The sweet spot? Right beyond the order block’s extreme wick.
- For a bullish order block, place the stop a few pips below the candle’s low.
- For a bearish order block, move it a few pips above the candle’s high.
That extra buffer lets the trade breathe without giving up unnecessary ground. If the market clears that institutional candle, you know the setup no longer matters. For more on fine-tuning this skill, check out our complete guide on how to set a proper stop-loss.
Setting Realistic Take-Profit Targets
Never guess at your exit—map it to market structure. Good take-profit levels sit near opposing liquidity clusters, often found at prior swing highs or swing lows.
These areas draw in orders and act like magnets. By aiming for a 2:1 or 3:1 relationship between reward and risk, you let your winners comfortably outpace your losers. For deeper insights on profit targets and technical analysis, check out Quantified Strategies.
Effective risk management ties into a broader how to conduct risk assessment framework. That bigger lens helps you size positions, set stops, and plan exits so that every trade fits neatly into your overall plan.
Now review your chart, run the checklist, and trade with confidence—because a strategy without execution discipline is just a nice idea.
Advanced Order Block Trading Techniques
Once you've got the basics down, it's time to start layering in more advanced concepts. This is where you can really sharpen your edge. We're going to move beyond just spotting a zone and start looking at how order blocks fit into the bigger picture of market dynamics, like liquidity and multi-timeframe trends.
This isn't about making things more complicated. It’s about adding clarity and building a complete story for every trade you take.
Harnessing Multi-Timeframe Analysis
One of the biggest mistakes I see traders make is getting tunnel vision on a single chart. They find an order block and trade it in a vacuum, completely ignoring the larger market environment. The real power comes from a top-down approach.
I always start my analysis on the daily or 4-hour chart. The goal here is simple: figure out the market's overarching story. Is the trend bullish or bearish? Where are the major, institutionally-backed supply and demand zones?
Only after I have a clear higher-timeframe bias do I drill down to a smaller chart, like the 15-minute, to look for an entry.
- Higher Timeframe (HTF): Use the daily or 4-hour chart to find a high-probability order block that lines up with the dominant trend.
- Lower Timeframe (LTF): Drop to the 15-minute or 5-minute chart and wait patiently for price to reach your HTF zone. You're looking for confirmation here—often a smaller break of structure on the LTF which signals the bigger move is about to continue.
Following this process keeps you from fighting the current. You're essentially using the big map to find your location and a magnifying glass to pinpoint your entry.
A 15-minute bullish order block sitting inside a daily demand zone is exponentially more powerful than one appearing in isolation. This layering of timeframes is a cornerstone of consistent trading.
Trading Breaker and Mitigation Blocks
Let's be real: not every order block is going to hold. But when a level fails, it doesn't just become useless. It often transforms into a completely new kind of trading opportunity. This is where breaker and mitigation blocks come into play.
A breaker block is created when price runs liquidity (say, by taking out a swing low) but then fails to continue down. Instead, it reverses hard and breaks market structure in the opposite direction. That original order block that failed to hold now becomes a "breaker"—a very potent zone to trade from when price pulls back to it.
A mitigation block is a bit different. It forms when a swing point fails to take out a major high or low but still causes a break of structure. Think of it as a zone where institutions had to "mitigate" or offload their losing positions. These areas also tend to act as strong support or resistance when retested.
Learning to spot these variations allows you to capitalize on failed setups. You can turn what might have been a loss into a fresh, high-probability trade.
The Critical Role of Liquidity
Liquidity is the fuel that makes the market move. Period. It's all the stop-loss orders and pending entries that build up above old highs and below old lows. Smart money knows this, and they will intentionally drive price toward these pools of liquidity to get their massive orders filled.
A truly high-probability order block is one that is formed as part of a "liquidity grab." This means the move that created the block first swept liquidity from a nearby high or low before creating a strong, impulsive move away.
When you see an order block form right after a clean liquidity sweep, its chances of holding go up dramatically. This also gives you a logical place for your profit target: the next opposing pool of liquidity. It provides a structured way to manage the entire trade, from start to finish.
Of course, to really get a feel for these concepts and build confidence, you have to backtest your order block strategy against historical data. This is the only way to see how these setups play out in real market conditions and truly make them your own.
Common Traps That Will Wreck Your Order Block Strategy
Knowing the rules for trading order blocks is one thing. Knowing what not to do is where the real money is made. I've seen countless traders learn the basics, get excited, and then fall into the same predictable traps that drain their accounts and crush their confidence.
These mistakes usually boil down to impatience, a fuzzy understanding of the bigger picture, or just plain over-eagerness. Think of this as your field guide to the most common errors. By spotting them now, you'll save yourself a lot of pain and build the discipline this strategy demands.
Trading Every Candle That Looks Like a Block
This is, without a doubt, the number one mistake I see. A trader learns the definition—the last up/down candle before a big move—and suddenly their chart is littered with highlighted zones. This is a fast track to disaster.
Most of those candles are just noise, not genuine institutional footprints. You can't just slap a box on any old candle and expect it to work. A real, high-probability order block has a very specific signature. It needs that powerful move away from it, the one that creates a break of structure (BOS) and leaves behind an imbalance (or FVG). Without those key ingredients, you're just guessing.
The goal isn't to find the most trades. It's to find the best trades. Chasing every potential setup is the quickest way to overtrade and burn out. Quality over quantity is everything here.
Before you even think about placing an order, run through a strict mental checklist. Make these criteria non-negotiable.
- Is there a clean break of structure? The move away must snap a clear swing high or low. No debate.
- Is there a price imbalance (FVG)? Can you see that obvious gap where price shot off aggressively?
- Does it fit the higher timeframe story? A bullish block in the middle of a screaming daily downtrend is a sucker's bet.
Ignoring the Higher-Timeframe Trend
This is a close second for account-killers. You spot a picture-perfect bullish order block on the 15-minute chart. It has the BOS, the FVG, everything. You go long, feeling confident. Then, bam! You're stopped out almost instantly.
What happened? You failed to zoom out. You were buying directly into a massive supply zone on the daily chart where the big players were waiting to sell. You were trying to swim against a tidal wave.
The higher-timeframe trend is the current. Fighting it is exhausting and almost always a losing battle. The highest-probability trades, the ones that really pay off, are the ones that flow with that current.
The Dangers of Impatience and FOMO
Trading psychology is where the war is truly won or lost. Once you learn this strategy, the urge to find a setup right now can be overwhelming. This pressure leads you to force trades on mediocre setups or, worse, jump the gun before price has even reached your zone.
Fear Of Missing Out (FOMO) is a trader's worst enemy. You see price rocketing toward your order block and panic, thinking, "I have to get in now or I'll miss it!" This undisciplined entry gets you a terrible price and forces you to use a wider, less effective stop-loss.
Here's how you build the discipline to beat it:
- Let the price come to you. Period. If the market doesn't retrace to your pre-defined zone, there is no trade. Close the chart and walk away. Another opportunity is always just around the corner.
- Wait for confirmation. Don't just set a limit order and pray. Watch what happens when price arrives. Look for a reaction on a lower timeframe—a sharp rejection wick, a tiny break of structure—to confirm that buyers or sellers are actually showing up to defend the level.
- Learn to be okay with missed trades. It's just part of the game. Missing a winner is infinitely better than taking a loser because you couldn't control your impatience.
Avoiding these mistakes takes more than just technical skill; it requires a ton of patience and rock-solid discipline. By focusing only on A+ setups, always respecting the market's bigger direction, and mastering your own emotions, you'll turn this simple concept into a seriously powerful trading tool.
Frequently Asked Questions
When you're trying a new trading method, questions are a great sign—it shows you’re really digging in and thinking things through. Trading with order blocks is no different.
Let's walk through some of the most common questions I hear from traders. Getting these details right can be the thing that separates a setup you see from a setup you actually know how to trade well.
What Is the Best Timeframe for Order Blocks
There’s no single “best” timeframe because it really has to sync up with your own trading style. A day trader might live on the 15-minute chart, while a swing trader will get a lot more from the 4-hour or daily charts.
But here’s a powerful approach that works for a lot of traders: multi-timeframe analysis.
What you do is find the major, significant order blocks on higher timeframes like the 4-hour (H4) or Daily. This is where the big institutional money leaves its footprints. Then, you can drill down to a lower timeframe like the 15-minute (M15) or 5-minute (M5) to really nail your entry when price pulls back into that bigger zone. It's a great way to align your trade with the larger market picture while still getting a super-refined entry.
How Are Order Blocks Different from Support and Resistance
They might seem related, but order blocks are way more specific than your classic support and resistance levels. A standard S/R level is usually just a broad price area or a horizontal line you draw across a few highs or lows. It's a general zone.
An order block, on the other hand, is the specific last candle right before a big, market-structure-breaking move. It’s pointing you to a very precise concentration of institutional orders. That difference is everything, because it lets you use much tighter stop-losses and gives you crystal-clear entry points. You're not just trading a general area of past interaction; you're targeting the very origin of the move.
The precision of an order block is its greatest strength. Instead of a wide zone, you get a defined candle, which often translates into superior risk-to-reward opportunities.
Can I Use Indicators with Order Blocks
At its heart, the order block trading strategy is all about pure price action. You can absolutely trade it effectively on a completely clean chart—many of the best traders do.
That said, certain indicators can add some valuable confluence, which is just another way of saying "supporting evidence" for your trade idea.
For example, a volume profile tool can be fantastic for checking if an order block is significant. If you see a high volume node (an area with a lot of trading activity) right inside your order block, that adds a lot of weight to the setup.
The key is to never let an indicator be the reason you take a trade. Always start with market structure and liquidity. Think of indicators as a secondary confirmation, not the main event.
What Is a Good Risk to Reward Ratio
This is where the order block trading strategy really shines. Because it's so precise, it naturally creates opportunities for fantastic risk-to-reward (R:R) ratios.
Your entry can be incredibly specific (like the 50% level of the order block's body), and your stop-loss is placed just a few pips beyond the block's wick. This means your risk is small. This structure makes it completely achievable to aim for a minimum R:R of 1:3. Honestly, it's not uncommon to see setups that align with the higher-timeframe trend offer potential returns of 1:5, 1:10, or even more. The rule is simple: always make sure the potential reward is worth the risk before you jump in.
At Colibri Trader, our goal is to help you master price action with clear, straightforward guidance. Our programs are built to give you a real edge in the markets, cutting through the clutter of indicators and overly complex analysis. Ready to see what you're capable of? Discover your trading potential with our free quiz at https://www.colibritrader.com.