


A Price Action Guide to Trading the Long Leg Doji
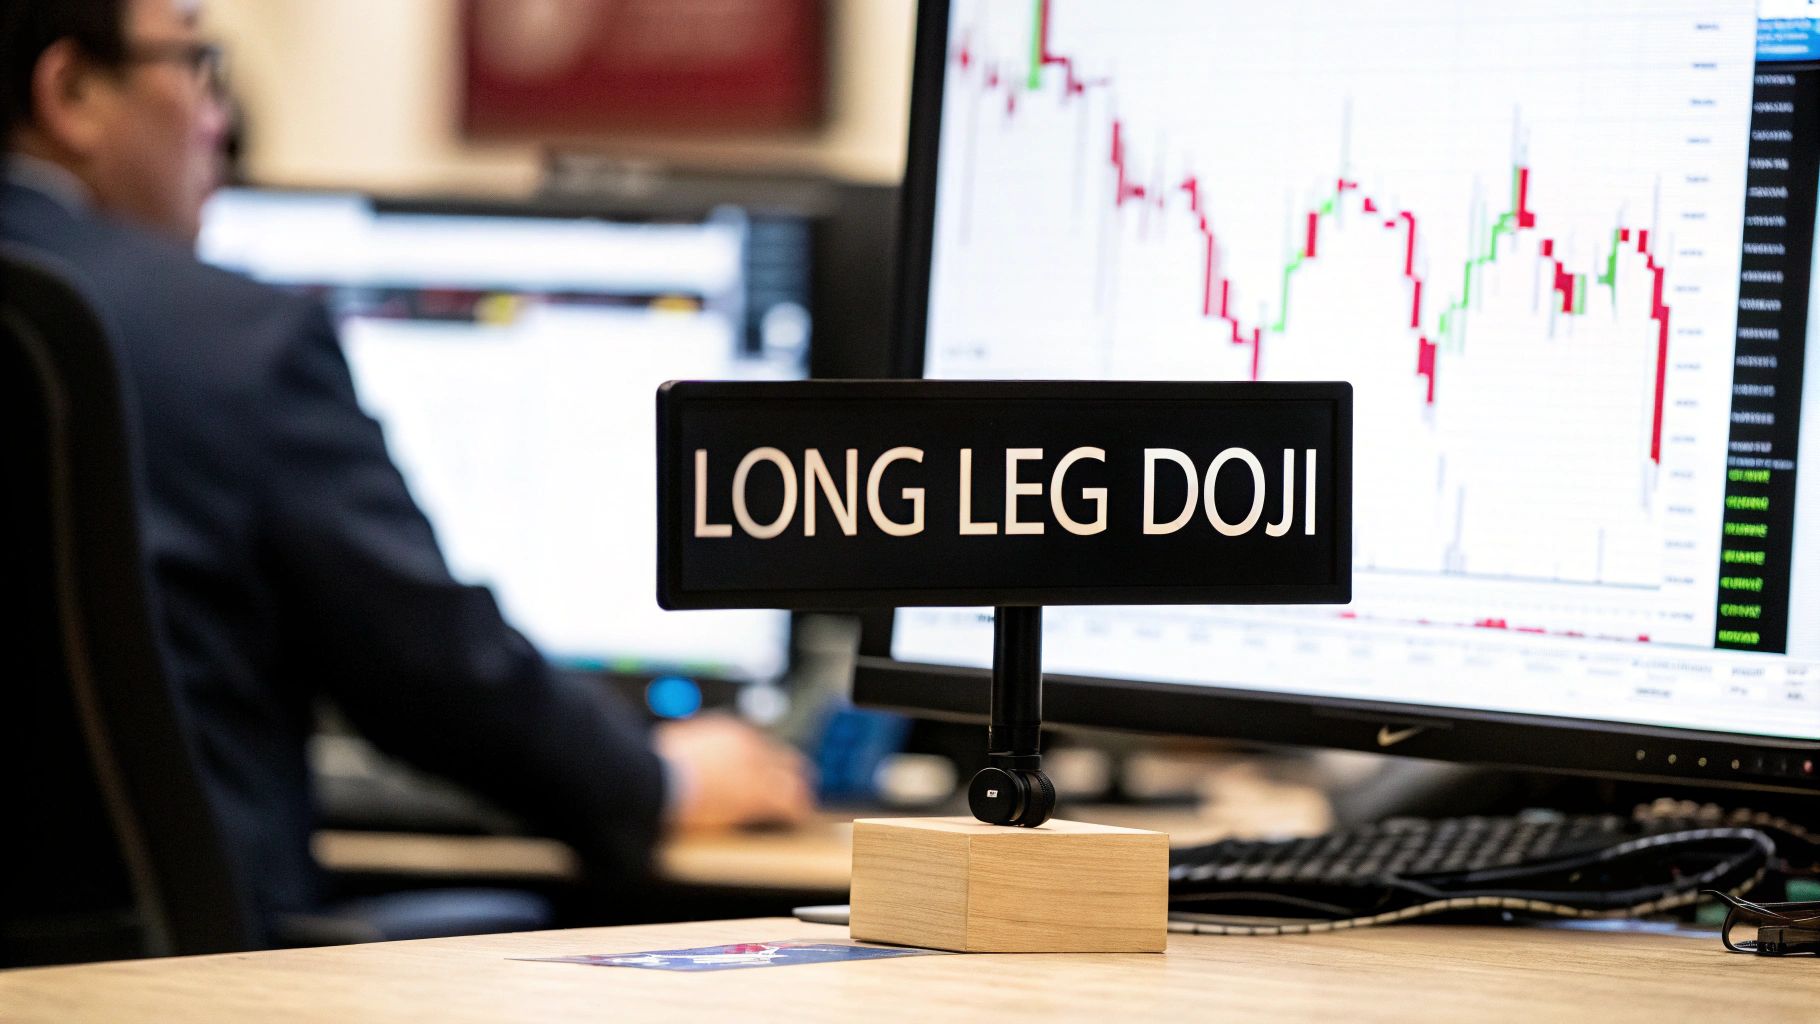
Defining the Long Leg Doji
The long leg doji captures a moment of pure hesitation on a price chart. You’ll spot it by its minuscule body and remarkably long wicks stretching both above and below. In essence, it tells the story of buyers and sellers tugging at price yet ending in a deadlock.
A Tug-Of-War In The Market
Think of two teams playing tug-of-war on a slick surface—each side lunges forward, but neither gains ground. That’s exactly what unfolds during the period represented by a long leg doji. Prices surge up, plunge down, and then return to nearly the same spot, leaving only a thin line for the body and towering wicks as evidence of the fight.
Anatomy Of The Long Leg Doji
Breaking it down further:
Tiny Body
Indicates the open and close prices are virtually identical.Long Upper Wick
Shows buyers drove price high before giving way.Long Lower Wick
Signals sellers dragged price down but couldn’t stick.
Before we proceed, here’s a quick reference:
Long Leg Doji at a Glance
| Component | Appearance | Market Psychology Interpretation |
|---|---|---|
| Body | Very small or non-existent | Buyers and sellers reach a stalemate |
| Upper Wick | Extended length | Aggressive buying effort that ultimately faltered |
| Lower Wick | Extended length | Strong selling push that failed to maintain momentum |
This snapshot highlights how each part of the pattern reflects intense—and unresolved—market pressure.
Why Indecision Matters
When you see a long leg doji at the climax of an uptrend or the bottom of a downtrend, take notice. It often marks a turning point where the prevailing force has exhausted itself. In major benchmarks like the S&P 500 or the EUR/USD pair, traders have observed this pattern right before sharp reversals or consolidation.
“A long leg doji serves as a warning sign. It tells you that the market’s previous consensus is breaking down, and a potential shift in direction could be imminent.”
While the long leg doji highlights extreme indecision, pairing it with more specific reversal signals can improve your edge. For instance, studying the bearish cues in the Gravestone Doji Candlestick may sharpen your timing at tops or major resistance levels.
The Psychology Behind the Wicks
If you want to truly understand the long leg doji, you have to look past the lines on a chart. This pattern isn't just a technical signal; it's a story about a fierce battle between optimism and fear, all crammed into a single trading session.

Think about how the session unfolds. It often kicks off with a burst of confidence from one side. In an established uptrend, buyers are feeling good and aggressively push the price to new highs. This rally creates the long upper wick—a visual record of their initial power.
But this peak is often a point of exhaustion. At these higher prices, sellers suddenly spot an opportunity. Whether they're taking profits off the table or betting on a reversal, they jump into the market with enough force to completely overwhelm the buyers.
The Fierce Reversal
This is where the long leg doji gets interesting. The selling pressure becomes so intense that it doesn't just wipe out all the buyers' gains; it drags the price all the way down to new session lows. This aggressive move south forms the long lower wick, showing that fear has taken the driver's seat.
But the fight isn't over yet. Down at the session's low, buyers who missed the first rally might see the dip as a bargain and step back in. This flicker of buying interest is just enough to lift the price off its lows. For a deeper dive into what this kind of market indecision means, you can learn more about what a doji candle signifies in our detailed guide.
The result is a dramatic stalemate. Despite the wild price swings and high volatility, neither bulls nor bears could land a knockout punch by the end of the session. The price closes almost exactly where it started.
What This Deadlock Means for You
This intense tug-of-war gives you a critical piece of market intelligence: the prevailing trend is losing its conviction. The long wicks prove that both high and low prices were decisively rejected by the market. It’s a clear signal of equilibrium where the market is hitting the pause button to figure out its next move.
Understanding this psychological battle is key. The long leg doji is more than just a pattern; it’s a footprint of market exhaustion and deep uncertainty. It’s a warning sign that the dominant force is getting tired, and a significant move could be just around the corner as the market searches for a new direction.
How to Identify a Genuine Long Leg Doji
Spotting a candle that looks like a long leg doji is the easy part. The real skill is knowing if it’s a genuine, high-probability signal or just market noise. This is one of those distinctions that separates traders who get by from those who truly excel.
Think of it like a distress flare fired from a ship. A flare seen in the middle of a busy port doesn't mean much—it's just noise. But a single flare spotted far out in the open ocean after a long voyage? That demands your immediate attention. Context is everything.
The Anatomy Checklist
Before you even consider the market environment, the candle itself has to pass a visual test. A true long leg doji has a distinct, almost exaggerated look that makes it stand out from your average indecision candle.
Here’s what you absolutely need to see:
- Nearly Flat Body: The open and close prices should be almost identical. A tiny body might be acceptable, but the best examples have a body that looks more like a thin horizontal line.
- Exceptionally Long Wicks: This is non-negotiable. Both the upper and lower wicks (or shadows) must be significantly long, showing the extreme volatility and the fierce tug-of-war that happened during that session.
- Symmetrical Wicks (Ideally): While not a hard-and-fast rule, the most powerful long leg doji patterns often have upper and lower wicks that are roughly equal in length. This symmetry shows a perfect balance of rejected highs and lows.
As a simple rule of thumb, the total height of the candle—from the tip of the upper wick to the bottom of the lower one—should be dramatically larger than the average candles around it.
Context Is the Deciding Factor
Once a candle ticks all the structural boxes, its location on the chart is what gives it meaning. A long leg doji that pops up in the middle of a choppy, sideways market is pretty much useless. It just confirms what you already know: the market has no direction.
However, its predictive power skyrockets when it appears in two key places:
- After a Sustained Trend: A long leg doji is at its most potent when it forms after a strong, extended uptrend or downtrend. It’s a huge signal that the momentum driving that trend is finally running out of gas.
- At a Key Support or Resistance Level: When this pattern prints right on a well-established support or resistance zone, it’s like a flashing neon sign. It confirms the level is holding and that a reversal is very much on the table. For a deeper dive into chart patterns, check out our guide on understanding candlestick charts.
For a real-world example, look at the EUR/USD daily chart from July 14, 2022. A long leg doji appeared after a grueling five-week downtrend. Its shadows covered 1.2% of volatility, and in the ten days that followed, the pair shot up 4.5%. This move, confirmed by a spike in volume, perfectly illustrates the reversal power of this pattern when it shows up in the right context. Traders can get better at spotting these setups by focusing on high wick-to-body ratios and steering clear of lower timeframes where the signals are less reliable. You can find more insights on these findings at heygotrade.com.
Actionable Trading Strategies for the Long Leg Doji
Spotting a long leg doji is one thing, but turning that observation into a solid trade? That requires a clear, disciplined game plan. This candlestick isn’t a direct order to buy or sell. Think of it more as a yellow traffic light—a signal that the market has hit a critical decision point.
The most important rule, one you should never break, is to never trade the long leg doji in isolation. Jumping in on the doji candle itself is just a guess. Instead, smart traders wait for a confirmation candle. That’s the very next candle to form after the doji.
This next candle is your real entry signal. Its behavior tells you who won the battle—the buyers or the sellers. By waiting, you’re no longer flipping a coin; you’re making a calculated, evidence-based decision.
Strategy 1: The Trend Reversal Entry
The classic way to trade a long leg doji is to look for a trend reversal. When this pattern shows up after a long, sustained run, it’s like the market is hitting the brakes, signaling that the current momentum is running on fumes. The candle that follows is your trigger.
- For a Bullish Reversal (After a Downtrend): You'll wait for the confirmation candle to close above the high of the long leg doji. This is your proof that buyers have soaked up all the selling pressure and are ready to take charge. Your entry is triggered as the price moves past that high.
- For a Bearish Reversal (After an Uptrend): Here, you wait for the confirmation candle to close below the low of the long leg doji. This confirms that sellers have wrestled control from the buyers and are set to drive the price down. Your entry happens as the price breaks below that low.
This simple decision flow helps you figure out if the long leg doji is truly signaling a change in direction or just a momentary pause.
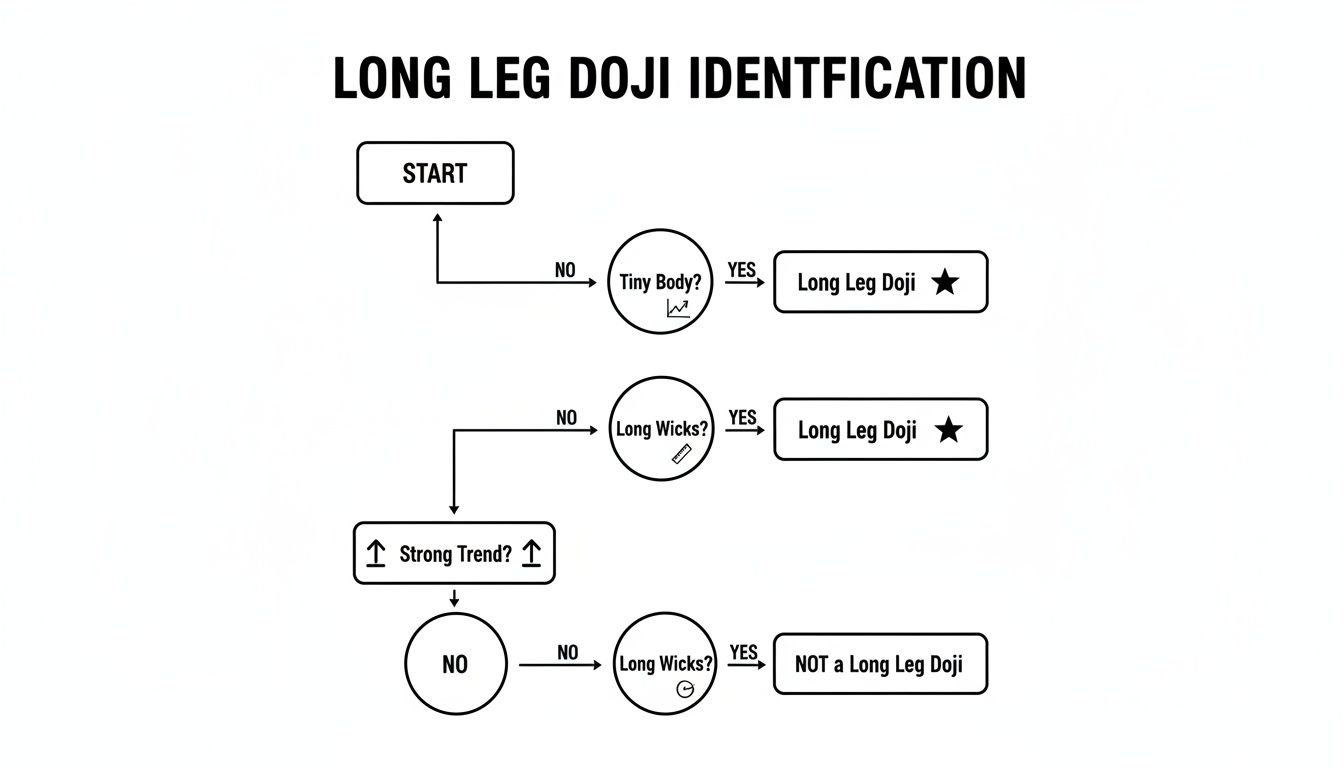
This flowchart nails the visual checklist: a tiny body, long wicks, and a strong prior trend are the key ingredients for a valid signal.
Strategy 2: The Continuation Breakout Entry
It's less common, but a long leg doji can also signal that the trend is about to continue, especially during a consolidation phase. Picture a market that’s been climbing, pauses to trade sideways for a bit, and then forms a long leg doji near the top of that range.
In this case, the doji represents that final moment of doubt before the dominant trend kicks back into gear. A strong bullish candle that breaks above the high of the doji and the top of the consolidation range is a powerful continuation signal. It suggests the uptrend is ready for its next leg up. The same logic holds true in a downtrend.
A long leg doji in a consolidation zone is like a coiled spring. The breakout that follows often releases significant pent-up energy, leading to a swift and powerful price move.
Essential Risk Management Rules
No strategy is worth its salt without rock-solid risk management. The moment you enter a trade based on that confirmation candle, you need to know exactly where your protective stops and profit targets are.
Your stop-loss placement is non-negotiable; it's what protects your capital.
- For a Long (Buy) Position: Place your stop-loss just below the low of the long leg doji.
- For a Short (Sell) Position: Place your stop-loss just above the high of the long leg doji.
These levels are your line in the sand. If the price hits them, your trade idea was wrong, and it's time to get out.
Setting profit targets can be a bit more flexible. A good starting point is to aim for a risk-to-reward ratio of at least 1:2. You could also target the next major support or resistance level. For a deeper dive, you can learn more about setting effective stop-loss and take-profit levels in our detailed guide.
Common Mistakes to Avoid When Trading This Pattern
Spotting a long leg doji is a great start, but even the best-looking signals can turn into losers if you fall into a few common traps. So many traders see this candle, get excited, and immediately jump in—a mistake that can drain an account faster than you can blink.
The single biggest error is trading the doji candle in isolation. Think of it this way: a doji is a sign of a tie, a perfect stalemate between buyers and sellers. It's not a confirmed reversal. Jumping into a trade the second a doji closes is like betting on who won the game during halftime. You're just guessing.
You absolutely have to wait for the next candle for confirmation. That following candle is what tells you who actually won the battle after the temporary truce.
Ignoring The Bigger Picture
Another huge mistake is ignoring where the doji shows up. A long leg doji appearing in the middle of a messy, sideways market is pretty much meaningless. All it does is confirm the confusion that's already there; it has no real predictive power.
A long leg doji’s signal is only as strong as its location. A doji at a major support or resistance level after a long trend is a high-probability signal. One floating in random price action is just noise.
The power of this pattern comes from the story it tells—the story of a trend running out of steam. If there's no clear trend leading up to the doji, there's no story to tell. Ignoring that is like reading a single word and trying to guess the rest of the book.
The Problem With Lower Timeframes
Finally, a lot of traders get tripped up by seeing long leg dojis all over the lower timeframes, like the 1-minute or 5-minute charts. Sure, they pop up frequently, but they're far less reliable and often just lead to false signals. On these charts, market "noise" and high-frequency trading bots can create these patterns without any real shift in market sentiment.
To sidestep these traps, stick to the higher timeframes where the signals are much cleaner and more meaningful:
- Daily Charts: This is the sweet spot for catching significant, powerful shifts in momentum.
- 4-Hour Charts: A great middle-ground for swing traders. It filters out most of the intraday noise but still offers plenty of opportunities.
- Weekly Charts: When a doji appears here, it's signaling a major, long-term turning point. Pay close attention.
By focusing on higher timeframes, you're making sure the indecision you see reflects a genuine tug-of-war between the big players, not just short-term chop. It’s the kind of discipline that separates strategic trading from impulsive gambling.
A Few More Questions About the Long Leg Doji
Even after you've got the basics down, a few common questions always pop up. Let's tackle them head-on to clear up any confusion before you start looking for this pattern on your charts.
What Is the Best Timeframe to Trade the Long Leg Doji?
Stick to the higher timeframes. I’m talking about the daily, 4-hour, or even the weekly charts. A doji on these charts isn't just noise; it represents a serious battle between buyers and sellers over a meaningful period. That gives its signal a lot more weight.
Sure, you’ll see these patterns on the 15-minute or 1-hour charts, but they're far more likely to be random market "noise." They can whip you in and out of trades with false signals. A good rule of thumb for any price action trader is simple: the higher the timeframe, the more significant the signal. It’s the easiest way to filter out the meaningless chatter.
Does a Long Leg Doji Always Signal a Reversal?
Absolutely not, and this is probably the most important thing to burn into your memory. A long leg doji signals indecision, plain and simple. It’s a giant question mark. It tells you the market has slammed on the brakes and the previous trend has run out of steam.
The long leg doji is the question, not the answer. The next candle is the market shouting back who won the fight.
The reversal is only suggested by what happens after the doji forms. If price breaks above the doji's high following a downtrend, you have a potential bullish reversal. If it breaks below the low after an uptrend, you have a potential bearish reversal. This is exactly why waiting for that confirmation candle isn't just a suggestion—it's a non-negotiable rule.
How Is a Long Leg Doji Different From a Standard Doji?
It all comes down to the wicks. A standard doji also has that tiny, wafer-thin body, but its wicks are pretty short. It signals a moment of quiet indecision, like the market is taking a quick nap.
The long leg doji is pure drama. Its wicks are exceptionally long, showing that a massive, high-volatility tug-of-war took place between bulls and bears during that session. They fought hard, pushed the price way up and way down, but ultimately ended right back where they started. This intensity is what gives the long leg doji its power. It signals that a major conflict just ended in a stalemate, which often precedes a powerful, decisive move.
Can a Long Leg Doji Signal Trend Continuation?
Yes, it can, though it's much more famous for spotting reversals. In the right context, a long leg doji can act as a continuation pattern. This usually happens when the market is consolidating or pausing within a strong, established trend.
Imagine a stock is in a clear uptrend but then starts trading sideways for a few bars. If a long leg doji appears inside that choppy range, it can represent the market taking one last deep breath before continuing its climb. A bullish candle breaking above the doji's high would confirm the trend is back on, often with a fresh burst of energy. As always, context and confirmation are everything.
Ready to stop guessing and start trading with confidence? At Colibri Trader, we teach a straightforward, price-action based approach that works in any market. Discover your trading potential with our free quiz today!