


Inverted Hammer Candlestick Pattern: A Trader’s Guide
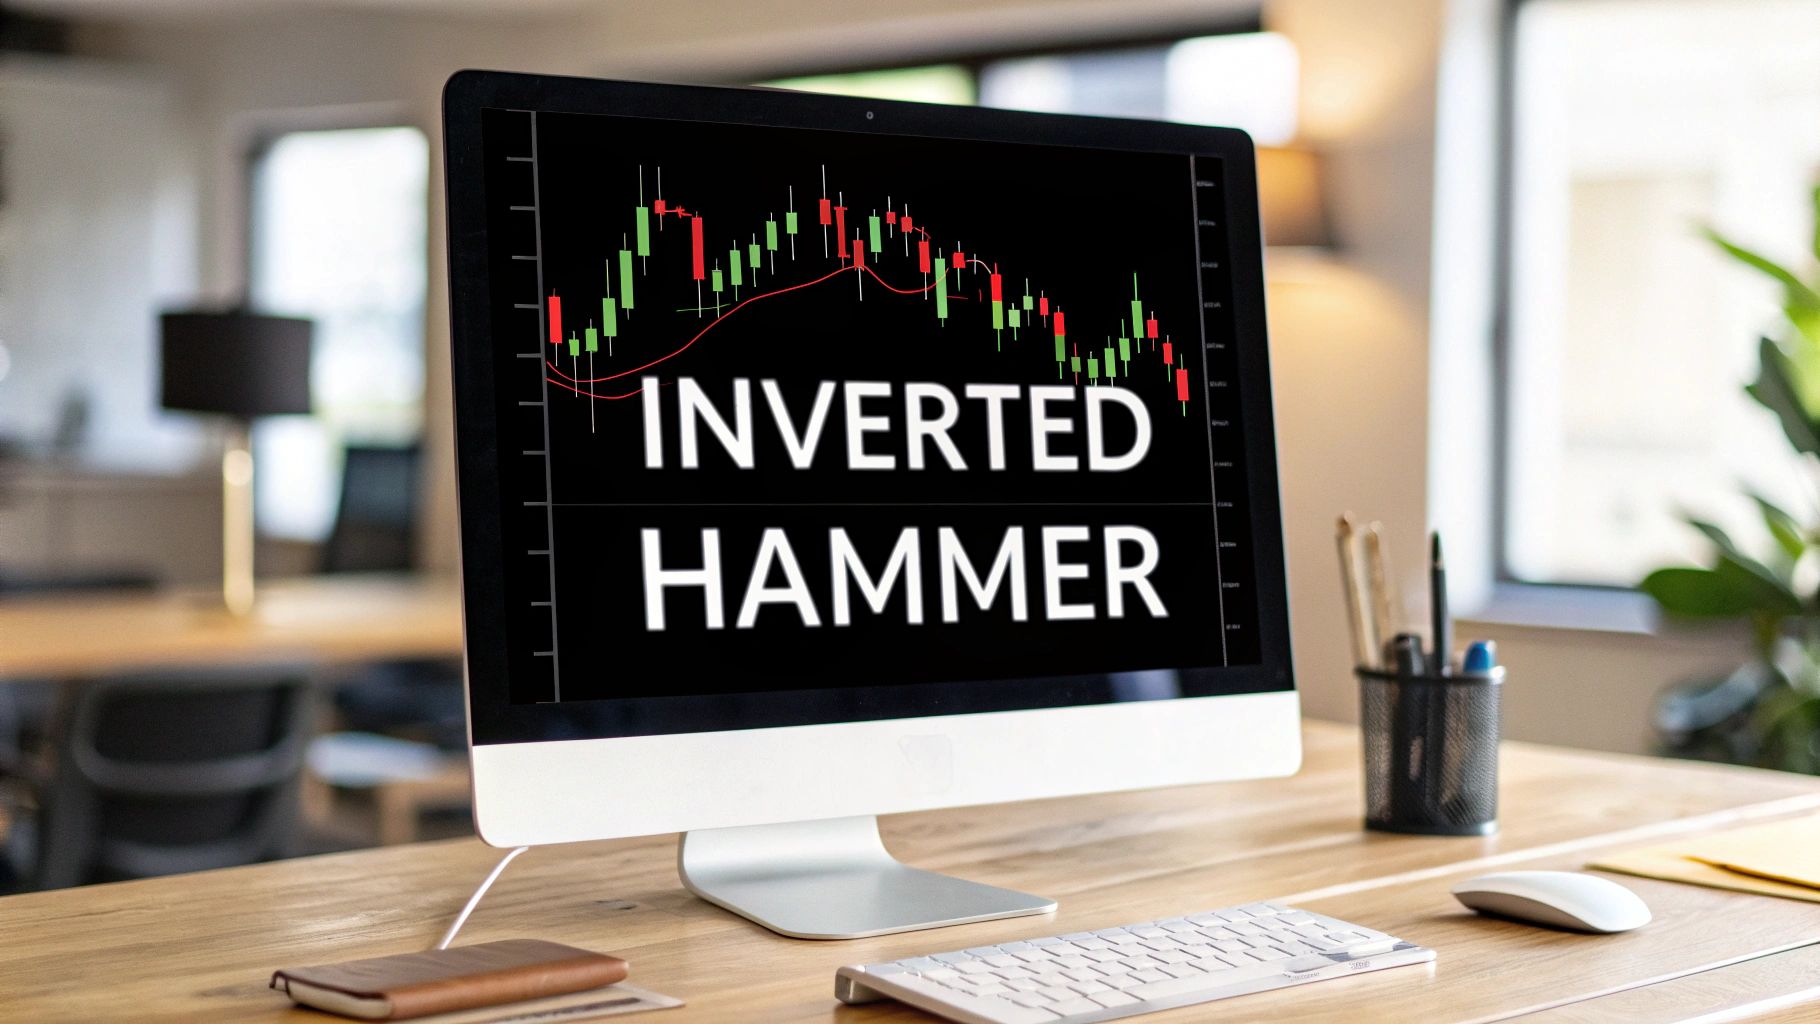
When you're scanning the charts, some candlestick patterns jump out and scream "pay attention!" The inverted hammer is one of those. It’s a single candlestick that often pops up at the bottom of a downtrend, hinting that a bullish reversal might be just around the corner.
Think of it as the first sign that buyers, after being pushed around for a while, are starting to fight back. It’s a subtle clue, but for a sharp trader, it’s a signal to get ready for a potential change in direction. The pattern is pretty distinct: a small body at the bottom, a long shadow pointing up, and almost no shadow pointing down.
Decoding the Inverted Hammer Pattern
Picture a ball that’s been falling for a long time. When it finally hits the ground, it gives a sharp bounce before settling back down close to where it landed. The inverted hammer tells a very similar story on a price chart. It shows up after a solid downtrend and suggests the sellers are starting to lose their momentum.
This single candle is a visual snapshot of a power struggle. Even though sellers managed to push the price back down by the end of the trading session, that initial spike of buying pressure—the long upper shadow—is the real story here. It's the market whispering that the bears might be getting tired.
The Anatomy of the Pattern
To spot an inverted hammer correctly, you need to look for a few key features. Each part of the candle tells you something about the battle between buyers and sellers during that session. For anyone new to this, understanding candlestick charts is the first step to making sense of these powerful patterns.
Here's what to look for:
- A Preceding Downtrend: Context is everything. This pattern only matters if it appears after a clear move down.
- A Long Upper Shadow: This wick needs to be at least twice the length of the candle's body. It’s the footprint of the buyers who stepped in.
- A Small Real Body: The body sits at the low end of the day's range, showing the open and close prices were close together.
- Little to No Lower Shadow: A tiny (or non-existent) lower wick shows sellers couldn't push the price much lower than where it opened.
For a quick reference, here are the core components in one place.
Inverted Hammer Pattern At a Glance
| Attribute | Description |
|---|---|
| Pattern Type | Bullish Reversal (requires confirmation) |
| Location | Must appear at the bottom of a downtrend. |
| Upper Shadow | Long; at least 2x the length of the real body. |
| Real Body | Small; located at the lower end of the trading range. |
| Lower Shadow | Very small or non-existent. |
| Psychology | Shows initial buying pressure after a sell-off. |
This table neatly sums up what makes an inverted hammer a pattern worth watching.
The inverted hammer is an early warning flare. It's not a definitive "buy now" signal on its own, but it tells you the downtrend's foundation is cracking. Smart traders see this and start looking for more bullish confirmation.
Interestingly, the color of the body isn't the most critical factor. A green (bullish) body is a slightly stronger signal because the close was higher than the open. However, a red inverted hammer is still a valid sign that a reversal could be on the way. The key is the shape and where it shows up.
The Market Psychology Behind the Inverted Hammer
https://www.youtube.com/embed/990oOC-bHxA
Every candlestick tells a story. It's a snapshot of the constant tug-of-war between buyers (the bulls) and sellers (the bears). The inverted hammer pattern tells a particularly dramatic one, hinting at a potential shift in power after a long battle. To really get what it means, you have to look past the shape and dig into the psychology of that single trading session.
The story starts with the sellers completely in charge. They’ve been pushing prices lower for a while, continuing a clear downtrend. For a moment, it looks like just another day at the office for them. The market sentiment is bearish, and they're meeting very little resistance.
Then, out of nowhere, things change.
A Sudden Surge of Buying Pressure
The buyers storm the market with surprising force. They see the lower prices as a bargain and start buying aggressively, which shoots the price up and creates that long upper shadow (or wick) of the inverted hammer. For a brief period, it looks like the bulls are about to stage a major comeback.
This rally is a critical piece of the puzzle. It’s the first real sign of bullish conviction after a long stretch of bearish control. But the fight isn't over just yet. The original sellers, joined by new ones, see the higher prices as another chance to sell, and they manage to push the price right back down to close near its opening level.
This failed rally isn't a sign of bullish weakness. Instead, it’s a crucial signal that significant buying interest is lurking beneath the surface, testing the strength of the sellers.
This back-and-forth leaves a lasting mark. Even though the sellers won the final skirmish by preventing a higher close, the bulls showed their hand. That long upper shadow is hard evidence that the sellers' grip might be loosening and that they are no longer in absolute control.
The Exhaustion of the Sellers
More than anything, the inverted hammer candlestick often signals seller exhaustion. After a prolonged downtrend, the bears are simply running out of steam. That powerful buying pressure, even if it was temporary, shows that the path of least resistance might not be downwards for much longer. Think of this candle as an early warning flare, telling observant traders that the market's underlying sentiment is starting to shift.
- Initial Control: Sellers dominate the start of the session, pushing the downtrend further.
- Bullish Challenge: Buyers mount a significant but brief rally, which forms the long upper shadow.
- Bearish Counter: Sellers force the price back down, but that initial buying surge has already signaled a potential change in momentum.
This complex dynamic is why the inverted hammer is such a powerful, though subtle, signal. It has a lot in common with other indecision candles; for a great comparison, you can learn more about the meaning of the Doji candle to see similar psychological cues. To zoom out and see how these emotions drive the entire market, exploring the broader concepts of understanding market psychology in trading can be a real eye-opener.
Ultimately, this pattern suggests that the downtrend’s foundation is cracking. If the buyers can follow through on their next move, a bullish reversal could be just around the corner.
How to Spot a Real Inverted Hammer
Finding a true inverted hammer takes a bit more than just spotting a candle that looks like an upside-down 'T'. If you want to trade it with any real confidence, you need to make sure it ticks a few very specific boxes. Getting this wrong means you're probably acting on a false signal, so let's get precise.
First thing's first: context is everything. The inverted hammer is a bullish reversal signal. That means it only counts if it shows up at the bottom of a clear downtrend. If you see the exact same shape pop up during an uptrend, that's a completely different pattern called a shooting star—and it signals the exact opposite.
The Anatomy Checklist
Once you've confirmed the pattern is appearing after a solid move down, it's time to zoom in on the candle itself. A proper inverted hammer has a very specific structure that tells the story of a potential power struggle between buyers and sellers.
Here's a simple checklist to run through:
- The Upper Shadow: This is the long wick pointing up. It absolutely must be at least twice the length of the real body. This is non-negotiable; it's the visual proof of buyers trying to push the market higher.
- The Real Body: The body of the candle needs to be small and hanging out at the bottom of the day's trading range. This tells you that even though buyers gave it a good shot, sellers managed to push the price right back down near the open.
- The Lower Shadow: Ideally, there should be little to no lower shadow. A non-existent wick at the bottom is perfect because it shows sellers couldn't even push the price below where it started.
Think of it like a strict recipe. If any of these "ingredients" are off, it's not a true inverted hammer, and its predictive power drops off a cliff.
Does the Candle Color Matter?
This question comes up all the time. The short answer is yes, but it’s not a deal-breaker. A green (or white) body is definitely a stronger signal. It means the closing price was higher than the opening price, giving the bulls a small but meaningful victory for the session.
That said, a red (or black) inverted hammer is still a valid signal. The most important part of the story—that long upper shadow showing buyers testing the waters—is still there regardless of the body's color.
Remember, the single most critical factor is the pattern's location. A picture-perfect inverted hammer that appears in a sideways or uptrending market is just noise, not a valid reversal signal.
And this isn't just theory. Historical data shows that the inverted hammer pattern has roughly a 67% accuracy rate at signaling bullish reversals when it's correctly identified at the bottom of a downtrend. It gets even more reliable when you see it confirmed by a spike in trading volume or when it forms right on top of a known support level. You can check out more stats on these kinds of patterns in these reversal pattern rankings on LuxAlgo.
A Step-By-Step Inverted Hammer Trading Strategy
Spotting an inverted hammer is a bit like seeing a crack form in a dam—it hints at a reversal, but you don’t rush in until the pressure builds. On its own, the pattern whispers “possible change,” not “act now.” Patience and confirmation make all the difference.
Before you pull the trigger, always wait for the market’s answer to the question: Is this downtrend over?
Confirmation Signals For Trading The Inverted Hammer
To separate the strong signals from the noise, use multiple confirmation methods. Below is a quick rundown of the most reliable ways to validate an inverted hammer before you commit capital.
| Confirmation Method | How It Works | Strength of Signal |
|---|---|---|
| Breakout Close | Next candle closes above the inverted hammer’s high, showing follow-through. | High |
| Volume Spike | Noticeable surge in volume during the hammer and confirmation candle. | Medium–High |
| Moving Average | Confirmation candle closes above a key moving average (e.g., 50-MA). | Medium |
| RSI Bullish Divergence | Price makes a new low while RSI forms a higher low, hinting at fading bears. | Medium |
| Support Confluence | Pattern appears right at a major support level or trendline. | High |
Use these methods in concert to give your setup the best chance of success.
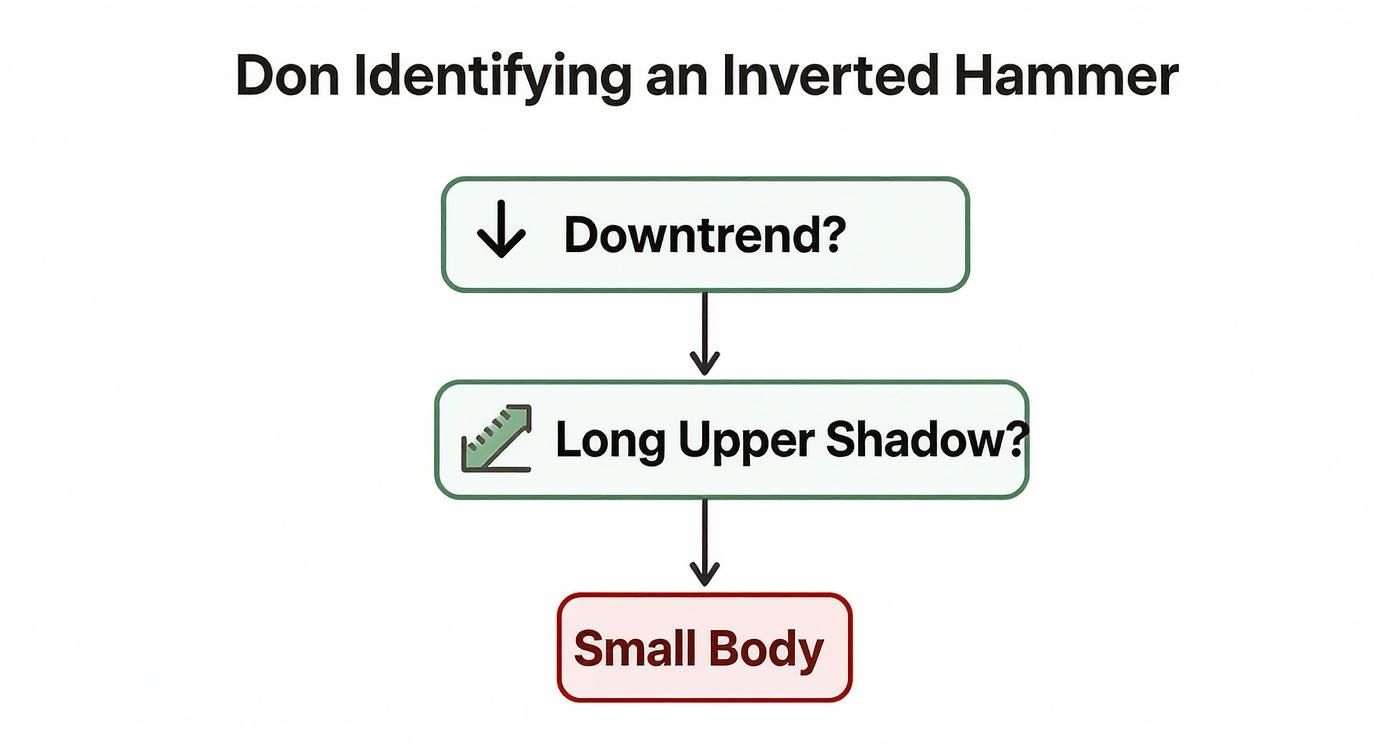
This infographic reminds you that an inverted hammer only counts after a clear downtrend and with the proper candle anatomy in place.
Crafting Your Entry And Exit Plan
Once you spot bullish confirmation, lock in your parameters:
- Entry Trigger: Wait for the confirmation candle to close above the inverted hammer’s high.
- Stop-Loss Placement: Position your stop just below the inverted hammer’s low to invalidate the setup if price turns south.
- Profit Targets: Aim for the next key resistance zone or set a risk-to-reward ratio of at least 2:1.
For a deeper dive into precise entry techniques, check out our guide on how to enter a trade with an emphasis on price action.
Stacking The Odds With Additional Tools
Layering in other indicators can turn a good signal into a great one:
- Trading Volume: A spike during the hammer and follow-through candle shows real money backing the move.
- Relative Strength Index (RSI): Look for bullish divergence—price dips to a new low while RSI holds higher.
- Support Levels: A hammer at a known support zone or trendline carries extra weight.
The strongest setups happen when non-correlated signals converge on the same outcome. The inverted hammer is just one piece of the puzzle.
Historical backtests on the S&P 500 ETF (SPY) reveal the inverted hammer showed up 132 times since 1993. Holding for one to ten days yielded win rates between 53% and 65%, with an average gain of 0.36% per trade. These stats underline a real edge—when you follow your rules.
How Market Context Impacts the Pattern's Reliability

A trading pattern is never a guarantee. Its real power comes from the environment where it shows up. The inverted hammer candlestick is no different. Its reliability can swing wildly depending on the market you’re in, the timeframe you’re watching, and the asset you’re trading—from volatile crypto to major forex pairs.
Think of it this way: a pattern is just a tool. A sledgehammer is perfect for demolition, but you wouldn’t use it to fix a delicate watch. In the same way, an inverted hammer might be a high-probability signal in one context but just meaningless noise in another. This is exactly why backtesting is non-negotiable before you risk a single dollar.
Timeframes and Asset Classes Matter
Every asset has its own "personality," and that has a huge impact on how patterns play out. An inverted hammer on a daily stock chart, for example, often carries more weight than one on a frantic 5-minute forex chart, where market noise can easily throw you off. The key is knowing that no two markets behave in the same way.
This is especially true when you start comparing different timeframes. Digging into historical forex data reveals a fascinating split in the pattern's effectiveness. On lower timeframes, like the 30-minute chart, the inverted hammer has shown a bullish reversal success rate of about 52.9%. But when you zoom out to a higher timeframe like the 4-hour chart, the pattern often fails, leading to a bearish continuation 52.9% of the time. You can explore more about these forex-specific findings to see just how much context changes the game.
The success of an inverted hammer isn't just about its shape—it's about where and when it appears. A signal on a daily chart reflects the sentiment of an entire day's trading, while a 5-minute chart captures mere moments of indecision.
How to Validate the Pattern for Your Setup
If you want to trade the inverted hammer with any real confidence, you have to validate its performance within your specific trading plan. This means rolling up your sleeves and doing some methodical backtesting. You need hard data on how this pattern has performed historically in your chosen market and on your preferred timeframe. A strategy that works wonders for a long-term stock trader could be a recipe for disaster for a short-term currency scalper.
Here are a few practical steps to see if the pattern holds up for your system:
- Define Your Rules: First, be crystal clear about what counts as a valid inverted hammer and what confirmation signal you need to see. Write it down.
- Select Your Arena: Pick one specific asset and one timeframe to test. For example, EUR/USD on the 1-hour chart.
- Gather Historical Data: Go back through your charts and find at least 100 examples of the pattern showing up according to your rules.
- Analyze the Results: Track everything. What was the win rate? The average profit? The average loss? Does it actually give you a statistical edge?
This disciplined process takes the guesswork out of trading. It helps you adapt your strategy to the unique rhythm of the market you're in, turning the inverted hammer from a generic textbook pattern into a reliable tool built specifically for you.
Common Questions About the Inverted Hammer
Even when you feel you have a good handle on the inverted hammer candlestick, a few questions always seem to pop up. These are the little details that can trip up even experienced traders, so let's get them cleared up right now.
Getting direct answers to these common sticking points is the key to trading this pattern with real confidence.
What's the Difference Between an Inverted Hammer and a Shooting Star?
This is probably the most common point of confusion, and for good reason—they look exactly the same. Both have that small body at the bottom and a long wick stretching upwards.
The only thing that separates them is context. It all comes down to where you find them on the chart.
The inverted hammer is a bullish reversal signal that only appears at the bottom of a downtrend. The shooting star, on the other hand, is its evil twin—a bearish reversal signal that shows up at the top of an uptrend. Location is everything.
Is the Inverted Hammer Reliable on Its Own?
This is a critical question, and the short answer is no. While the inverted hammer is a fantastic early warning sign, it’s not strong enough to trade in isolation. Think of it as a suggestion from the market, not a command.
Its reliability shoots up when you get confirmation from what happens next. One study on reversal patterns found the inverted hammer has about a 67% accuracy rate, but that’s only when it appears in the right place and is followed by a strong bullish move.
The inverted hammer pattern is telling you that the bears are losing their grip. But you absolutely must wait for the next candle to prove that buyers are actually stepping in to take control before you risk any capital.
Without that follow-through, it’s just a brief pause in the selling, not a true change in direction. Always wait for a strong bullish candle that closes above the high of the hammer before even thinking about a trade.
Does the Color of the Candle Matter?
Another great question. Does a green (bullish) body have more meaning than a red (bearish) one? Yes, it does, but it's not a deal-breaker.
A green inverted hammer is considered slightly stronger. Why? Because it means that despite all the selling pressure during the session, the bulls fought back hard enough to close the price higher than where it opened. It's a small victory, but a meaningful one.
That said, a red inverted hammer is still a perfectly valid signal. The most important part of the story—that long upper shadow—is still there. It proves that buyers showed up and challenged the sellers, even if they couldn't quite win the session.
Here’s a quick way to think about it:
- Green Inverted Hammer: A stronger signal. The close was above the open, showing more bullish conviction.
- Red Inverted Hammer: Still a valid signal. The buying pressure (the long upper wick) is the key takeaway, even if the close ended up slightly lower than the open.
Ultimately, things like the strength of the prior downtrend, whether the pattern forms at a key support level, and the confirmation candle that follows carry far more weight than the candle’s color.
At Colibri Trader, we cut through the noise and teach you how to read the story of the market through pure price action. If you're ready to stop guessing and start trading with a proven, indicator-free methodology, explore our courses and transform your approach today. https://www.colibritrader.com