


How to Trade Price Action: Your Complete Trading Journey
Why Price Action Trading Changes Everything

This Investopedia screenshot shows a clean price action chart with key levels marked. Notice how it cuts through the clutter—no confusing indicators. Just pure, unadulterated price movement. This simplicity is what lets price action traders zero in on what truly matters in the market.
Many trading courses focus on memorizing patterns and rigid rules. I've talked to a ton of successful traders, and here's the thing: profitable price action trading isn't about memorizing. It's about changing how you see the charts.
Instead of random price swings, think of each candlestick as a word in a conversation between buyers and sellers. That’s the real key to unlocking the power of price action.
This shift is about understanding the psychology behind the market. Imagine a sudden burst of buying after a period of consolidation. That could mean increased buyer conviction, hinting at a potential breakout. This insight into market sentiment gives you a serious advantage. You're not just reacting to the price; you’re anticipating it based on the market’s “conversation.”
Understanding the Roots of Price Action
This way of trading isn't new. Analyzing raw price data and patterns, like candlestick formations, goes back to the late 19th and early 20th centuries. It emerged alongside the rise of technical analysis. The Dow Theory, developed by Charles Dow, is a great example of this early market interpretation. Learn more about the history of price action trading: Introduction to Price Action Trading Strategies. By 2020, price action analysis was widely used, with over 73% of retail traders incorporating it.
Separating the Signal From the Noise
Successful price action traders have a knack for filtering the real signals from the noise. They do this by understanding market context. Take a doji candlestick, for example. In a volatile market, it might not mean much. But at a key support level after a long downtrend? That same doji could signal a reversal. Context is king.
The Honest Truth About Price Action
Let's be real: price action trading isn’t a holy grail. There will be losing trades. But when you understand what the charts are really saying, price action becomes an incredibly valuable tool. It allows you to interpret market intentions, foresee potential moves, and make smarter trading decisions. It's about learning to read the market’s language and joining the conversation.
Reading Market Structure Like the Pros Do
Market structure can be a real head-scratcher for traders, but it doesn't have to be this confusing maze. Forget about randomly drawing lines for support and resistance. Instead, let's focus on where price has actually been rejected before, those points where buying and selling pressure really shift, and how price moves between these key levels. This is exactly how the sharpest price action traders I know approach the markets. They're zeroing in on the zones where the big players, the institutional traders, are most likely to make their moves.
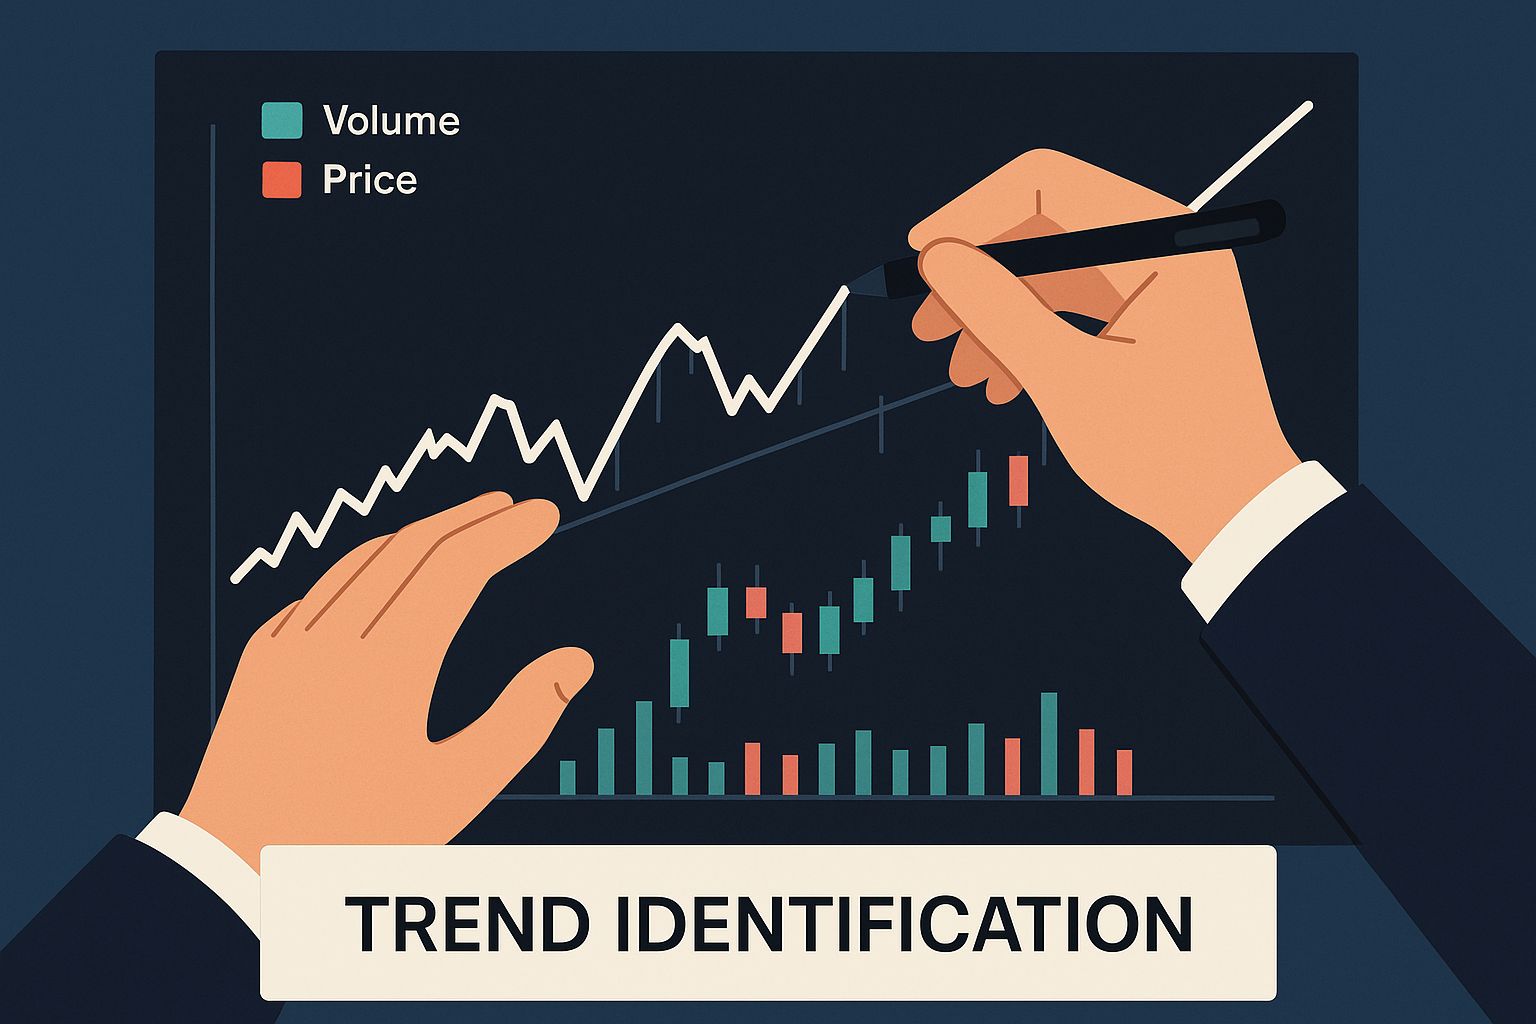
This infographic shows how important it is to identify the trend when you're trading price action. By paying attention to trend lines, we can get a better feel for where the price might go and make smarter trading decisions.
Identifying Key Levels
Finding these key levels isn't about some secret formula; it's about carefully observing how the price actually behaves. Look for areas where price has reversed multiple times. These are your support and resistance zones. Think of them as the battlegrounds between buyers and sellers.
For example, if the price shoots up to a certain level and then gets hammered back down several times, that level is probably acting as resistance. This means sellers are stepping in with real force, stopping any further upward movement.
Understanding Market Flow
Once you've spotted those zones, you need to understand how the price flows between them. Markets move in waves: expansion phases, where price moves aggressively, and consolidation phases, where it takes a breather and builds up energy. Learning to recognize these phases is key for timing your trades perfectly.
Think of it like surfing. You wouldn't paddle into a wave that's already crashing. The same goes for trading – you want to enter during the expansion phase, riding the momentum of the move.
Using Multiple Timeframes for Context
Here's a tip I've learned over the years: use multiple timeframes. A lot of traders think this makes things more complicated, but it actually makes it clearer. Analyzing higher timeframes, like the daily or weekly chart, gives you a bigger picture view. It helps you figure out the overall trend, which can then guide your decisions on lower timeframes.
For example, a bullish pin bar on a 5-minute chart might not mean much if the daily chart is showing a clear downtrend. Context is king when you're learning how to trade price action.
This screenshot from Wikipedia highlights how visual technical analysis is. This is the foundation of price action trading. The charts and indicators give you a visual representation of market trends and patterns. By studying these visuals, traders can get a sense of where the price might be headed.
Recognizing Market Momentum
Finally, don't underestimate the power of higher highs and higher lows (in an uptrend) or lower highs and lower lows (in a downtrend). These aren’t just things you read in textbooks; they're strong indicators of market momentum. A series of higher highs and higher lows tells you buyers are in charge, driving the market upward.
This helps you stay on the right side of the market, trading with the trend, not against it. Learning to trade price action effectively means recognizing these momentum shifts and adjusting your strategy. This is how you maximize profits and minimize losses.
Let's take a look at the following table to understand how market structure elements play a role in generating trading signals. It summarizes the key components and what they tell us about potential price moves.
Market Structure Elements and Their Trading Signals
Key market structure components and what they tell traders about potential price movements
| Structure Element | Bullish Signal | Bearish Signal | Reliability Level |
|---|---|---|---|
| Support Zone | Bounce off support | Break below support | Medium |
| Resistance Zone | Break above resistance | Rejection at resistance | Medium |
| Higher Highs/Higher Lows | Confirmation of uptrend | N/A | High |
| Lower Highs/Lower Lows | N/A | Confirmation of downtrend | High |
| Consolidation | Potential breakout setup | Potential breakdown setup | Low |
| Expansion | Strong trending move | Strong trending move | Medium |
As you can see, different elements offer various levels of reliability. Combining multiple signals, along with context from higher timeframes, generally increases your chances of a successful trade.
By understanding these core principles of market structure, you can go from just reacting to the price, to actually anticipating its likely path. This is the foundation for making smart trading decisions based on the market’s internal dynamics, not just random guesses. It’s about gaining a real edge in the market.
Candlestick Patterns That Actually Make Money
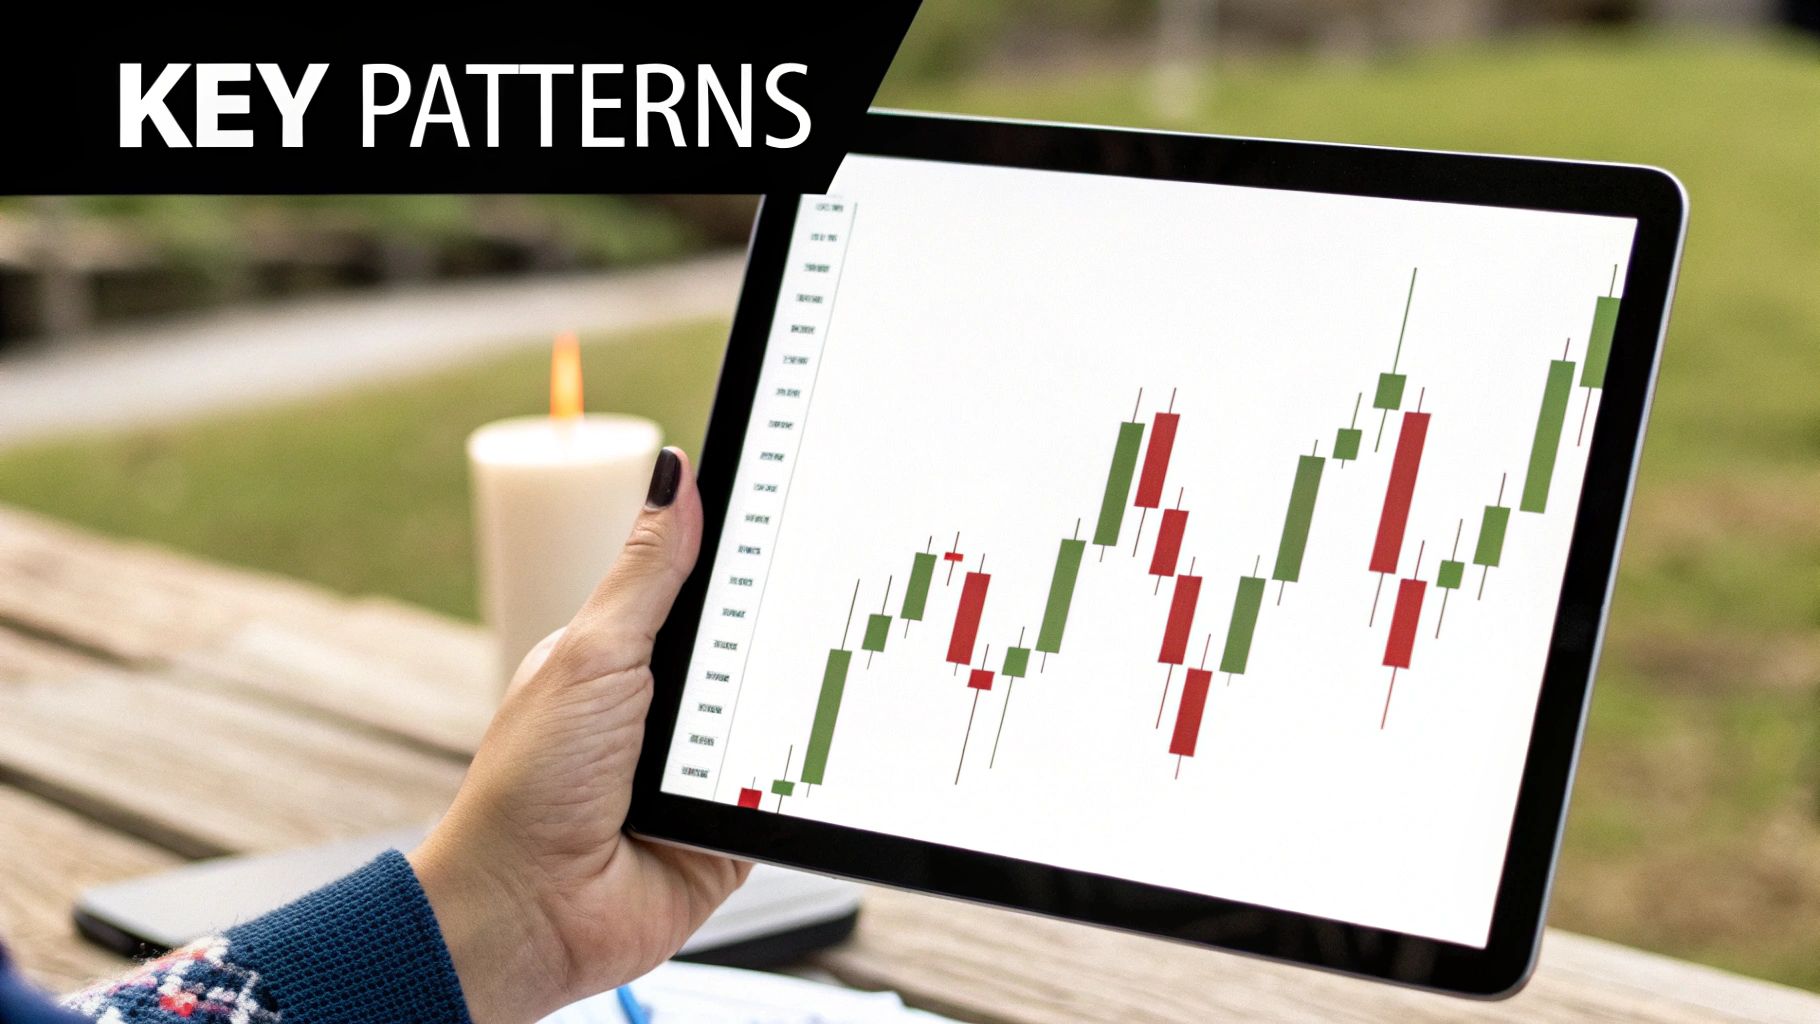
This TradingView screenshot highlights some clear candlestick patterns on a chart. Notice how they pop up at key support and resistance levels, offering valuable clues about where the price might be headed. Recognizing these patterns, not in isolation, but within the bigger picture of the market, is absolutely essential for effective price action trading.
Let's be straight: most candlestick patterns are practically useless on their own. The magic happens when you combine the right patterns with a solid grasp of the market context. Having analyzed thousands of trades, I can tell you some patterns consistently deliver – but only when they show up in specific situations.
For example, the pin bar. In the middle of a ranging market, it's often just noise. But catch one at a key support level during an uptrend? That's a different story. It could signal a potential reversal and a fantastic buying opportunity.
Engulfing Candles: Spotting Momentum Shifts
Engulfing candles are another powerful tool in your price action arsenal. They happen when a candle entirely swallows the previous candle's body. A bullish engulfing pattern after a downtrend can signal a shift in momentum toward the buyers. Not a guarantee, of course, but a valuable hint when combined with other confirming factors. A bullish engulfing candle at a support level, coupled with increasing volume? Now you’re really talking.
Inside Bars: Anticipating Breakouts
Inside bars are interesting. They appear when a candle's high and low fall completely within the previous candle's range. This often points to a period of consolidation before a potential breakout. Think of it like a coiled spring: price is squeezed into a tight range. When that spring releases, the move can be explosive. Inside bars often precede these kinds of moves, giving you a heads-up.
For a more in-depth look at candlestick patterns, check out our guide: Candlestick Patterns in Forex. It's a great resource.
Doji Patterns: Recognizing Indecision
Doji patterns, with their small bodies and long wicks, whisper of market indecision. It’s like a pause in the market’s conversation. A doji in the middle of nowhere might not mean much. But a doji at a major resistance level after a powerful uptrend? That could signal weakening momentum and a possible reversal. This is what price action trading is all about – recognizing these subtle hints and interpreting them within the larger market narrative.
The Importance of Confirmation
Timing is crucial in trading. Waiting for confirmation can be the difference between a winner and a loser. Don't jump in just because you see a pattern. Wait for the price to confirm your analysis. This might mean waiting for a break above resistance after an inside bar, or a strong bullish candle following a pin bar at support.
Avoiding Common Traps
Here's something I've learned firsthand: knowing when patterns are likely to fail is just as important as recognizing the patterns themselves. A pin bar at resistance during a downtrend, for example, might look tempting for a short trade, but it can be a trap. Aggressive buyers often use these levels to drive the price higher. Recognizing these pitfalls will save you from painful losses. That's why understanding market structure and context is so important.
Trading price action effectively isn't about memorizing every candlestick pattern. It's about understanding the story the market is telling. It's about blending pattern recognition with market structure, momentum, and timing to develop a true edge. And it's about constantly learning and adjusting your approach as market conditions shift.
Timing Your Trades With Surgical Precision
This is where price action trading really clicks – turning analysis into actual cash. The difference between traders who consistently profit and everyone else often boils down to two things: patience and timing.
This Metatrader 4 screenshot shows you the platform’s layout, including the charting tools and order windows. As a trader using this platform, you'd be analyzing those price charts, hunting for trading setups based on your chosen price action strategy. Having real-time data and effective trading tools all in one place is key. You're able to enter and exit trades based on price action signals right from the platform.
Waiting for the Stars to Align
Successful price action traders don't jump the gun. Seeing one signal isn’t enough. They wait for a confluence of factors—multiple indicators pointing in the same direction—before putting their money on the line.
Think of it this way: a pin bar rejection at a key support level, alongside a bullish divergence on the Relative Strength Index (RSI), makes for a much stronger setup than the pin bar alone. Patience is key. It’s tough, I know. You don't want to miss out on the action, but trust me, waiting for confirmation often separates a winning trade from a loser.
The Art of Confirmation: Letting Price Prove You Right
Confirmation is at the heart of price action trading. It’s about letting the price validate your analysis before risking your capital. Let’s say you spot a potential bullish reversal pattern. Instead of buying immediately, wait for the price to break above the previous swing high. That's the price action confirming buyers are in control. This approach helps minimize losses by ensuring you’re entering trades when the odds are in your favor. It’s like waiting for the coast to be clear before crossing the street.
Aggressive vs. Conservative Entries: Finding Your Style
Price action offers different entry points. Aggressive entries are for seasoned traders who are comfortable with higher risk for potentially bigger wins. This might mean entering as soon as a key level is broken, expecting the move to continue strongly.
Conservative entries focus on higher probability setups, even if it means slightly smaller profits. This might involve waiting for a pullback after a breakout, confirming support before entering. The best approach? It depends on your personal risk tolerance and trading style. There's no one-size-fits-all.
Setting Profit Targets Based on Market Structure
Forget fixed profit targets. Seriously. Successful price action traders use market structure to decide where to exit. They look for logical resistance points, like previous swing highs or key Fibonacci levels. This allows them to maximize profits by riding the move as far as it's likely to go. Think of it like anticipating where the market will naturally hit the brakes.
The Psychological Game: Mastering Patience and Discipline
Waiting for the ideal setup requires mental fortitude. You need the discipline to resist chasing every single move. This patience, though, is what separates consistently profitable traders from the pack. Managing expectations is crucial, too. The market won’t always play by your rules. Sometimes, the perfect setup never appears, and that’s okay. Stick to your plan, avoid emotional decisions, and wait for the next high-probability opportunity.
Let's talk entry techniques. I've put together a table summarizing some common price action entry methods, their usual success rates under various market conditions, and the associated risk levels. It's a handy guide to help you navigate these techniques.
| Entry Method | Market Condition | Success Rate | Risk Level |
|---|---|---|---|
| Breakout Entry | Trending | 60% | Medium |
| Pullback Entry | Trending | 70% | Low |
| Reversal Entry | Ranging | 50% | High |
| False Breakout Entry | Ranging | 65% | Medium |
This table offers a quick snapshot of how different entry methods perform in various markets. As you can see, pullback entries in trending markets generally have higher success rates and lower risk. Reversal entries, on the other hand, are higher risk, particularly in ranging markets. These are just average estimates, and your actual results will vary. Remember, understanding market context is crucial for choosing the right entry technique.
Risk Management Through Price Action Logic
So many traders trip up on risk management because they're obsessed with percentages instead of actual price action. The best price action traders I know use the charts themselves to define risk. Think about it: If you're buying at support, your stop loss goes below where that support breaks down, not some arbitrary percentage below your entry.
This means your position size will vary, but your actual dollar risk is what you control. Let's dig into how to calculate position sizes based on the distance to your logical stop-loss levels. This way, you’re never risking too much, no matter how wild the market gets. For a deeper dive into support and resistance, check out this guide on Supply and Demand Trading.
Calculating Position Size Based on Stop Loss
Let’s say you buy a stock at $50 with support at $48. Your stop loss should be a bit below $48, like $47.50. That $2.50 difference is your risk per share. If you're comfortable risking $250 on this trade, you can buy 100 shares ($250/$2.50 = 100). Simple, right?
Now, imagine another trade with a wider stop, maybe $5. Sticking with your $250 risk tolerance, you'd only buy 50 shares. This flexible position sizing keeps your dollar risk consistent across all your trades.
Risk-Reward Ratios and Price Logic
Risk-reward ratios aren't magic numbers. They show you the potential profit relative to your risk, based on where price should go versus where your analysis breaks down. A 2:1 risk-reward ratio isn't a profit guarantee. It only becomes powerful when your stop loss is based on solid price action, and your target aligns with real resistance. Then, it tells you you’re aiming for a move twice as big as the distance to your invalidation point.
Embracing Losing Trades (and Learning From Them)
Let's be real, losing trades are part of the game. The real skill is managing them. Price action gives you the clues to cut losses fast when the market proves you wrong. For example, if the price breaks below your support, it's time to exit—minimize losses and save your capital for better opportunities.
This Myfxbook screenshot shows a trading account’s performance. Metrics like gain/loss, average win/loss, and drawdown give you a snapshot of consistency and profitability. It helps you see how a trader performs in real market conditions.
This example illustrates the importance of solid risk management. Consistent gains over time often point to a well-defined risk strategy, showing how important discipline truly is.
Letting Winners Run: Riding Market Momentum
On the flip side, price action helps you spot momentum and let your winning trades run. Trailing your stop loss behind swing lows or highs lets you capture bigger profits while protecting yourself from reversals. The goal isn’t avoiding every loss; it's maximizing gains when the market agrees with you.
Balancing Winners and Losers
The point of price action, or any trading for that matter, isn't winning every trade. That's impossible. It's about finding a win rate and risk-reward ratio where your wins more than make up for your losses. This balance, combined with consistently applying your strategy, is what leads to long-term profits. This is how price action trading becomes a viable and profitable strategy.
Adapting Your Approach to Market Personality
Markets, like people, have their quirks. Just as you wouldn't chat with your boss the same way you would with your best friend, your price action approach needs to shift depending on the market's "mood." What works in a fast-paced, trending market could wreck your account in a choppy, range-bound one.
Recognizing Market Environments
The first step is recognizing what kind of market you're dealing with. Is it trending up, trending down, or just bouncing around sideways? Each scenario calls for a different game plan. In strong trending markets, breakout patterns and momentum plays are often your bread and butter. Look for continuation patterns and ride that wave. For example, in a strong uptrend, buying on those dips down to support levels can be incredibly effective.
But in range-bound markets, those same breakout strategies can lead to frustrating whipsaws and losses. Instead, reversal patterns at key support and resistance levels become your go-to. Think of it like a ping-pong game: buy near the bottom of the range, sell near the top. If you're interested in diving deeper into this, check out this resource: Master Supply and Demand Trading.
Identifying Market Transitions
One of the toughest parts of this whole market personality thing is figuring out when the market is changing its mind—shifting from a trend to a range, or the other way around. These transition periods are where traders who haven't noticed the shift can get really hurt. Imagine trying to surf a wave that suddenly vanishes. Wipeout, right? The same goes for trading – sticking with a trending strategy when the market starts ranging can lead to some painful losses.
So how do you spot these transitions? By paying close attention to what the price action is telling you. Are breakouts failing quickly? Is volatility increasing or decreasing? Is the market making lower highs and lower lows after a strong upward run? These are all clues that the market’s personality might be shifting.
The Role of Volatility
Volatility often gets a bad rap, but it's more than just how much the price moves. It's about how predictably it moves, especially around those key support and resistance levels. In a trending market, the price usually respects these levels, bouncing off them neatly. But in a choppy market, it can slice right through them. This unpredictable behavior is precisely why adapting your approach is so crucial.
Take a look at this stock chart from Yahoo Finance. See how the price fluctuates? These ups and downs give you a feel for the stock’s volatility. Sharp jumps or drops mean higher volatility, while smoother movements point to lower volatility. Understanding this can be a real game-changer for your trading decisions.
Considering Seasonal Patterns and Trading Sessions
Even within a specific market environment, there are still subtle differences to consider. Seasonal patterns, for instance, can affect how prices behave. Some commodities have predictable trends during certain times of the year because of supply and demand. Similarly, different trading sessions (Asian, European, and US) have their own characteristics. The Asian session might be relatively quiet, while the US session tends to be more action-packed. Recognizing these nuances can help you fine-tune your strategy.
The Goal: Flexibility and Adaptability
The ultimate goal is to become a versatile trader who can profit in any market condition. You don't want to be stuck with just one strategy. By understanding market personality and adapting your approach, you become more like a market chameleon, blending in with the environment and profiting from its unique characteristics. This adaptability is what separates consistently successful traders from those who constantly struggle. It's about being ready for anything the market throws your way.
Your Practical Price Action Blueprint
Time to talk practical application. We’re building a flexible framework for trading, not memorizing rigid rules. Think of it as a friendly chat with someone who’s been in the trenches, sharing what really works.
Pre-Market Prep: Analyzing Charts Efficiently
Before the market opens, it's all about preparation. I like to scan the charts of instruments I’m familiar with, looking for potential opportunities. Price is important, but don't forget volume. In my experience, high volume breakouts often have more momentum. Pay close attention to where the market struggled the previous day—these are your key support and resistance levels. They're often where the action happens.
Practical Checklists for Validating Setups
Checklists are powerful tools. Not to box you in, but to make sure you’re considering all the angles. It’s about developing a systematic approach, not blindly following rigid rules. Here’s a simple checklist I often use:
- Trend: What's the overall market direction? Up, down, or sideways? This helps me filter potential setups.
- Key Levels: Has the price interacted with previous support or resistance? These levels are crucial for entries and exits.
- Candlestick Patterns: Are any candlestick patterns, like engulfing candles or pin bars, hinting at a shift in momentum? They can offer valuable clues.
- Volume: Does volume support the price action? Higher volume often signals stronger conviction, especially during breakouts or reversals.
Remember, these are guidelines, not commandments. They're there to help you stay objective.
Real-Time Decision Making: Staying Disciplined
The market opens, and emotions can take over. A pre-defined framework helps me stay grounded and execute my plan. One technique I find useful is the "if-then" scenario. For example, "If the price breaks this resistance level with increasing volume, then I'll enter a long position with a stop loss below the previous swing low." This takes the emotion out of the decision-making process.
Post-Trade Analysis: Accelerating Your Learning Curve
After every trade, win or lose, it’s analysis time. Don't just fixate on the outcome. Did the price behave as you anticipated? Did you follow your plan? What could you have done differently? This is where the real learning happens. A trading journal, documenting your entries, exits, and thought processes, can be incredibly valuable for tracking your progress and identifying patterns.
Realistic Expectations: Mastering Price Action Takes Time
Learning price action trading is a marathon, not a sprint. There's no magic bullet. It requires time, dedication, and a willingness to learn from your mistakes. Be patient with yourself, celebrate small victories, and analyze your losses. The goal is a consistent process, not overnight riches.
Common Challenges and Practical Solutions
New price action traders often encounter similar hurdles:
- Overtrading: Taking too many trades, often driven by FOMO. Solution: Stick to your pre-defined setups and resist impulsive entries.
- Ignoring Market Structure: Focusing on isolated patterns without understanding the broader context. Solution: Analyze higher timeframes to gain perspective and identify key support and resistance zones.
- Inconsistent Risk Management: Risking too much on some trades and too little on others. Solution: Base your position size on your stop-loss level, not on arbitrary percentages.
Your Trading Style and Risk Tolerance
The best price action approach is the one that aligns with your personality and risk tolerance. Are you comfortable with aggressive entries and wider stops, or do you prefer more conservative entries with smaller targets? There's no right or wrong answer. The key is finding a method you can consistently apply, even during losing streaks. A sustainable trading style, aligned with your comfort level, is essential for long-term success.
Ready to level up your price action trading? Colibri Trader offers comprehensive training to help you master this powerful approach. Check out their website and begin your journey toward becoming a consistently profitable trader. Learn more about mastering price action with Colibri Trader.