


How to Enter a Trade Like a Pro Trader
Before you even think about risking a single dollar on a trade, you need a rock-solid plan. A winning entry isn't just a random click; it's the final step in a deliberate, structured analysis that tells you exactly why you're getting in, where to get in, and what the market is actually doing. This pre-trade blueprint is your foundation for consistent, confident trading.
Build Your Pre-Trade Blueprint
Knowing how to enter a trade properly starts long before you ever hit the buy or sell button. It begins with building a robust pre-trade blueprint—a process that turns trading from a pure gamble into a strategic business decision. This foundational work is all about analyzing the market context, identifying key price levels, and keeping an eye on the broader economic picture. Without this prep work, even the most perfect-looking entry signal is likely to fall flat.
The first layer is simply understanding the market's bigger picture. Is the asset in a clear uptrend? A downtrend? Or is it just chopping around in a range? Trying to buy into a powerful downtrend without a clear sign of reversal is like swimming against a strong current. It’s exhausting, and it rarely ends well.
Reading the Story of the Chart
Every chart tells a story—a constant battle between buyers and sellers. Your job is to read that story by identifying the most significant support and resistance zones. These aren't just arbitrary lines; they are historical battlegrounds where the price has reversed or stalled in the past.
- Support: Think of this as a floor. It's a price level where buying pressure has historically stepped in and pushed prices back up.
- Resistance: This acts as a ceiling. It's a price level where selling pressure has historically overwhelmed buyers, causing the price to fall.
By mapping these zones on higher timeframes, like the daily or weekly charts, you gain invaluable context. A potential long entry signal becomes much more powerful if it lines up perfectly with a major support level. On the flip side, an urge to buy just below a major resistance area is a classic low-probability setup you should avoid. This high-level map is what guides your decision-making on the lower timeframes.
Your pre-trade analysis is all about stacking the probabilities in your favor. The goal isn't to find a "guaranteed" winner, but to systematically filter out the junk setups and focus only on trades where the market structure truly supports your idea.
Understanding the Macroeconomic Context
While price action is king, ignoring the broader economic environment can be a very expensive mistake. Major economic news, central bank policy shifts, and global trade dynamics can inject massive volatility into the markets, completely wrecking even the most perfect technical setup.
For instance, trends in global trade volume offer huge clues for currency and commodity markets. While the world trade volume index hit 110.06 in July 2025, the overall growth pace has slowed to about 1.8% recently. That's a big drop from the pre-pandemic average of nearly 4.9%. This kind of slowdown, often fueled by tariffs and policy uncertainty, frequently leads to choppy, unpredictable conditions in related markets—a factor you absolutely must account for in your risk assessment.
This is exactly why having a structured approach is non-negotiable. A crucial part of refining your strategy is learning how to backtest a trading strategy against historical data. This lets you see how your entry triggers actually perform when faced with different market conditions and volatility spikes.
When you put all these pieces together—market structure, key levels, and the macro context—you have the core of your pre-trade routine. This preparation is what you document in your trading plan, the single document that should guide every action you take. For a structured way to get this down on paper, you might find our guide on creating a professional trading plan template helpful. This blueprint ensures you aren't just reacting to market noise, but executing a well-thought-out, professional strategy.
Identify High-Probability Entry Triggers
Once your pre-trade blueprint is complete, the focus shifts from where to trade to precisely when. This is where the rubber meets the road. Knowing how to enter a trade effectively means learning to spot specific, reliable signals that tell you the time is right to act.
These signals, or entry triggers, are your final confirmation that the conditions you’ve been waiting for have arrived.
Think of it like a sniper waiting for the perfect shot. They've analyzed the terrain (market structure), identified the target area (support/resistance), and now they are waiting for that one clear moment to pull the trigger. For us price action traders, these moments are often revealed through candlestick and chart patterns.
Decoding Candlestick Signals
Individual candles and small combinations of them offer powerful insights into the real-time battle between buyers and sellers. They are the footprints of money, showing you who is winning the fight at critical price levels.
Instead of trying to memorize dozens of patterns, focus on understanding the psychology behind a few of the most potent ones.
Two of the most reliable candlestick triggers I've seen time and time again are:
- The Engulfing Bar: This is a large candle that completely "engulfs" the body of the previous one. A bullish engulfing bar (a big green candle swallowing a smaller red one) right at a support level is a clear signal that buyers have aggressively stepped in and overpowered sellers. It's a strong sign of a potential reversal or a continuation upwards.
- The Pin Bar (or Hammer): This candle has a small body and a long lower or upper wick. A bullish pin bar, with a long lower wick popping up at a support zone, shows that sellers tried to push the price down but were forcefully rejected by a surge of buyers. That rejection is your entry signal.
These patterns aren't magic; their power comes from their context. A pin bar floating in the middle of a range is just noise. But a perfectly formed pin bar rejecting a key daily support level after a pullback? That’s a high-probability entry trigger worth paying attention to.
Many of these triggers are identified through the systematic application of technical analysis for beginners, which provides a solid framework for interpreting these patterns in context.
This simple decision tree helps visualize the process of filtering for a high-probability entry.
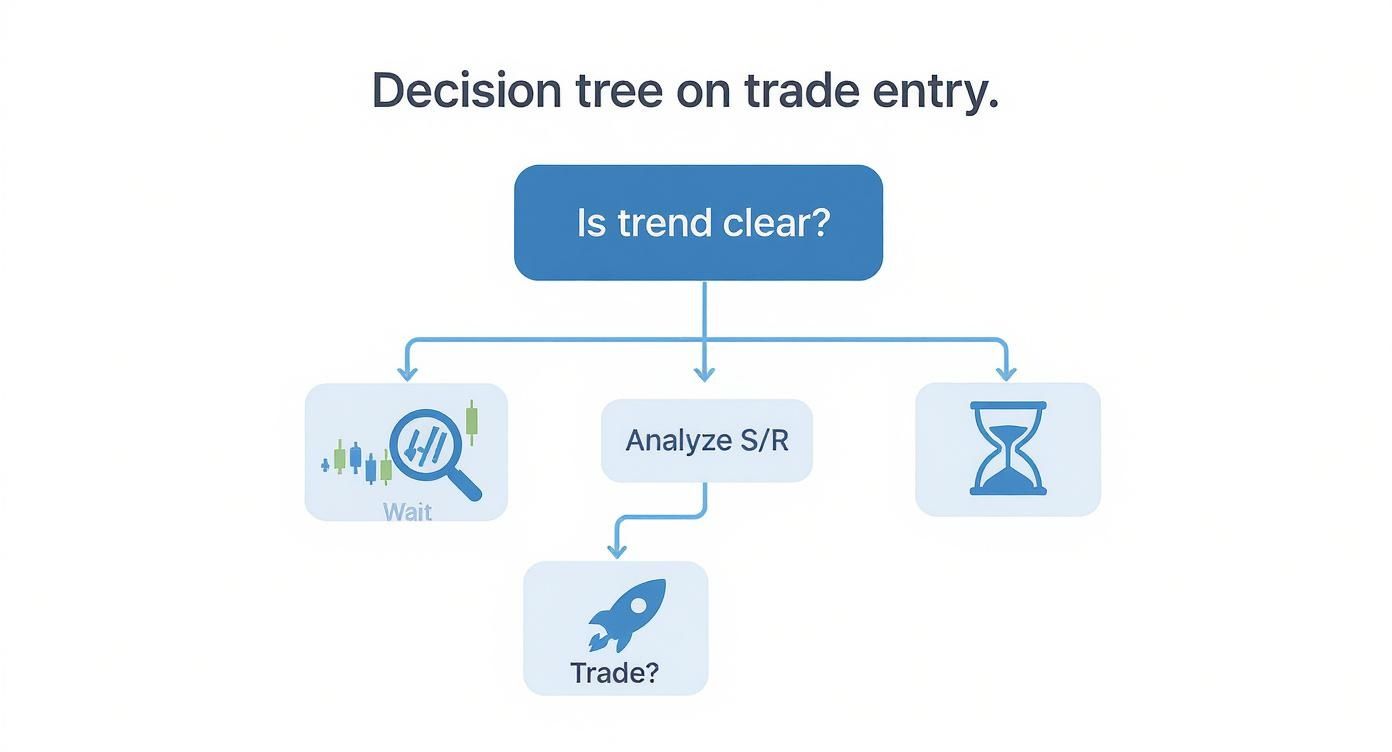
The visualization underscores a critical rule: a clear trend and a confirmed price level must be present before you even begin looking for a trigger to execute a trade.
Here's a quick look at some common price action triggers and where they work best.
Common Price Action Entry Triggers
| Trigger Type | What It Signals | Best Used In |
|---|---|---|
| Bullish/Bearish Engulfing Bar | A strong, sudden shift in momentum. | Trending markets at key support/resistance after a pullback. |
| Pin Bar (Hammer/Shooting Star) | Rejection of a price level. Sellers tried to push down (or buyers up) and failed. | Key horizontal levels, confluence zones, and trend lines. |
| Inside Bar | A pause or consolidation; indecision. | Trending markets, signaling a potential continuation breakout. |
| Breakout from Consolidation | Price breaking out of a tight range. | After periods of low volatility, often signaling the start of a new move. |
This table isn't exhaustive, of course, but it covers the bread-and-butter setups that form the foundation of many successful strategies. The key is matching the right signal to the right market condition.
Recognizing Classic Chart Patterns
Zooming out from individual candles, larger chart patterns can signal major shifts in market direction over days or weeks. These patterns represent prolonged periods of accumulation (buying) or distribution (selling) and often precede significant price moves. Learning to spot them gives you an edge in anticipating the market’s next likely move.
Key Takeaway: A high-probability entry is the convergence of context and a trigger. The context is your analysis of trend and key levels; the trigger is the specific price action pattern that says "now." One without the other is a recipe for failure.
Some of the most common and effective patterns include:
- Flags and Pennants: These are classic continuation patterns. A "flag" looks like a small, sloping rectangle that forms after a sharp, flagpole-like move. It represents a brief pause before the trend likely continues. Entering on the break of the flag is a textbook trend-following strategy.
- Head and Shoulders: This is a major reversal pattern. An inverse head and shoulders at the bottom of a downtrend signals a potential shift to an uptrend. The pattern consists of three troughs: a central "head" that is the lowest point, and two slightly higher "shoulders." A break above the "neckline" is the entry trigger.
- Breakouts: A breakout happens when the price moves decisively through established support or resistance, usually after a period of tight consolidation. A breakout with strong volume is a powerful signal that a new trend might be starting. Learning how to trade breakouts is a fundamental skill for capturing momentum.
By combining your big-picture analysis with these precise entry triggers, you move from guessing to executing with a plan. You're no longer just buying because the price is going up; you are entering because the price has pulled back to a key level in an uptrend and formed a clear bullish engulfing bar, giving you a statistical edge. This systematic process is the core of professional trading.
Execute Your Trade With Precision

A brilliant pre-trade plan and a perfect entry trigger mean nothing without a clean, decisive execution. This is the moment your analysis meets the raw reality of the market. Knowing exactly how to enter a trade using the right order type is a mechanical skill that separates consistent traders from those who constantly get slipped or miss their entries altogether.
Precision here is everything. A sloppy entry can instantly wreck your risk-to-reward ratio, turning a great setup into a mediocre one before it even has a chance to play out.
Choosing the Right Order Type for Your Entry
The first mechanical decision you'll make is picking your order type. This isn't a trivial choice; each one serves a very different strategic purpose. Rushing in with the wrong order can lead to a lot of frustration and unnecessary costs.
Let's break down the most essential ones you'll use:
- Market Order: This is the simplest one. It tells your broker to buy or sell immediately at the best available price. Its main advantage is speed and a guaranteed fill. The downside? You have zero price control, which can lead to slippage—getting a worse price than you wanted—especially in fast-moving markets.
- Limit Order: A limit order gives you control. You set the exact price you're willing to pay for a buy or receive for a sell. A buy limit goes below the current price, and a sell limit goes above. You get your price, but there's no guarantee your order gets filled if the market never trades at your level.
- Stop Order: Think of this as a trigger. A buy stop order is placed above the current price, and a sell stop order is placed below. Traders often use these to enter on breakouts, which fire off a market order once a specific price is breached.
For price action traders who live and breathe key support and resistance levels, limit orders are usually the go-to tool. Say you spot a bullish pin bar forming at a major daily support level of $50.00. You might place a buy limit order at $50.10, anticipating a small retest before the price pops. This ensures you either get in at your planned price or you don't get in at all.
The Critical Role of Volume and Liquidity
Placing an order is one thing; getting it filled efficiently is another. This is where volume and liquidity come into play. Liquidity is just the ease with which you can buy or sell something without causing a big price swing. High liquidity means lots of active buyers and sellers.
A trader who ignores volume and liquidity is like a sailor who ignores the tides. You might have a great boat and a perfect map, but if the water isn't there to carry you, you're not going anywhere. Clean entries depend on sufficient market participation.
Entering a trade has to be grounded in volume and liquidity data to make sure you get executed without massive price slippage. For instance, the New York Stock Exchange (NYSE) reported an average daily trading volume of roughly 1.36 billion shares as of September 2025. Meanwhile, the Nasdaq often sees an average daily volume over 9 billion shares. Those huge numbers mean deep liquidity, which helps tighten the bid-ask spread and allows for much smoother entries. You can see more about this by checking out these stock trading market statistics on bestbrokers.com.
Avoiding Costly Execution Errors
Even with the right order and a liquid market, simple mistakes can sabotage your trade. Here are a few practical tips I've learned (some the hard way) to keep your execution as clean as your analysis.
-
Double-Check Your Order Details: Before you click that final button, always verify the order type, the quantity (your position size), and the price. A simple typo can have you entering with 1000 shares instead of 100. It happens.
-
Factor in the Spread: The spread is that tiny difference between the bid (buy) price and the ask (sell) price. For a long trade, you enter at the ask. Always be aware of the spread, as it’s an immediate, small loss the second you're in the trade. In illiquid markets, spreads can widen dramatically.
-
Use Stop-Limit Orders for Volatility: This one is a game-changer. A stop-limit order combines a stop order with a limit order. It triggers at your stop price but will only fill at your specified limit price or better. This gives you control during those wild breakout moments, preventing you from getting filled at a terrible price if the market gaps right through your stop.
Mastering the mechanics of trade entry is non-negotiable if you want to trade professionally. It ensures the integrity of your plan holds up from analysis to action, giving your high-probability setups the best possible chance to succeed.
Manage Your Risk Before and After Entry
Knowing how to enter a trade is only half the battle. If I’m being honest, it’s the easier half. The part that really separates the pros from the pack is managing your risk.
Long-term success isn’t defined by your biggest winners; it's defined by how well you keep your losses small and manageable. Before you even think about clicking "buy" or "sell," your risk management plan needs to be rock solid. It's the one thing that should be completely non-negotiable.
A fantastic entry signal without a risk plan is just a gamble. Add that plan, and suddenly, it’s a calculated business decision.
Position Sizing The Right Way
You’ve probably heard the generic advice to "risk 1% of your account on every trade." It's a great starting point, but it's incomplete. How do you actually turn that 1% into a specific position size for the trade you're looking at right now?
The answer isn't a fixed number. It's a dynamic calculation based on two key pieces of information:
- Your Account Risk: This is the maximum dollar amount you're willing to lose. For a $10,000 account with a 1% rule, that number is $100. Simple.
- Your Trade Risk: This is the distance in pips, points, or cents from your entry price to where you’ll place your stop-loss. This number is dictated by the market's structure, not by how you're feeling.
The formula is straightforward: Position Size = Account Risk / Trade Risk. A trade with a wide stop-loss naturally requires a smaller position size. A setup with a very tight stop allows for a larger size. The key is that your dollar risk stays the same every single time.
Placing Your Stop-Loss Based on Logic
Your initial stop-loss is your safety net. It's the pre-defined price where you admit the trade idea was wrong, and you get out to protect your capital. The single biggest mistake I see traders make is placing stops based on random numbers—like a fixed 20 pips or 50 cents away from their entry. That's a recipe for disaster.
A professional stop-loss is always placed based on market structure. It should be at a logical level where, if the price hits it, the original reason for taking the trade is completely invalidated.
- For a long (buy) trade: Your stop should sit just below a recent swing low or the key support level you're buying from.
- For a short (sell) trade: Place your stop just above a recent swing high or the key resistance level you’re selling against.
This logical placement gives the trade enough room to breathe and wiggle around without getting stopped out by random market noise. If you want to dive deeper into the nuts and bolts of this, our guide on what is stop-loss in trading breaks it down in detail.
A stop-loss isn't a sign of failure; it’s a tool of preservation. Think of it as the cost of doing business in a world of uncertainty. Accepting small, controlled losses is the only way you'll be around to catch the big wins.
Evaluating Risk-to-Reward Potential
Okay, so you have your entry trigger and your logical stop-loss. The final piece of this pre-trade puzzle is figuring out the potential reward. The risk-to-reward ratio (R:R) is a simple comparison of how much you stand to lose versus how much you could realistically gain.
I, like many other traders, won't even look at a trade unless it offers a potential reward that's at least twice my risk (a 1:2 R:R). It’s a simple but powerful filter. If I’m risking $100, I need a logical, chart-based reason to believe the trade can make at least $200.
This forces you to be selective. It weeds out the mediocre setups and makes you focus only on the A+ opportunities where the potential payout truly justifies the risk. The great thing about trading with a positive R:R is that you don't even have to be right 50% of the time to be profitable over the long run.
Here’s a look at how position sizing adapts to different market scenarios to keep your risk constant.
Risk Management Scenarios
This table shows how the position size is adjusted based on the trade's specific parameters, like the asset's volatility and the stop-loss distance.
| Scenario | Account Size | Risk per Trade (1%) | Stop-Loss Distance | Calculated Position Size |
|---|---|---|---|---|
| Volatile Stock Trade | $25,000 | $250 | $2.50 per share | 100 shares ($250 / $2.50) |
| Forex Swing Trade | $10,000 | $100 | 50 pips | 0.2 lots (approx. $100 / 50 pips) |
| Index Day Trade | $50,000 | $500 | 10 points | 5 contracts ($500 / 10 points / $10 per point) |
Notice how the position size changes every time? The goal is always the same: keep the actual dollar amount at risk fixed at 1% of the account. This disciplined, consistent approach to risk is what truly separates amateurs from professionals.
Use Advanced Entry Tactics for an Edge
Once you’ve got a solid handle on the basics of price action entries, it's time to start looking for that extra edge. Layering in data from other markets can add a powerful layer of conviction to your trade ideas. This isn't about over-complicating your charts; it's about adding a few smart tools to get a deeper read on what the market is really thinking.
One of the most effective ways to do this is by peeking into the derivatives market, especially options and futures. These are the instruments that the larger, more informed players often use, and their activity can drop some serious clues about where price might be headed next.
Reading Sentiment in the Options Market
The options market is a fantastic, real-time gauge of bullish and bearish sentiment. You’re no longer just looking at a stock's price; you're seeing how other traders are literally placing their bets on future moves by buying calls (bullish) and puts (bearish).
Let's walk through a scenario. Say you’ve spotted a perfect bullish pin bar right at a key support level. Your price action analysis is screaming "buy."
But before you pull the trigger, you take a quick look at that day's options activity. What if you see a massive, unusual spike in call option volume for that same stock? This is a huge tell. It means a lot of other traders are also betting big on a move higher. This isn't your primary reason for taking the trade, but it's an incredible confirmation signal for the setup you already found.
Think of it as a second opinion from the market itself. Your technical setup is your primary thesis. A surge in confirming options activity is the market nodding in agreement, adding weight and confidence to your decision to enter the trade.
Gaining Exposure with Less Capital
Derivatives also open up new ways to get into a position without tying up a ton of cash. Let's be honest, buying a decent number of shares in a high-priced stock can be a huge capital commitment, exposing you to more risk than you might be comfortable with. Options can be a game-changer here.
Instead of buying 100 shares of a $500 stock (a $50,000 position), you could buy a single call option to control the same number of shares for just a fraction of that cost. This gives you a few key advantages:
- Defined Risk: The absolute most you can lose when buying a call or put is the premium you paid. No surprises.
- Capital Efficiency: You can get exposure to a big potential move using way less of your trading capital.
- Flexibility: There are options strategies for just about any market outlook you can imagine, from strongly directional to completely neutral.
The growth of derivatives has fundamentally changed the trading game. In April 2025, the worldwide volume of exchange-traded derivatives soared to 9.48 billion contracts. While options volume dipped in some areas, futures trading shot up by 13.5% year-over-year. This shows a clear preference for these tools when it comes to leverage and hedging. With a total open interest of 1.38 billion contracts, it's clear these advanced tools are in high demand. You can dig into more of these global derivatives market trends on fia.org.
By learning to incorporate signals from these markets, you can seriously refine your entry process and add a whole new dimension to your analysis. It's not about replacing your core price action strategy but enhancing it with information most retail traders completely ignore. It's this extra layer that can often make all the difference.
Common Questions About Entering Trades
Even with a solid game plan, you're always going to run into questions when it's time to pull the trigger. It's just part of trading.
Knowing how to handle these common sticking points is what refines your approach over time. It builds the confidence you need for clean, decisive action. Let's tackle some of the most frequent questions I hear from traders about how to actually get into a trade.
What Is the Best Time of Day to Enter a Trade?
If you're looking for a single "best" time, you'll want to focus on periods of peak market liquidity and volume.
For forex traders, that's almost always during the overlap of major sessions, like the London and New York overlap (8 AM to 12 PM EST). For stocks, the first and last hours of the trading day are typically the most volatile and active.
But here's the real answer: your strategy dictates the ideal time. A trend-following approach might do great in the strong momentum of the market open. On the other hand, a range-bound strategy could perform much better during the quieter midday hours.
The goal isn't to find a universally perfect time. It's to match your entry timing with the market conditions that give your specific trading plan the highest odds of working out.
How Do I Avoid Entering a Trade Too Early or Too Late?
Ah, the classic timing problem. This really boils down to two things: patience and preparation.
Entering too early is almost always driven by a fear of missing out (FOMO). To beat this, you have to be disciplined. Wait for your specific entry trigger—like a pin bar or an engulfing pattern—to fully form and close on your chosen timeframe. No jumping the gun. No exceptions.
Entering too late is usually the opposite problem: hesitation. The fix here is to have your entire trade planned out before the setup even materializes. You need to know your exact entry price, your stop-loss, and your potential target ahead of time.
A great way to take emotion out of it completely is to use limit or stop-entry orders. This automates the process and forces you to stick to your pre-defined plan.
Key Insight: Most timing errors aren't about bad analysis; they're psychological. A rock-solid, well-defined trading plan is your best defense against both FOMO and hesitation. It ensures you act based on your strategy, not your emotions.
Should I Use Multiple Indicators to Confirm My Entry?
While getting confirmation is a good idea, piling on too many indicators is a recipe for "analysis paralysis." You’ll just end up with a mess of conflicting signals that keep you from ever pulling the trigger.
A much better approach is to have a primary driver for your entry—for me, that's always price action—and then use just one or two non-correlated indicators for an extra layer of confirmation.
For example, you might use a moving average to confirm the overall trend direction and an oscillator like the RSI to hint at overbought or oversold conditions. The goal is confluence, where a few different tools all point to the same conclusion. You don't want a cluttered chart that just creates confusion.
At Colibri Trader, we teach you how to master these practical skills and build a robust trading plan based on proven price action strategies. Our mentorship programs cut through the noise, providing clear, actionable guidance to help you trade with confidence. Discover your trading potential and start your journey with us today.