


How to Draw a Trendline: Practical Guide for Smart Trading
Understanding Trendlines Without The Complexity
Trendlines can sometimes feel intimidating, like a tool only experienced market analysts can use. But the reality is much simpler. A trendline is just a line connecting two or more price points on a chart. This simple line can offer valuable insights into market direction and potential future price movements. Think of it as connecting the dots to see which way they're going. Two price points connected by a trendline illustrate the direction of price action.
This understanding replaces complexity with clarity. Instead of viewing trendlines as magical predictors, think of them as visual representations of market behavior. They reflect the combined decisions of buyers and sellers, influenced by factors ranging from news events to global economic shifts. Professional traders use trendlines to interpret these collective forces and anticipate how they might influence future price action.
For example, an upward trendline means buyers are consistently pushing prices higher, forming higher lows. A downward trendline signifies sellers are dominant, creating lower highs. This simple visual representation provides valuable context for making trading decisions. Drawing trendlines is fundamental to technical analysis, which uses historical data to predict future market movements. Investopedia defines trend analysis as using historical data, like price and volume, to identify patterns and project future trends. This approach is widely used in global markets, making it a crucial skill to develop. Learn more about trend analysis here.
Why Trendlines Matter in Modern Markets
Despite the constant changes in financial markets, trendlines have remained relevant for decades. This lasting relevance comes from the psychological factors driving market behavior. Human psychology, especially crowd behavior, significantly influences price fluctuations. Trendlines help visualize these patterns, revealing when fear or greed might be impacting market direction. You might find this interesting: How to master different types of trendlines.
Furthermore, institutional trading patterns, often involving large trades, can be identified using trendline analysis. These large players can greatly impact market momentum, and their actions often leave clear marks on price charts that trendlines can capture. This makes trendlines a tool for understanding both individual trader psychology and the influence of institutional investors.
The Power of Simplicity
While sophisticated trading strategies often involve complex indicators and algorithms, trendlines remain a powerful tool due to their simplicity. They offer a clear, objective view of market direction, avoiding the subjective interpretations that can sometimes complicate other analysis methods. This clarity is especially helpful for new traders learning to read charts and understand market dynamics.
Drawing a trendline only needs two points on a chart. This simplicity lets traders quickly assess market direction without getting lost in complex calculations or overwhelming data. This accessibility makes trendlines a versatile tool for traders of all levels. Understanding this basic concept is the first step toward mastering trendline drawing and using it effectively.
Choosing Tools That Actually Work For You
Selecting the right platform is crucial before you start drawing trendlines. Your chosen tools can significantly impact the accuracy and efficiency of your analysis. This section explores various charting platforms, highlighting their strengths and weaknesses to help you make a smart choice, regardless of your budget or desired features.
Free vs. Paid: Finding the Right Balance
Many free charting platforms provide excellent basic trendline analysis functionality. These are great starting points for beginners or those using simple trendlines. As your trading strategies become more complex, a paid platform with advanced features might be a worthwhile investment, providing you with more sophisticated tools and deeper data analysis capabilities.
Free platforms typically offer basic drawing tools and historical price data. This is perfectly adequate for drawing basic trendlines and spotting core trends. Many also offer mobile apps for convenient on-the-go analysis, essential for traders needing constant market access.
Paid platforms, however, often include advanced features like automated trendline detection, multiple timeframe analysis, and integrated indicators. These tools save time and can increase accuracy. Real-time data access, a must-have for active traders, is another common advantage.
Essential Features for Effective Trendline Drawing
Whether you choose free or paid, certain features are vital for effective trendline drawing. A clean, intuitive chart interface is paramount. A cluttered interface can obscure key price points and make drawing accurate lines difficult, leading to market misinterpretations and poor trading decisions.
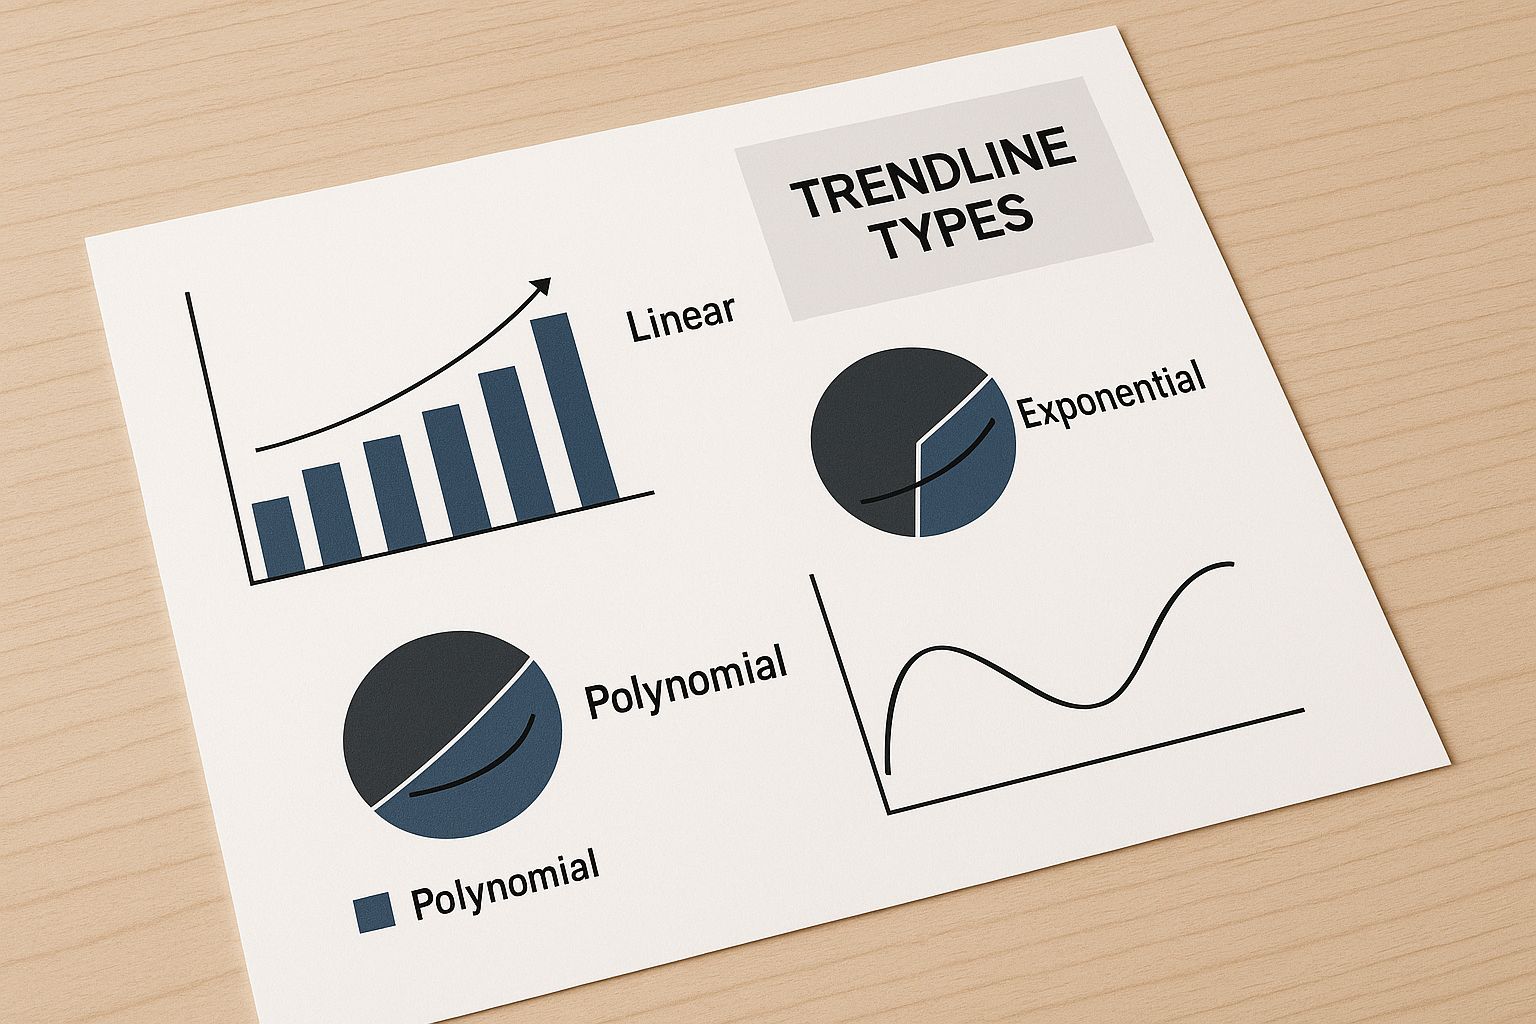
The infographic above shows different trendline types on a financial chart. The clear definition of each trendline allows traders to quickly understand their meaning and apply them to their analysis. Understanding these types is key to accurate trendline drawing and price action interpretation.
Customizable drawing tools are also essential. These let you adjust line thickness, color, and style for better visual clarity and easier analysis. The ability to save and load chart setups is also important for an efficient workflow, avoiding the need to redraw trendlines every time.
Finally, smooth integration with your existing trading system is important. The platform should ideally integrate with your brokerage account for direct trade execution from the charting interface, a streamlined approach that saves valuable time and reduces potential errors.
To help you choose the best platform, we've compiled a comparison table of the top trendline drawing platforms:
To help you make an informed decision, let's look at a comparison of some popular charting platforms. The table below highlights their key features, pricing, and what they are best suited for.
Top Trendline Drawing Platforms Comparison
Real-world comparison of features, costs, and user experience across leading charting platforms
| Platform | Free Version | Key Features | Best For | Price Range |
|---|---|---|---|---|
| TradingView | Yes | Extensive charting tools, community features, alerts | Beginners to advanced traders | Free – $59.95/month |
| MetaTrader 4/5 | Yes (through brokers) | Algorithmic trading, custom indicators, wide broker support | Forex traders, algorithmic traders | Dependent on broker |
| NinjaTrader | Yes (for simulated trading) | Advanced charting, backtesting, order flow analysis | Active traders, day traders | $999 – $1,599 (lifetime license) or monthly lease |
| Thinkorswim | Yes (with TD Ameritrade account) | Powerful analysis tools, options trading features, educational resources | TD Ameritrade clients | Free (with account) |
This table highlights key differences in pricing, features, and target user base, allowing you to quickly assess which platform might be best for your needs. TradingView offers a strong free version with a vibrant community, while MetaTrader focuses on forex and algorithmic trading. NinjaTrader caters to active traders with its advanced features, and Thinkorswim provides a comprehensive platform for TD Ameritrade users.
Choosing the Right Fit
The best platform ultimately depends on your individual needs and trading style. Consider factors such as your budget, experience level, and trading strategy complexity. Keep it simple if possible. The right tools allow you to focus on what matters most—mastering trendline drawing and using it for informed trading decisions.
Your First Trendline: A Step-By-Step Approach
Drawing a trendline might seem straightforward, but truly mastering this essential technical analysis skill takes a systematic approach. This guide breaks down the process seasoned traders employ, giving you the confidence to identify and draw accurate trendlines. Let's start with the fundamental principle: connecting key price points.
Identifying Key Pivot Points
The cornerstone of any reliable trendline lies in correctly pinpointing pivot points, also known as swing highs and swing lows. These are the points where price action distinctly reverses direction. In an uptrend, a swing low represents a temporary dip before the price resumes its upward movement. Conversely, in a downtrend, a swing high is a short-lived surge before the price continues its downward path. These points serve as anchors for your trendlines.
- Uptrend: Connect the swing lows. Visualize a rising staircase – each step represents a swing low, and the trendline acts as the railing supporting the upward climb.
- Downtrend: Connect the swing highs. Imagine a descending staircase – each step corresponds to a swing high, and the trendline serves as the railing guiding the downward descent.
For instance, if a stock’s price drops to $20, then climbs to $25, dips again to $22 before reaching $30, the $20 and $22 price points would be your swing lows for an uptrend.
Drawing Your Trendline
After identifying at least two distinct pivot points, you're ready to draw your trendline. For an uptrend, draw a line connecting the swing lows. For a downtrend, connect the swing highs. It's essential that the trendline doesn't slice through the body of any candlesticks. The line should only touch the wicks, indicating the price respected these levels as support or resistance. This precision makes for a more accurate trend representation.
Major Vs. Minor Trends: Focusing on What Matters
It's important to remember that not all trends hold the same significance. Major trends embody the overarching, long-term market direction. These are the trends you should prioritize when charting trendlines. Minor trends, conversely, are short-term price fluctuations within the broader major trend. While minor trends can provide short-term trading opportunities, fixating solely on them can obscure the bigger picture. Consider major trends as ocean currents and minor trends as waves within those currents. Riding a wave is fine, but understanding the current’s direction is crucial for long-term navigation.
Adapting to New Price Data
Markets are inherently dynamic. As new price data comes in, your initial trendline may need adjustments. This is completely normal. The aim isn't to draw a static line, but rather a dynamic instrument that reflects the evolving market conditions. This means adjusting your trendline's angle or position as new swing highs and lows develop. This ongoing adaptation is key to maintaining the accuracy and relevance of your analysis.
Avoiding Common Mistakes
A frequent beginner mistake is forcing a trendline to fit the price action. Don't do this. The trendline should flow naturally, connecting clear pivot points. If you find yourself continually tweaking your trendline, you're likely not identifying the key swing highs and lows accurately. Another common oversight is neglecting to analyze multiple timeframes. Examining a trend on various timeframes—weekly, daily, hourly—provides a more comprehensive view and bolsters your analysis.
Advanced Techniques That Separate Winners From Losers
Mastering trendlines goes beyond simply connecting two points on a chart. It involves understanding the subtleties and using advanced techniques that can significantly improve your trading. This section explores those advanced techniques, giving you the tools to analyze the markets like an expert.
Trend Channels: Containing the Flow
A trend channel expands on the basic trendline. It consists of two parallel lines. The first line connects the swing lows in an uptrend or the swing highs in a downtrend (this is your standard trendline). The second line is drawn parallel to the first, touching the opposite swing points – swing highs in an uptrend and swing lows in a downtrend. This forms a channel containing the price action.
Trend channels are very useful for predicting potential price reversals and setting profit targets. They offer more defined entry and exit points for improved trading accuracy. For instance, a price bouncing off the lower trendline of an upward channel might signal a good buying opportunity.
Fan Lines: Gauging Trend Strength
Fan lines offer a different approach to evaluate trend strength and spot potential reversals. You begin by identifying a significant swing low and drawing multiple trendlines connecting to subsequent swing highs. If the price breaks through several fan lines, it suggests weakening momentum and a possible trend reversal. This can act as an early warning system, allowing you to modify your strategy. Think of fan lines as a series of support levels in an uptrend, with each break indicating increasing weakness. You might be interested in learning more about other useful trend indicators: How to master the 7 best trend indicators.
Speed Resistance Lines: Anticipating Market Turns
Speed resistance lines are drawn at specific angles (commonly 1×1, 1×2, and 1×3) to pinpoint potential support and resistance areas. These lines can help you anticipate price resistance. A price struggling to break through a speed resistance line may suggest strong selling pressure. A 1×1 line, representing a 45-degree angle, is often considered a significant resistance level.
Multiple Timeframe Analysis: A Broader Perspective
Analyzing trendlines on different timeframes—weekly, daily, hourly—provides a more complete picture. A trend seen across multiple timeframes is much stronger than one appearing on a single chart. This helps you filter out short-term fluctuations and identify the prevailing market direction. For example, an uptrend appearing on both weekly and daily charts reinforces the bullish signal.
Internal Trendlines: Zooming In for Precision
Within larger trends, you'll find smaller, internal trendlines. These shorter-term trends can reveal more precise entry and exit points within the overall market direction. Imagine magnifying a portion of your main trendline to find these smaller, detailed patterns. This allows for refined trading decisions to maximize potential profits within the larger trend.
Combining Indicators: Enhanced Confirmation
Trendlines are powerful by themselves, but using them with other technical indicators like the Relative Strength Index (RSI) or Moving Averages (MA) provides additional confirmation. This layered approach improves the accuracy of your analysis, leading to better-informed trading decisions.
The use of historical data in market analysis is crucial for understanding trends and predicting future market movements. Websites like Ginnie Mae offer monthly Global Market Analysis reports, detailing significant market shifts and trends. These reports, similar to how trend analysis is applied, use historical data to project long-term market directions. Explore this topic further here.

By mastering these advanced trendline techniques, you can turn a simple drawing tool into a powerful system for understanding market movements. This knowledge allows you to identify high-probability trading opportunities and navigate market complexities with more confidence.
Making Historical Data Work In Your Favor
Your trendline analysis is as good as the historical data you use. Think of it as baking – the finest ingredients create the best results. Using high-quality historical data creates more reliable trendlines, leading to better-informed trading decisions. How do successful traders collect, understand, and use this price history?

The Importance of Time Periods
Different time periods offer unique perspectives. Short-term data (hourly, daily) shows recent market sentiment and fleeting trends. Long-term data (weekly, monthly, yearly) reveals broader trends and overall market direction. Balancing both is key for a comprehensive understanding.
It’s like using a map. Zooming out shows the highway, while zooming in reveals local roads. Both views are necessary for successful navigation.
Identifying Crucial Price Points
Not all price points are created equal. Significant price points show clear market reactions – reversals, bounces, or breaks. These are your swing highs and swing lows, the foundation of accurate trendlines.
These points represent robust support and resistance, indicating where the market finds its floor or ceiling.
Balancing Recent Activity and Long-Term Patterns
How do you reconcile recent activity with long-term patterns? It's about balancing the short-term with the long-term. Recent moves hint at immediate sentiment, while long-term trends illustrate established market direction.
For instance, a short-term pullback during a long-term uptrend might be a buying opportunity, not a reversal. This distinction is crucial for sound trading. Learn more in our article about How to master supply and demand trading.
Adding Volume to the Equation
Price reflects market action; volume reveals the why. High volume during price swings confirms their strength. Think of a crowd pushing a car uphill. The larger the crowd (volume), the more likely the car (price) will ascend.
That's why volume analysis is vital to your trendline strategy. It shows the force behind price action, validating your trendlines.
Accessing and Interpreting Market Data
Reliable market data is available from various sources, including brokerage platforms and financial news websites. Interpreting market analytics strengthens your trendline drawing.
For example, economic indicators, news events, and even social media sentiment can sway prices. Understanding these factors gives context to your analysis, helping you anticipate market reactions.
Systematic Approach to Confidence
By systematically analyzing historical data – selecting suitable time periods, identifying key price points, and considering volume – you turn price fluctuations into recognizable patterns. This organized approach builds confidence in your trendlines, improving how you analyze and react to market movements.
Real Markets, Real Results Around The World
Trendline analysis isn't just some theoretical concept found in textbooks. It's a practical tool used by traders worldwide, across a diverse range of markets. Savvy traders recognize the unique characteristics of each market and adapt their strategies accordingly. This section explores how trendline techniques can be applied to different asset classes and global market conditions.
Adapting Trendlines to Different Markets
Every market dances to its own rhythm. The fast-paced, 24/7 nature of the forex market leads to quicker trend shifts than the more deliberate commodity markets. Successful traders tailor their trendline analysis to these varying paces. Shorter timeframes might be key in forex, while longer-term trendlines could be more insightful for commodities.
-
Stocks: Analyzing stock trends on major exchanges like the NYSE means understanding the interplay of company performance, industry news, and overall economic sentiment.
-
Forex: Currency pairs react to a global symphony of events, interest rate changes, and geopolitical factors, requiring a nuanced approach to trendline analysis.
-
Commodities: Supply chains, seasonal patterns, and global demand all influence how we draw trendlines in commodity markets like oil or gold.
-
Cryptocurrencies: The inherent volatility of crypto demands constant vigilance and adaptation of trendlines, often focusing on shorter timeframes.
Global Influences and Trend Behavior
Cultural and economic factors add further layers of complexity. The FTSE in London might react differently to news than the Nikkei in Tokyo, reflecting regional economic conditions and investor psychology. Traders need to consider these cultural nuances when interpreting global trends.
The interconnectedness of global markets adds another dimension. An event in one corner of the world can ripple across markets, impacting seemingly unrelated assets. Staying informed about global events becomes essential for accurately drawing trendlines. A significant policy change in the US, for example, can immediately influence market trends in Asia and Europe.
The growth of international trade underscores this interconnectedness. According to Our World in Data, exports have increased more than 40 times since 1913, demonstrating the expanding reach of global commerce.
Trendline Analysis in the Modern World
Today's markets are a global network. Information travels at unprecedented speed, influencing how we analyze trends. This interconnectedness provides opportunities regardless of your location or preferred market. Recognizing these global relationships can uncover trading opportunities that transcend borders.
Practical Applications
Let's explore some practical applications of trendlines:
-
Identifying Support and Resistance: A well-drawn trendline can pinpoint key support and resistance levels, guiding entry and exit points.
-
Forecasting Price Targets: Extending a trendline can project potential future price targets, helping set realistic profit expectations.
-
Managing Risk: Trendlines can inform the placement of stop-loss orders. A break in a trendline can signal a shift in market direction, triggering a move to minimize losses.
-
Spotting Trend Reversals: Changes in a trendline's slope, or breaks above or below established trends, can provide early warnings of potential reversals.
To make the most of trendline analysis, consider the following table summarizing trendline performance across global markets:
Trendline Performance Across Global Markets
Analysis of trendline reliability and success rates across different markets and timeframes
| Market Type | Success Rate | Optimal Timeframe | Key Factors | Risk Level |
|---|---|---|---|---|
| Stocks | Varies widely | Depends on specific stock and market conditions | Company performance, industry news, economic sentiment | Medium to High |
| Forex | Generally higher due to clear trends | Short to medium term (minutes to days) | Global events, interest rates, geopolitical factors | High |
| Commodities | Moderate | Longer term (weeks to months) | Supply chains, seasonal factors, global demand | Medium |
| Cryptocurrencies | Lower due to volatility | Short term (minutes to hours) | Market sentiment, regulatory news, technological developments | Very High |
This table demonstrates the importance of adapting your trendline strategy to each specific market. While forex might exhibit clearer trends suitable for trendline analysis, the high volatility necessitates careful risk management. Conversely, commodities often require a longer-term outlook. Finally, the volatile nature of crypto makes trendline analysis more challenging.
By understanding global market dynamics and adapting your approach to trendline analysis, you can use this powerful tool to enhance your trading strategy in any market.
Key Takeaways
Drawing trendlines effectively is a cornerstone of technical analysis. It’s a skill that separates consistently profitable traders from those who struggle. This section distills key principles into actionable steps you can use immediately, highlighting common pitfalls and offering a roadmap for mastering trendline analysis.
Mastering the Basics: A Practical Checklist
Beginners often overcomplicate trendline drawing. Here's a simplified checklist to get you started:
-
Identify Clear Swing Points: These are the swing highs and lows – the turning points in price action. Look for decisive reversals, preferably confirmed by increased volume. These points are the anchors of your trendlines.
-
Connect the Dots, But Don't Force It: Connect at least two swing lows for an uptrend, or swing highs for a downtrend. The line should touch the wicks of the candles, not cut through the bodies. If you’re forcing the line, re-evaluate your swing point selection.
-
Multiple Timeframes Matter: Analyze the same trend on different timeframes (weekly, daily, hourly). A trend validated across multiple timeframes is much more reliable than one appearing on a single chart.
This straightforward process forms the foundation of effective trendline analysis. Mastery comes with consistent practice and careful observation.
Beyond the Basics: Advanced Strategies for Trendline Mastery
While the basic principles are essential, advanced techniques can significantly improve your trendline analysis:
-
Trend Channels: Drawing a parallel line to your initial trendline creates a channel, containing the price action within its boundaries. This can help predict potential reversals and set profit targets.
-
Fan Lines: Multiple trendlines radiating from a single point can help gauge trend strength. Breaks through multiple fan lines can signal potential trend weakness.
-
Combining Indicators: Using trendlines with indicators like the Relative Strength Index (RSI) or moving averages adds another layer of confirmation, potentially improving the accuracy of your analysis.
These techniques aren't foolproof, but they're additional tools to refine your understanding of market dynamics.
Psychology and Discipline: The Trader's Mindset
Trendline analysis isn't just about drawing lines; it’s about discipline and managing emotions. Avoid these common psychological traps:
-
Forcing Trendlines: Don't try to make the market fit your bias. Let the trendlines emerge naturally from the price action. Constantly adjusting your lines suggests you're not accurately assessing the trend.
-
Ignoring Breakouts: Trendlines aren't infallible. When a valid break occurs (confirmed by price closing beyond the line and increased volume), acknowledge it. This is crucial for managing risk and avoiding significant losses.
Developing a disciplined approach is vital for consistently applying trendline analysis effectively.
From Novice to Expert: A Realistic Timeline
Like any skill, mastering trendline analysis takes time and dedicated practice. Don't expect to become an expert overnight. Here's a realistic timeline:
-
First Month: Focus on accurately identifying swing highs and lows and drawing basic trendlines. Practice on historical charts to train your eye.
-
Months 2-3: Experiment with trend channels and fan lines. Begin incorporating indicators to confirm your trendline analysis.
-
Months 4-6: Refine your understanding of varying market conditions and adapt your trendline approach accordingly. Develop a systematic process for analyzing multiple timeframes.
-
Beyond 6 Months: Continuously refine your techniques and broaden your knowledge. Focus on integrating trendline analysis into a comprehensive trading strategy.
This timeline is a benchmark for your progress. Remember, consistent effort and a commitment to learning are essential for long-term success.
Your Next Step: Transform Your Trading With Colibri Trader
Ready to elevate your trendline analysis – and your entire trading approach? Colibri Trader provides the tools and guidance you need to succeed. From beginner-friendly courses to advanced strategies, we empower traders with a straightforward, price-action-based approach. Visit us today and discover how we can help you achieve your trading goals.