


How to Calculate the Loss Percentage: A Simple Guide
Calculating your loss percentage is pretty simple on the surface. You just divide the amount of money you lost by your initial investment and then multiply that by 100.
This basic formula, (Loss / Original Cost) x 100, is the first step in turning that sinking feeling in your gut into a concrete, usable piece of data. It’s the universal language for measuring trading performance.
Why Understanding Loss Percentage Is Critical

Before we jump into the mechanics, it’s vital to understand why this simple calculation is a non-negotiable skill for any serious trader. Knowing your loss percentage forces you to shift from emotional reactions to data-driven decisions—a critical skill during volatile market swings.
This one metric creates a clear benchmark to compare the performance of totally different assets. It allows you to objectively evaluate a -15% loss on a tech stock against a -5% loss on a real estate investment, giving you an honest look at your entire portfolio.
From Emotion to Strategy
Your gut feeling tells you a trade went badly, but a percentage tells you how badly. This is a crucial distinction. It empowers you to set precise limits and build a disciplined trading approach. Without this data, you’re basically flying blind, guided only by fear and hope.
By quantifying your losses, you can create and actually stick to a trading plan. It's the difference between guessing and executing a strategy, which is the absolute foundation of long-term success.
Learning from Market History
History is full of brutal reminders of why tracking losses is essential for survival. On Black Monday, October 19, 1987, the Dow Jones Industrial Average (DJIA) experienced its largest single-day percentage drop ever, plummeting a shocking 22.61%.
Events like that really underscore why you need a firm grasp on your portfolio's performance at all times. They’re not just scary stories; they are lessons in risk.
Ultimately, mastering this calculation is a fundamental step in your trading journey. From here, you can build on this by digging into the core principles of financial protection. Our guide to risk management for traders is a great place to start. This knowledge helps you protect your capital and make smarter, more informed decisions down the line.
The Simple Formula for Loss Percentage
Figuring out your loss percentage doesn't require any fancy software—just a bit of simple math. Honestly, it's one of the most fundamental skills any trader needs. It gives you a clear, objective snapshot of how a trade is performing (or underperforming). The whole thing comes down to one straightforward formula you can use for any asset.
The formula you'll want to remember is: Loss Percentage = ((Cost Basis – Current Value) / Cost Basis) * 100.
This looks more complicated than it is. Let's quickly break down what those terms mean, because getting these right is the key to an accurate calculation.
Loss Percentage Formula Components
This table demystifies each part of the formula.
| Component | Definition | Example |
|---|---|---|
| Cost Basis | This is the total amount you paid to acquire the asset. It should include the purchase price plus any commissions or fees. | You buy 100 shares at $10 each with a $5 commission, so your Cost Basis is $1,005. |
| Current Value | This is what the asset is worth right now in the market—the price you'd get if you sold it this very second. | Those same shares are now trading at $8 each, making their Current Value $800. |
| Difference | The result of subtracting the Current Value from your Cost Basis. This is your total loss in dollars. | $1,005 (Cost Basis) – $800 (Current Value) = $205 loss. |
Once you have these numbers, the rest is just plugging them into the formula to get that final percentage.
Putting the Formula into Action
Let's walk through a real-world example.
Imagine you bought into a promising tech stock, spending $5,000. After a few rough months for the market, you check your position and see its value has dropped to $4,200. You need to know exactly how much you're down in percentage terms.
First, you calculate the raw dollar loss. That's your initial cost minus the current value:
- $5,000 – $4,200 = $800.
So, you're down $800.
Next, to put that loss into perspective, you divide it by your original investment (your cost basis):
- $800 / $5,000 = 0.16.
Finally, just multiply by 100 to turn that decimal into a percentage:
- 0.16 * 100 = 16%.
Your investment has taken a 16% loss. That's it. It’s a simple calculation that gives you a powerful piece of data for managing your portfolio.
The infographic below lays this process out visually, making it even easier to follow.
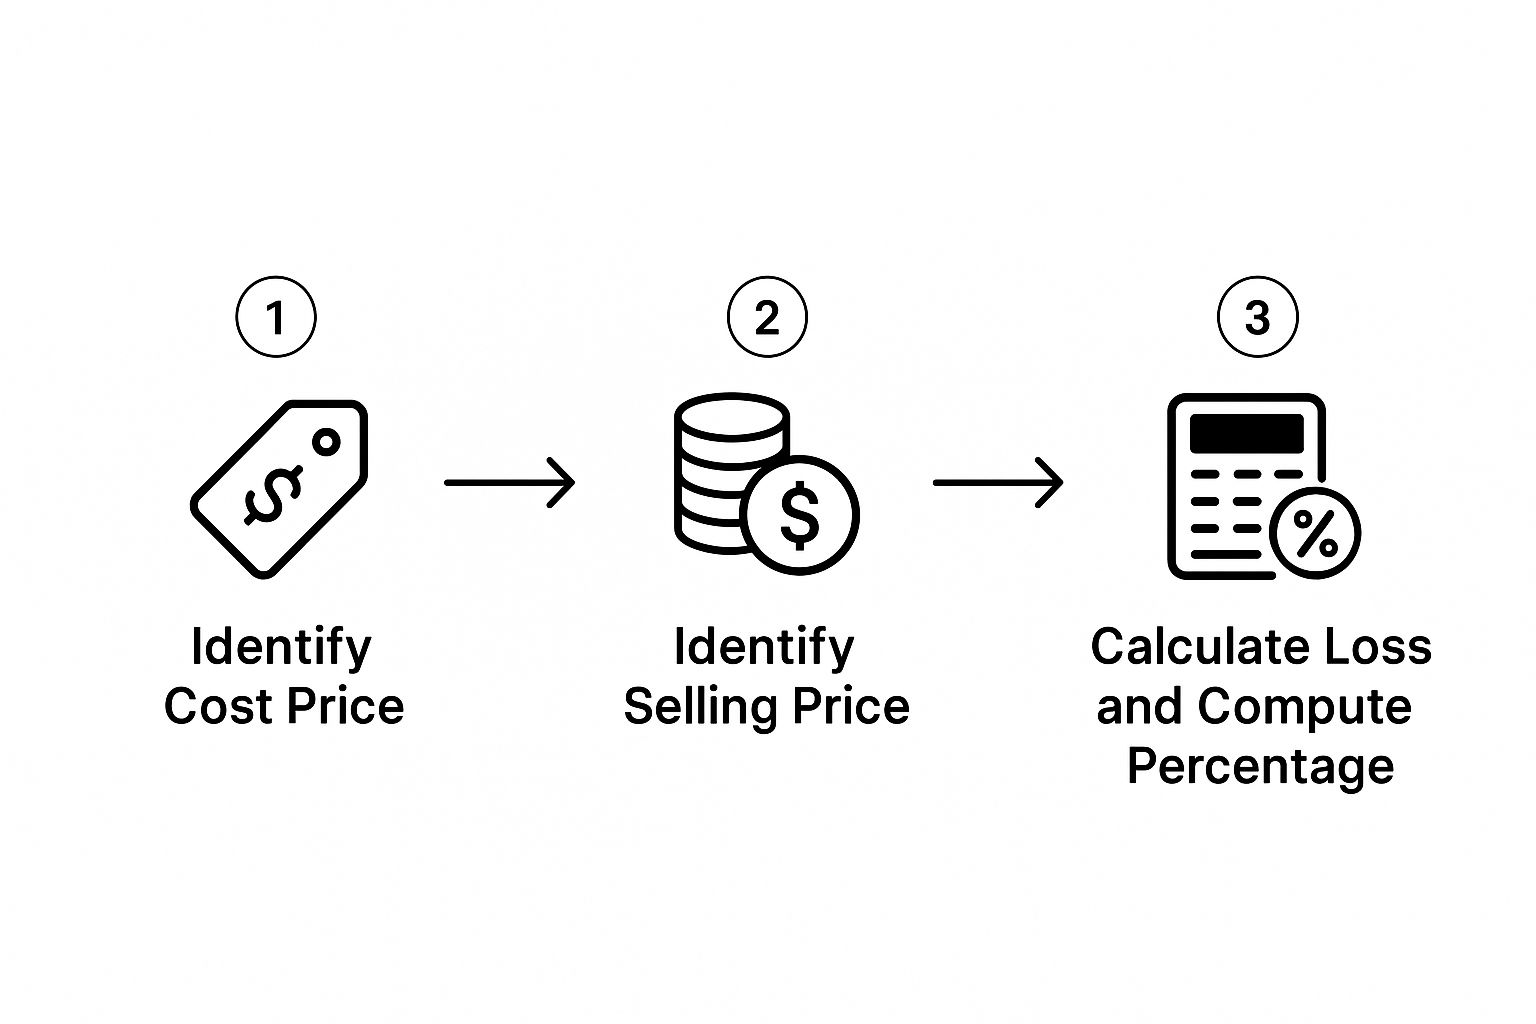
The visual flow really helps reinforce the steps: identify your cost and current value, find the difference, and then do the final division to get your loss percentage.
While this guide is focused on calculating losses, the other side of the coin is just as important. Understanding how to track your gains gives you a complete picture of your performance. If you want to get the full view, you can also learn how to calculate investment returns like a pro. Knowing both helps build a much stronger foundation for analyzing your entire portfolio.
Calculating Loss Across Different Investments
Theory is one thing, but seeing how the loss percentage formula actually works in the real world is where the confidence comes from.
The beauty of this simple calculation is its sheer versatility. It works the same whether you're looking at stocks, a crypto coin, or even a classic car in your garage. Let's walk through a few scenarios you might run into as a trader.
Each example will break down the cost basis, the final value, and how to plug them right into the formula. This is the practical side of trading that really solidifies your understanding.
Example 1: The Tech Stock That Tumbled
Imagine you jumped into a popular tech stock, investing $10,000 when shares were at $200 a piece. A year goes by, and after some rough earnings reports, the market shifts. The stock price drops to $140 per share. You decide it's time to cut your losses and sell.
Here's the math:
- Figure out the dollar loss: Your initial $10,000 investment is now worth $7,000. The difference is a $3,000 loss.
- Divide that loss by your original cost: $3,000 / $10,000 = 0.30.
- Convert to a percentage: 0.30 x 100 = 30%.
You've realized a 30% loss. This single number is crucial. It tells you the real impact on your portfolio and it’s a key part of figuring out what is a maximum drawdown you're willing to tolerate.
Example 2: The Crypto Correction
Now for a more volatile asset. Let's say you bought $2,500 of a hot cryptocurrency during a bull run. The entire market takes a nosedive, and your holding drops to $1,600.
- Loss in Dollars: $2,500 – $1,600 = $900
- Divide by Original Cost: $900 / $2,500 = 0.36
- Loss Percentage: 0.36 x 100 = 36%
That crypto position took a 36% hit. By calculating the percentage, you can directly compare its performance to the tech stock, even though the dollar amounts are completely different. It puts everything on a level playing field.
Putting this in perspective is key. Historically, major market downturns aren't unusual. The S&P 500, for example, has seen six drops greater than 30% since the 1950s. The most recent was a sharp 34% fall in early 2020. Knowing these numbers helps contextualize your own losses.
Example 3: When a Physical Asset Depreciates
The formula isn't just for financial markets. What if you bought a collectible car for $50,000 as an investment? A few years later, that specific model isn't as popular, and its appraised value is now only $42,000.
- Loss in Dollars: $50,000 – $42,000 = $8,000
- Divide by Original Cost: $8,000 / $50,000 = 0.16
- Loss Percentage: 0.16 x 100 = 16%
Your collectible car has depreciated by 16%. As you can see, no matter the asset, the method for calculating loss is exactly the same. It's a universal tool for analyzing performance and making smarter decisions.
Going Beyond the Formula: Common Pitfalls in Loss Calculation
Knowing how to plug numbers into the loss percentage formula is step one. But honestly, that's the easy part. The real skill comes in sidestepping the common mistakes and mental traps that can mess with your numbers and lead to some pretty bad decisions.
Let's dig into a few of the nuances that trip up even experienced traders.
Unrealized vs. Realized: What's the Real Damage?
One of the first things you need to get straight is the difference between a loss on paper and a loss in your bank account. They feel similar, but they're worlds apart.
- Unrealized Loss: This is a "paper loss." Your stock or asset is down in value, but you're still holding it. It's a theoretical loss that only exists on your screen.
- Realized Loss: This happens the second you hit "sell" for less than you paid. This is a real, tangible hit to your capital. The money is gone, and it has actual tax implications.
This isn't just semantics. An unrealized loss has the potential to recover. A realized loss is permanent. Getting this right is fundamental to good portfolio management.
The Psychology of Seeing Red
Beyond the hard numbers, your own brain can be your worst enemy. There's a well-documented cognitive bias called loss aversion, which basically means the pain of losing money feels about twice as strong as the pleasure of making the same amount.
That's why a 10% loss feels gut-wrenching, while a 10% gain just feels… pretty good. This emotional imbalance is what causes traders to make irrational calls, like clinging to a losing position way too long, just hoping it'll bounce back.
You have to acknowledge this bias to overcome it. Treat your loss percentage calculation as a trigger for a logical strategy review, not an emotional panic button.
This mental pressure gets dialed up to eleven during major market downturns. Just look at the Great Depression. The Dow Jones Industrial Average fell a staggering 89% from its 1929 peak to its 1932 low. Understanding how to calculate loss during historical meltdowns is key to grasping market history and managing your own reactions when things get ugly. You can find more on historic market crashes over at Morningstar.com.
The Problem with a Messy Cost Basis
Another trap appears when your cost isn't a single, clean number. What if you're using a strategy like dollar-cost averaging (DCA), buying shares at different times and different prices? You can't just use your first purchase price; that'll give you a completely warped view of your position.
To get an accurate loss percentage, you have to calculate your average cost basis.
It's simple: take the total amount of money you've spent and divide it by the total number of shares you own. That's your true cost per share. Use that number as your "Cost Basis" in the formula. Skipping this step means you're flying blind, making decisions based on faulty data.
Using Loss Percentage to Make Smarter Decisions

Knowing your loss percentage isn't just about staring at a painful number. It's a tool, plain and simple. It gives your next move a purpose, transforming a negative outcome into a core piece of your risk management strategy. This simple calculation is what moves you from reacting with your gut to executing a plan you've already laid out.
One of the most immediate, practical ways to use it is with your stop-loss orders. Instead of just guessing a price that feels right, you can tie your stop-loss directly to a percentage you're willing to lose. For me, I might decide that a 7% loss on any single trade is my absolute line in the sand.
This isn't guesswork; it's a rule. Once you know that number, you can place your stop-loss at the exact price that reflects your limit, shielding your capital from those devastating drawdowns that can wreck an account.
Diversification and Rebalancing
That loss percentage figure also tells a story about your entire portfolio. Seeing a steep loss in one asset can be a pretty jarring reminder of why we diversify in the first place. A portfolio that's spread out can absorb a hit from one bad investment because, hopefully, gains elsewhere are picking up the slack.
A big loss percentage can be the perfect trigger to rebalance. If an asset’s value has plummeted, it might be time to take some profits from your winners and reallocate. This keeps your portfolio aligned with your original risk tolerance and goals.
This goes beyond just managing risk on the charts—it can have real-world implications for your taxes. Savvy investors often use losses to their advantage. To potentially minimize what you owe and make smarter capital decisions, it's worth exploring strategies like Crypto Tax Loss Harvesting, especially in volatile markets.
At the end of the day, your loss percentage provides critical context for your entire trading game plan. It tells you when a trade is going south and helps you see if your risk tolerance actually matches your market exposure. It's also the bedrock for more advanced metrics; for instance, you can’t accurately calculate the risk-reward ratio if you don't first understand your potential loss. By using these numbers proactively, you're not just trading—you're building a more resilient, strategic financial approach.
Frequently Asked Questions About Loss Percentage
Even once you have the formula nailed down, a few questions always seem to bubble up. Let's run through the most common ones I hear to make sure you have the complete picture of calculating loss percentage and actually using it in the real world.
What Is an Acceptable Loss Percentage?
This is the million-dollar question, and the honest-to-goodness answer is: it completely depends on your personal risk tolerance and your trading strategy.
A long-term investor might be perfectly fine with a 20% drawdown on a position, especially if they plan on holding it for years. A day trader, on the other hand, lives and dies by tiny price moves. They might have a non-negotiable stop-loss at just 1-2% to protect their capital from getting wiped out by sharp, fast swings.
There is no universal "good" or "bad" loss percentage. The right number is the one that lines up with your financial goals and, just as importantly, lets you trade without getting emotional.
Should I Include Fees in My Calculation?
Absolutely, yes. If you want a truly accurate picture of your performance, your cost basis has to include all transaction fees and commissions.
It's easy to dismiss them as insignificant, but trust me, over dozens or hundreds of trades, those small amounts add up. Ignoring them will give you a misleading and overly optimistic view of your actual profitability. When it comes to your numbers, accuracy is everything.
Does the Formula Change for Short Selling?
It sure does—the whole concept gets flipped on its head. When you short-sell, you're betting on the price going down. A loss happens when the price rises above the point where you entered.
To calculate your loss percentage on a short position, you just invert the logic:
- Formula: ((Current Price – Short-Sale Price) / Short-Sale Price) * 100
Let's say you shorted a stock at $50 and were forced to buy it back (to close your position) at $55. The price went against you. Your loss in that scenario would be 10%. Same core principle, just applied to a bearish trade.
At Colibri Trader, we teach you how to master these essential concepts and build a trading strategy that fits your personal style and goals. Learn to manage risk and trade with confidence by exploring our action-based programs at https://www.colibritrader.com.