


A Trader’s Guide to Heikin Ashi Candles for Price Action
Have you ever been shaken out of a perfectly good trade by a sudden, jarring price spike? You watch in frustration as the market immediately snaps back, continuing in the direction you predicted, but leaving you behind. This is the kind of market "noise" that can drive traders crazy.
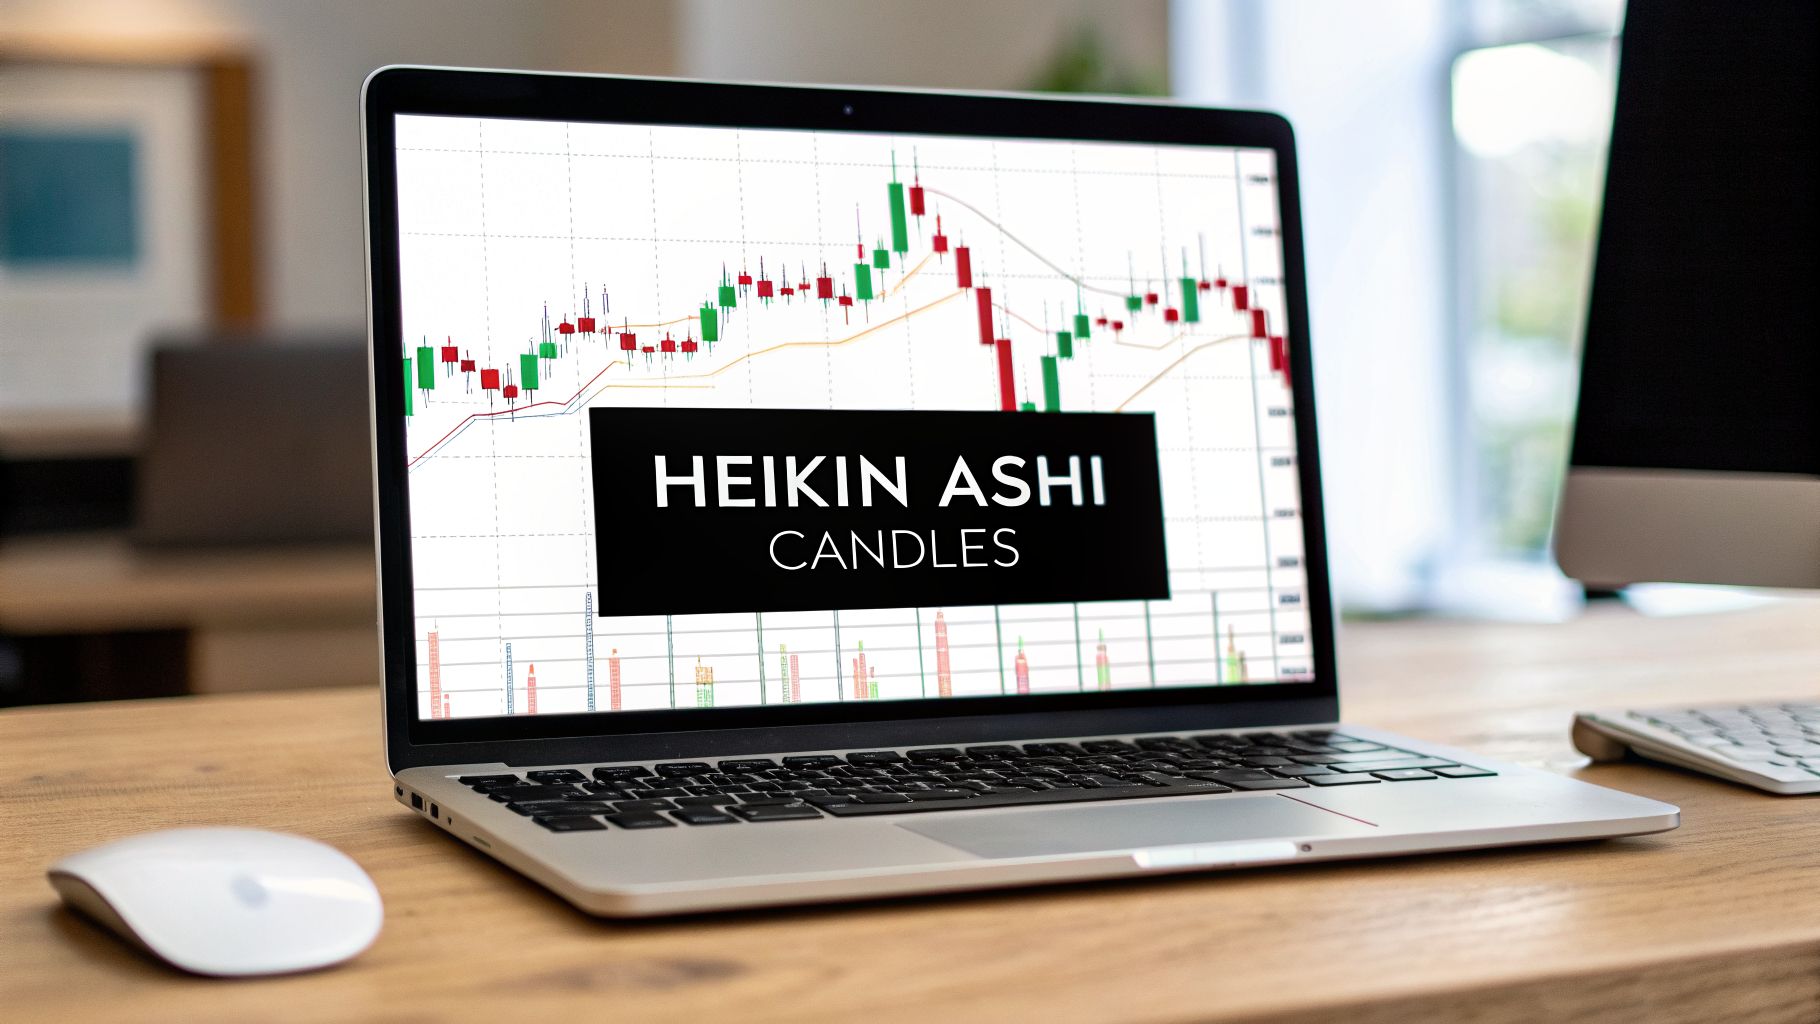
This is exactly why some traders, myself included, turn to Heikin Ashi candles.
Seeing Trends Clearly With Heikin Ashi
Standard candlestick charts are great, but they show you everything—every little wiggle, every momentary panic, every minor pullback. It can feel like trying to have a conversation in a loud, crowded room.
Heikin Ashi candles, on the other hand, are like putting on a pair of noise-canceling headphones. They smooth out the price action, making the underlying trend much easier to see.
The Power of Averaging Price
The name "Heikin Ashi" literally translates from Japanese to "average bar." That’s precisely what it does. Instead of plotting the raw open, high, low, and close for a period, each Heikin Ashi candle is calculated using a formula that averages price data from the current and prior candles.
This simple act of averaging creates a chart with some massive advantages for the price action trader:
- Incredible Trend Clarity: You'll see long, unbroken strings of green (bullish) or red (bearish) candles. This makes spotting and following a trend almost effortless.
- Drastically Reduced Noise: Those insignificant price spikes and minor pullbacks that cause so much doubt? They get filtered out, helping you avoid getting stopped out prematurely.
- Better Trading Discipline: The clean visuals make it psychologically easier to stay in your winning trades longer and not get spooked by false signals.
This isn’t some new, unproven gimmick. The concept dates back to the 1700s and Munehisa Homma, the same trading legend who gave us the original candlestick charts. It was a secret weapon for Japanese traders for centuries, but modern trading platforms have finally made it accessible to all of us. Its 300-year staying power comes down to a simple mathematical smoothing of price that cuts through the chaos.
By showing a much cleaner picture of momentum, Heikin Ashi candles let you focus on what really matters—the strength and direction of the trend. It's a game-changer, especially for anyone trying to master the art of trading with the trend.
Let me be clear: Heikin Ashi isn't a replacement for sound price action analysis. Instead, think of it as a powerful confirmation tool that helps you see the true market sentiment without all the distracting noise.
How Heikin Ashi Candles Are Calculated
Before you put your trust (and your capital) behind any trading tool, you need to know exactly what’s going on under the hood. Heikin Ashi candles aren't some kind of market magic—they're the result of four straightforward mathematical formulas. This process is what turns a messy, standard candlestick chart into the clean, trend-focused view we’re after.
Think of it this way: each Heikin Ashi candle isn’t an island. It actually carries a piece of the previous candle’s information forward. This is the secret sauce to its smoothing effect, filtering out the market noise to show you what momentum is really doing.
This image below breaks it down perfectly. It shows how raw, chaotic price action is filtered down to reveal a much clearer underlying trend.

As you can see, the process takes that jumble of price data and lines it up neatly, making the trend pop right off the chart.
The Four Core Formulas
Don’t worry, you won’t be doing this math by hand. Your trading platform handles it all in a split second. But understanding the logic is what builds real confidence in the signals you see.
Every single Heikin Ashi candle is built from these four components:
The Heikin Ashi Close (HA-Close): This is just the average price of the current bar. The formula is
(Open + High + Low + Close) / 4. It takes the entire session's range and finds the midpoint.The Heikin Ashi Open (HA-Open): This is the key to the whole smoothing effect. The formula is
(Previous HA-Open + Previous HA-Close) / 2. Notice how it completely ignores the current bar's real open? Instead, it starts the new candle from the midpoint of the previous candle’s body. This is what connects the candles together and gets rid of gaps.The Heikin Ashi High (HA-High): This is simply the highest value reached between the current bar's high, its HA-Open, or its HA-Close. This ensures the upper wick always shows the true peak of buying pressure.
The Heikin Ashi Low (HA-Low): Likewise, this is the lowest value between the current bar's low, its HA-Open, or its HA-Close. This makes sure the lower wick properly reflects the session's absolute low.
The crucial takeaway is that the open of every new Heikin Ashi candle is directly tied to the body of the one before it. This mathematical link is what forces the chart to smooth out and show a clearer trend.
Heikin Ashi vs. Standard Candlestick Construction
So, what’s the real difference here? It all comes down to the data. A standard candle plots raw, unfiltered price points, which can look erratic. A Heikin Ashi candle plots averaged values, which tells a much more cohesive story.
If you need a refresher on conventional charts, feel free to check out our complete guide on understanding candlestick charts.
This table puts the construction of each candle type side-by-side.
| Data Point | Standard Candlestick | Heikin Ashi Candlestick Formula |
|---|---|---|
| Open | The first traded price of the period. | (Previous HA-Open + Previous HA-Close) / 2 |
| Close | The last traded price of the period. | (Open + High + Low + Close) / 4 |
| High | The highest traded price of the period. | Maximum of (High, HA-Open, HA-Close) |
| Low | The lowest traded price of the period. | Minimum of (Low, HA-Open, HA-Close) |
By seeing this rules-based process, you can understand that Heikin Ashi isn't just a prettier picture; it's an objective method for reading market momentum. This knowledge takes the mystery out of why the charts look so different and gives you a solid foundation for your trading.
Once you know how the Heikin Ashi candles are made, learning to read them is the next logical step. It’s actually quite intuitive. Each candle gives you a clue about the market's momentum, and together, they tell a much clearer story than standard candlesticks.
Think of it as a simplified language for traders. Instead of wrestling with noisy, complex signals, Heikin Ashi gives you a few core "words" to look for. By mastering these visual cues, you can read trend strength, spot when a move is running out of gas, and even anticipate reversals with a lot more confidence.

Identifying a Strong Bullish Trend
The biggest advantage of Heikin Ashi is how clearly it shows you a strong, established trend. When you see a powerful uptrend taking shape, the pattern is so distinct it’s almost impossible to miss.
A healthy bull run shows up as a series of solid green candles with little to no lower wicks.
The key detail here is the missing lower wick. This tells you that for the entire session, the average price never once dropped below its average open. Buyers were in the driver's seat the whole time, pushing the price higher and higher. This is the unmistakable sign of powerful upward momentum.
Spotting a Dominant Bearish Trend
Just as it clarifies uptrends, Heikin Ashi makes a dominant downtrend brutally obvious. This clarity is exactly what you need to avoid the common mistake of trying to "catch a falling knife" during an aggressive sell-off.
A strong bearish trend is simply a string of solid red candles with little to no upper wicks.
Like the bullish signal, it's the lack of an upper wick that tells the whole story. It means sellers were so powerful that the price couldn't even rally above its average opening price. This is a crystal-clear visual that selling pressure is in control, and the path of least resistance is down.
Trader's Tip: In my experience, the wicks on Heikin Ashi candles are your best guide to momentum. No lower wick in an uptrend means buyers are in total control. No upper wick in a downtrend means sellers are dominating. It’s that simple.
Research backs up what experienced traders already know. Studies have shown Heikin Ashi is incredibly good at keeping you in a trending move. It's not unusual to see 15-20 consecutive green candles in a strong uptrend, smoothing over minor dips that would have looked like reversals on a normal chart. This helps traders sidestep the 30-40% of false reversal signals that can plague traditional candlestick analysis, a topic explored in more depth in various trend analysis studies.
Recognizing Trend Weakness and Indecision
Of course, no trend goes on forever. Heikin Ashi gives you an excellent early warning when a trend starts to lose its power or the market gets choppy and uncertain.
You can spot a weakening trend when the candle bodies start getting smaller and wicks appear on both sides of the candles. Smaller bodies mean the distance between the open and close is shrinking—a sign of less directional force. When you see both upper and lower wicks, you're witnessing a tug-of-war between buyers and sellers.
This often happens right before a major reversal, giving you a heads-up to tighten your stop-loss or think about taking some profit off the table.
Pinpointing Potential Trend Reversals
The most powerful reversal signal you can get from a Heikin Ashi chart is often a small-bodied candle with long wicks on both ends, which might look like a Doji. I call this an indecision candle because it shows that momentum has ground to a complete halt.
- After a solid uptrend, an indecision candle followed by a red candle can signal a top is forming and momentum is shifting to the bears.
- After a steep downtrend, an indecision candle followed by a green candle can point to a potential bottom and a shift to bullish control.
These reversal patterns become incredibly powerful when they show up at a key supply or demand zone you've already marked on your chart. When you combine the momentum story from Heikin Ashi with pure price action, you build a much more robust framework for making high-probability trades.
Integrating Heikin Ashi into Your Price Action Strategy
Alright, you understand the what and how of Heikin Ashi. Now for the important part: actually using them to make better trades. The real magic happens when you blend these smoothed-out candles with a pure, no-indicator price action approach.
Let me be clear: Heikin Ashi candles are not a replacement for solid supply and demand analysis. They are a confirmation tool, and a powerful one at that. First, you identify your key levels. Only then do you glance at the Heikin Ashi chart for that final go-ahead.

High-Probability Entry Setups
Let’s say you’ve marked a strong demand zone on your chart, and price is heading straight for it. On a normal candlestick chart, the action inside that zone can look like pure chaos, making you second-guess your analysis. This is where Heikin Ashi cleans things up beautifully.
You just have to be patient. Wait for price to push into your demand zone. Then, watch for the first hint of a momentum change. You’re looking for the bearish red candles to fizzle out, maybe see an indecisive doji-like candle, and then—BAM—the formation of a strong bullish Heikin Ashi candle. That’s one with a full body and no lower wick.
That specific sequence is the entry trigger I look for.
- Price Action: Price has tagged a pre-identified demand zone.
- Heikin Ashi Confirmation: A strong green candle with no lower wick appears, telling you the buyers have just taken the driver's seat.
This combo validates your entire trade idea. You’re not just blindly buying at a level; you're entering precisely when momentum is visibly shifting in your favour. It's a fantastic filter for weeding out those weak bounces where price just pokes a level and then continues on its way.
Heikin Ashi doesn't tell you where to trade; your supply and demand analysis does. Heikin Ashi tells you when the momentum is right to pull the trigger.
If you need to sharpen your skills on that first part, I highly recommend digging deeper into how to trade using pure price action.
Smart Trade Management and Exits
Bringing Heikin Ashi into your trading isn't just about finding cleaner entries. It’s also a game-changer for managing your trades and getting out with discipline. Because they smooth out the noise, these candles can help you hold onto a winning trade through minor pullbacks that would have spooked you on a standard chart.
Now, as your trade moves nicely into profit and approaches a supply zone you’ve already marked, the Heikin Ashi candles give you clear cues on when to cash out. The very signals that showed you a trend was starting can also show you when it’s running out of steam.
As price gets near your target, keep an eye out for these signs:
- Shrinking Candle Bodies: Those big, powerful green bodies start to get smaller. That’s a sign that the bullish momentum is drying up.
- Appearance of Lower Wicks: You start seeing lower wicks pop up on the green candles. This shows that sellers are beginning to fight back.
- Formation of Indecision Candles: Small-bodied candles with wicks on both ends appear, signalling that buyers and sellers are reaching a stalemate—a classic sign of a potential top.
When you see this sequence playing out inside your supply zone, it’s a non-emotional signal to take your profits. You’re not trying to perfectly time the top; you’re simply getting out as the trend gives its first clear signs of exhaustion. It’s a systematic way to lock in the bulk of a move without giving too much back to the market.
Understanding the Pros and Cons for Traders
While Heikin Ashi candles are a fantastic tool for seeing market trends more clearly, it's critical to understand they aren't a "holy grail." No tool in trading is.
Like anything in our trading arsenal, they come with their own unique strengths and weaknesses. Knowing both sides of the coin is the key to using them effectively in your trading plan and, more importantly, avoiding some common traps.
This balanced view helps you use them for what they do best—confirming momentum—without getting caught off guard by their built-in limitations. Let’s break down what you need to know.
The Advantages of Heikin Ashi
The main reason so many traders are drawn to Heikin Ashi is its incredible ability to filter out market noise. This gives you a few powerful advantages that can have a direct, positive impact on your trading psychology and your bottom line.
Superior Trend Clarity: By averaging out the price action, these candles create smooth, flowing strings of color. This makes it almost effortless to see the direction and strength of a trend with a single glance, taking a lot of the guesswork out of the equation.
Reduced Emotional Decisions: The smoothed charts keep you from overreacting to small, meaningless price blips. This helps you stay calm and disciplined, which in turn allows you to hold onto your winning trades longer instead of panic-selling on a minor pullback.
Fewer False Signals: Standard candlesticks can flash a lot of conflicting signals even inside a strong, established trend, tempting traders to jump in or out prematurely. Heikin Ashi's formula needs a much more significant price move to change the candle's color, which drastically cuts down on these expensive false alarms.
The Disadvantages of Heikin Ashi
For all their benefits, the very averaging formula that makes Heikin Ashi so clean also creates some specific drawbacks. You absolutely have to be aware of these to manage your risk properly.
The biggest disadvantage by far is the lag. Because each candle’s open is calculated using the previous candle, the chart will always be just a little bit behind the live, real-time price. This can cause a couple of problems:
- Delayed Entry Signals: You might get into a trade a bit later than you would with standard candles, potentially missing the very first part of a move.
- Delayed Exit Signals: This is the more critical one. The lag can make you exit a trade late, forcing you to give back some of your hard-earned profits as the market starts to turn against you.
Another major issue is that Heikin Ashi obscures the true price. The open, high, low, and close you see on a Heikin Ashi candle do not reflect the actual prices that were traded during that period. This makes it impossible to see real price gaps or to set precise stop-loss orders based on the candle's wicks.
The trade-off is clear: you sacrifice immediate price sensitivity for enhanced trend clarity. For a price action trader, this means you should never use Heikin Ashi alone. It must be paired with standard charts to see true price levels.
Comprehensive backtesting of Heikin Ashi strategies really highlights this trade-off. One detailed study tracking trades all the way back to 1960 found that a Heikin Ashi strategy produced a 5.2% annual return with an impressive average gain of 4.7% per trade. What’s most telling is that its maximum drawdown was only 29% compared to a simple buy-and-hold strategy's drawdown of 52.56%, showing it did a much better job of preserving capital. You can dig into more of the numbers behind these Heikin-Ashi trading strategy findings.
Frequently Asked Questions About Heikin Ashi
As you start to get the hang of Heikin Ashi, you're bound to have some questions. It’s a unique way to look at price, and like any tool in a trader's arsenal, you need to know its specific rules and limitations.
Here are the answers to some of the most common questions I get from traders just starting out with Heikin Ashi.
Can I Use Heikin Ashi for Day Trading
Absolutely, you can use Heikin Ashi candles for day trading on lower timeframes, but you have to know what you're getting into.
The smoothing effect is fantastic for cutting through the intraday noise that drives so many scalpers and day traders crazy. The flip side is that the lag, which is built into the candle's calculation, becomes much more obvious on a 5-minute or 1-minute chart.
This lag means your entries and exits will be slightly behind the live price. That’s why I find Heikin Ashi is best used by day traders to confirm momentum once price has already reached a key level you've identified—like a fresh supply or demand zone. Don't rely on it as your primary signal generator.
Do Heikin Ashi Candles Show the Actual Market Price
No, and this is probably the single most important thing you need to burn into your brain. The price on a Heikin Ashi chart is an averaged value. It is NOT the real open, high, low, or close for that period.
The whole point of the formula is to smooth out the chart, not to show you the raw, chaotic price data. This is exactly why many pure price action traders (myself included) use a two-chart setup. One chart runs standard candlesticks so I can see the real price, mark my supply and demand zones with precision, and place my stops exactly where they need to be. The second chart, with Heikin Ashi, is purely for judging trend strength and momentum.
Should I Use Other Indicators with Heikin Ashi
You can, but I find it usually defeats the entire purpose. The main reason to use Heikin Ashi is to simplify your charts and get rid of the clutter.
Heikin Ashi already works as a momentum and trend filter. Adding lagging indicators like RSI or MACD on top is just redundant—they're all trying to measure the same thing.
A clean price action approach, like the one we focus on, is about stripping things down to the essentials of supply and demand. By using Heikin Ashi as a final, simple confirmation tool, you keep your analysis clean, focused, and powerful. To get a broader market view without adding chart clutter, many traders listen to quality finance podcasts to stay informed.
At Colibri Trader, we teach you how to master a pure, price-action based approach to dominate the markets. Learn more about our proven, no-nonsense strategies by visiting https://www.colibritrader.com.