


Master the Head and Shoulders Pattern for Profitable Trading
Decoding the Head and Shoulders Pattern Framework

The head and shoulders pattern is a powerful tool used in technical analysis. It often signals a potential trend reversal. But how can we understand this pattern, and what can it tell us about future price movements? This section breaks down the head and shoulders pattern, exploring its key elements and the market psychology behind it.
Key Components of the Pattern
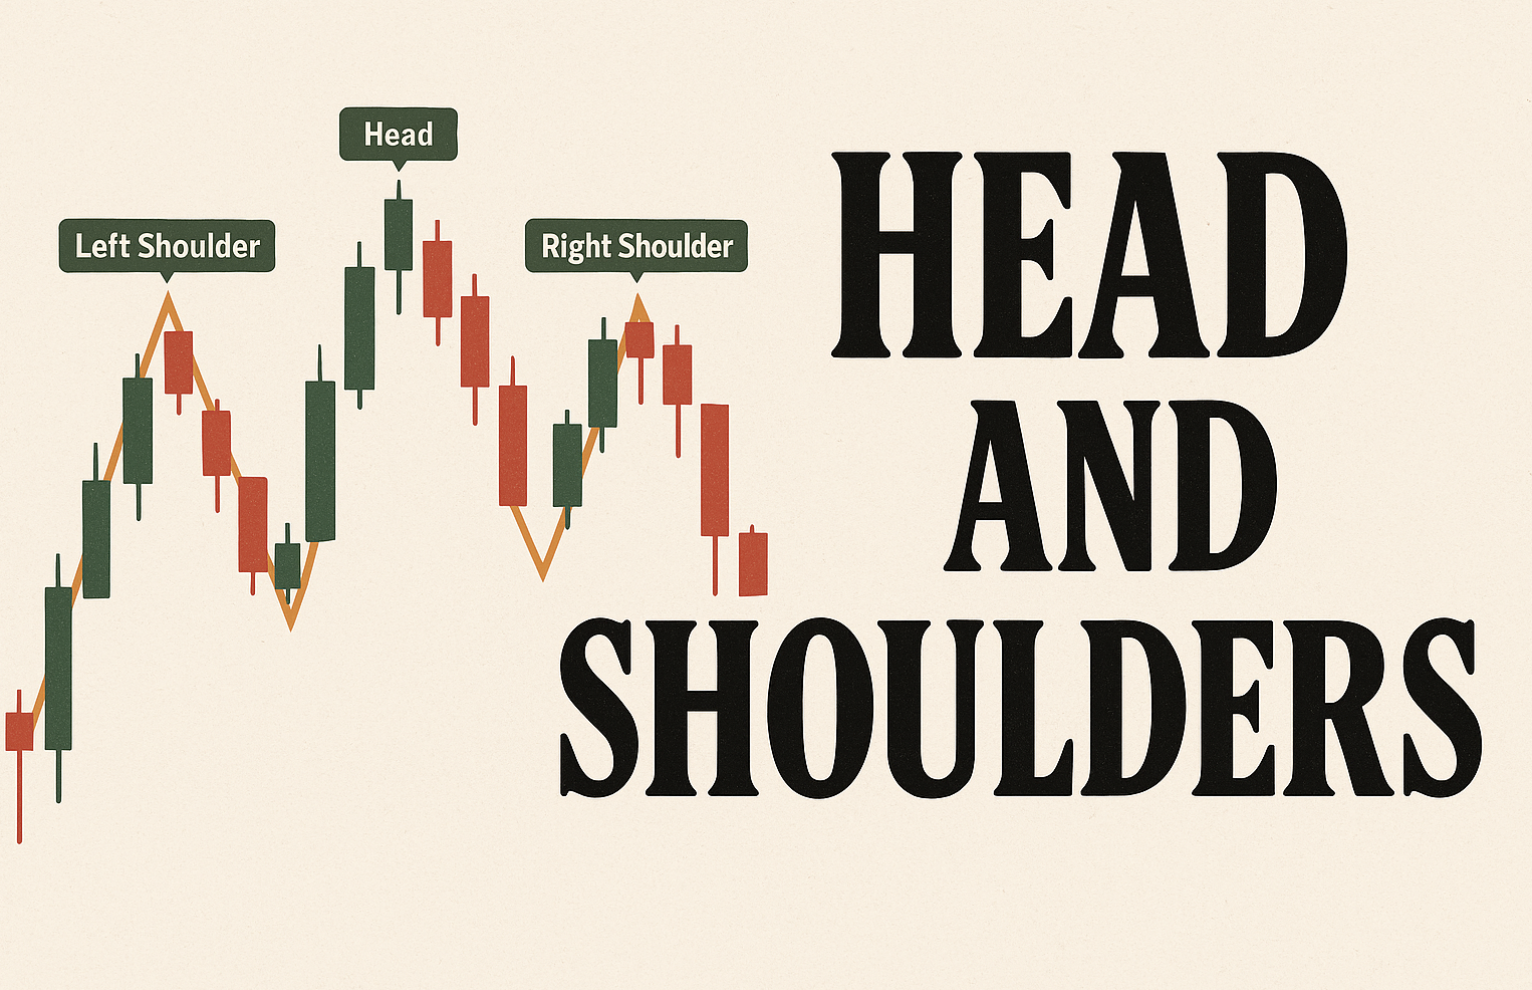
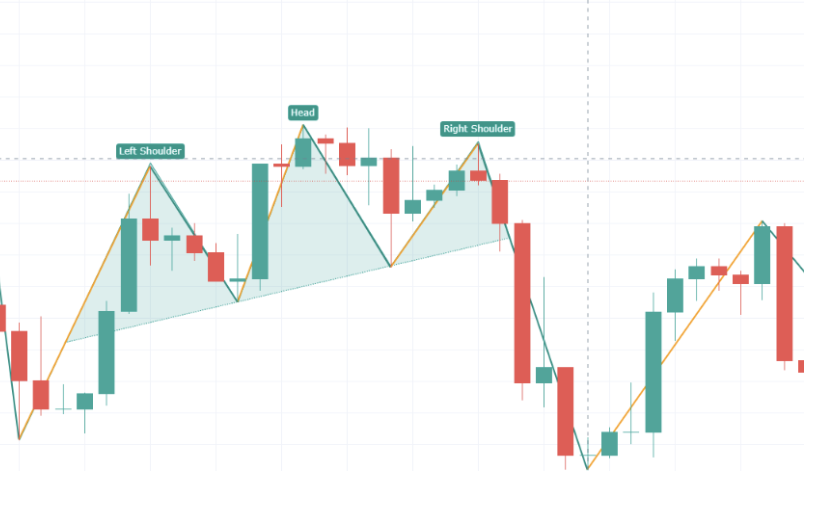
The head and shoulders pattern is visually distinct, resembling its name. It’s made up of four key elements: the left shoulder, the head, the right shoulder, and the neckline. The left shoulder forms when a peak in price is followed by a decline.
The price then climbs to a higher peak, creating the head, before falling again. A final price increase creates the right shoulder, usually around the same height as the left shoulder. Following this, the price typically declines once more.
The Significance of the Neckline
The neckline is formed by connecting the low points between the two shoulders and the head. This line plays a vital role in verifying the pattern and anticipating future price action. Breaking below this neckline often confirms a bearish head and shoulders pattern, indicating a potential downtrend.
Increased trading volume frequently accompanies this break, strengthening the signal’s validity. The head and shoulders pattern has a history of reliable trend reversal indication. It often marks the end of an upward trend and the start of a downward one. Learn more about trend reversals: Identifying Head and Shoulders Patterns in Stock Charts.
Market Psychology Behind the Formation
The head and shoulders pattern reflects changing market sentiment. The initial price rise forming the left shoulder shows bullish enthusiasm. However, the inability to break past the head’s high indicates weakening buying pressure.
The right shoulder formation, often with declining volume, suggests a further weakening of bullish momentum. This gradual shift from bullish to bearish sentiment is crucial to understanding the pattern. For example, a failed attempt to reach previous highs often points to declining buyer confidence, playing a role in the right shoulder’s creation.
Understanding the head and shoulders pattern offers valuable insights into potential market reversals. Recognizing these formations and using them within a broader trading strategy can give traders an advantage in navigating the financial markets. This understanding is essential for effectively spotting and trading these patterns, which we’ll discuss in the following sections.
Spotting Genuine Head and Shoulders Patterns Like a Pro
Identifying a head and shoulders pattern is one thing, but confirming its validity is quite another. Many traders struggle to differentiate true head and shoulders patterns from typical market fluctuations. This is where a systematic approach is crucial. We’ll explore a process used by professional traders to validate these patterns, boosting your trading confidence.
The Head and Shoulders Confirmation Process
This process, visualized in the process flow below, outlines the steps to confirm a genuine head and shoulder pattern.
-
Step 1: Identify Potential Pattern: The first step is spotting a potential head and shoulders formation. Look for the left shoulder, head, and right shoulder peaks, along with the emerging neckline.
-
Step 2: Neckline Validation: Confirm the neckline is well-defined. It might be horizontal or slightly angled, but a clear neckline is critical for pattern validation.
-
Step 3: Volume Confirmation: Volume is essential. Ideally, volume decreases as the pattern develops, particularly during the right shoulder, suggesting weakening buying pressure.
-
Step 4: Breakout Confirmation: True confirmation occurs with a decisive break below the neckline. This breakout should ideally be accompanied by increased volume, showing conviction.
-
Step 5: Retest and Confirmation: After breaking out, the price may retest the neckline, acting as additional confirmation before the downward trend continues.
The order of these steps is essential. Identifying the pattern before checking volume and breakout confirmation is counterproductive. Each step builds upon the previous, leading to a high-probability setup. The following process flow details the steps needed to successfully validate a Head and Shoulders pattern.
As the process flow illustrates, confirming the pattern relies on decreasing volume and a break below the neckline before a retest and continuation of the trend.
A statistical analysis of head and shoulder patterns reveals their prevalence in volatile markets. For example, during the mid-2000s, several head and shoulder formations occurred in the S&P 500, resulting in significant trend reversals. Explore this topic further: Find more detailed statistics here.
Importance of Proportional Relationships and Volume
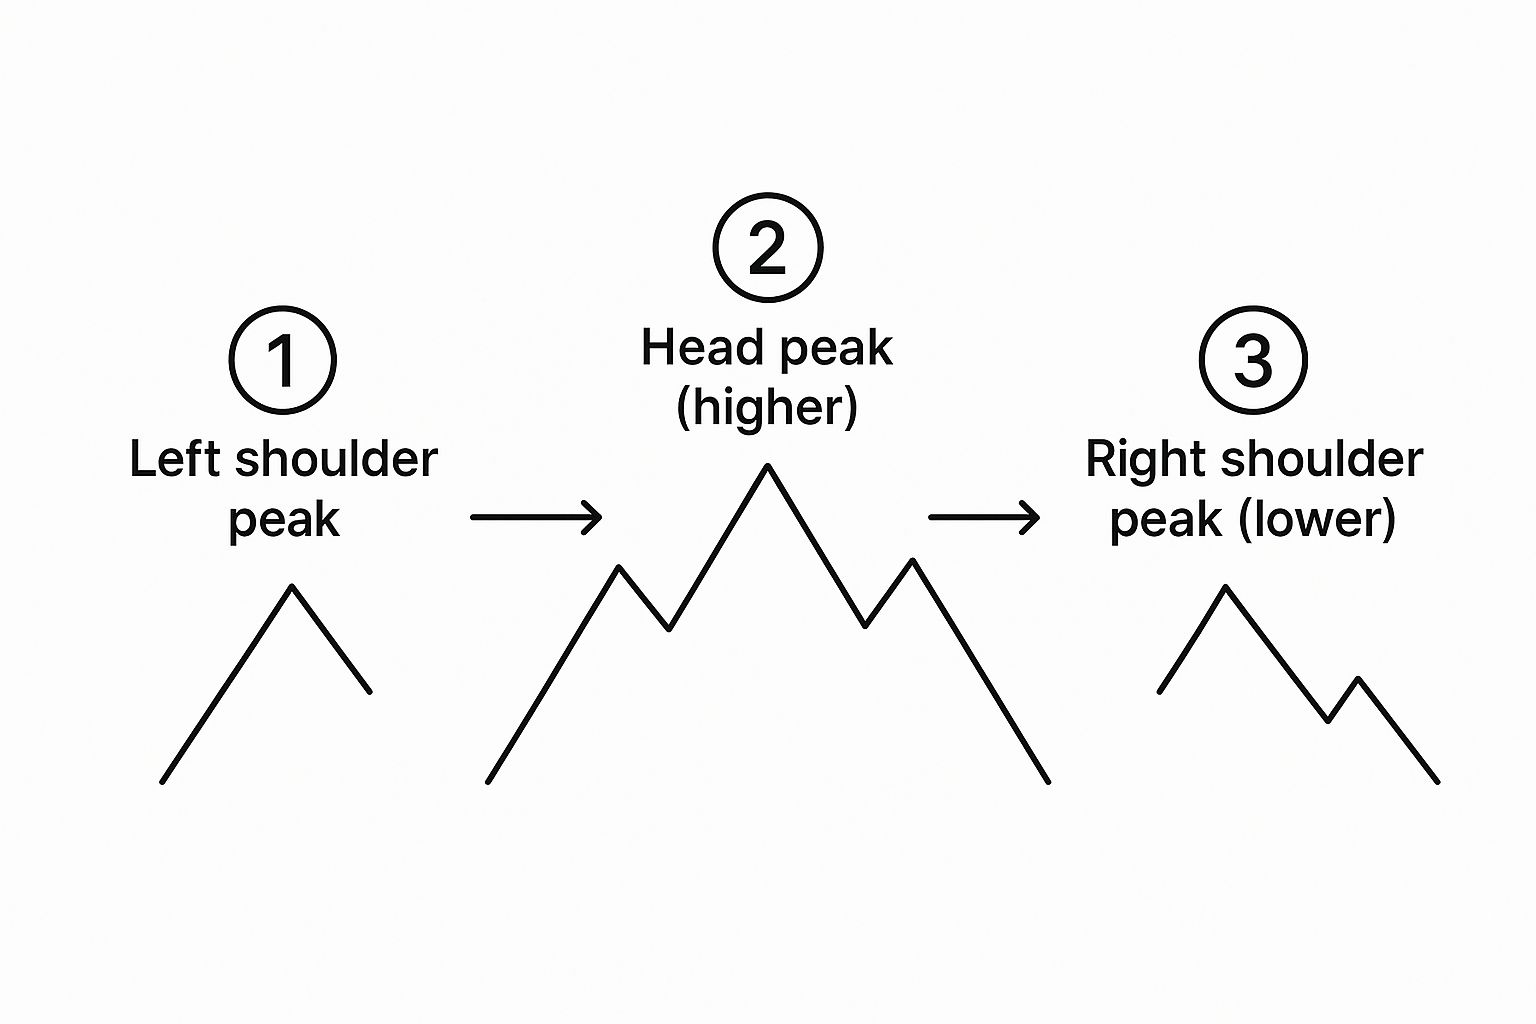
Beyond the basic steps, seasoned traders also consider the pattern’s proportions. The left and right shoulders should have roughly equal height, although small differences can occur. The head should be distinctly higher than both shoulders.
Volume confirmation remains vital. Declining volume during the right shoulder, followed by a surge during the neckline breakout, strengthens the pattern’s reliability. This price-volume divergence signals weakening momentum and confirms the potential reversal. This facilitates better risk management during trades.
To help summarize the key factors in pattern identification, we have provided a checklist:
Before getting into a trade it is important to know if a pattern is valid. The following table summarizes the key differences between valid and false Head and Shoulders patterns.
Head and Shoulders Pattern Identification Checklist
| Characteristic | Valid Pattern | False Pattern | Importance Level |
|---|---|---|---|
| Left Shoulder Formation | Clear peak and trough | Rounded or undefined peak | High |
| Head Formation | Distinctly higher peak than left shoulder | Similar height to left shoulder | High |
| Right Shoulder Formation | Peak roughly equal to the left shoulder | Significantly higher or lower than left shoulder | High |
| Neckline | Clearly defined, horizontal or slightly sloping | Undulating or broken neckline | High |
| Volume during Head and Right Shoulder | Decreasing | Increasing or erratic | High |
| Volume during Neckline Breakout | Significantly increasing | Low or decreasing | High |
| Price Action After Breakout | Strong downward move | Weak move or quick reversal | High |
This checklist provides a summary of characteristics that professional traders utilize to identify valid and false patterns.
By carefully following these steps and appreciating these subtleties, you can identify genuine head and shoulders patterns and avoid costly fake signals. This sets the stage for implementing profitable trading tactics.
Battle-Tested Trading Tactics for Maximum Profitability
Identifying a head and shoulder pattern is just the first step. The real key to unlocking profits lies in understanding how to trade it. This section unveils the tactics successful traders employ to capitalize on these patterns. We’ll delve into entry techniques, stop-loss placement, and profit targets, exploring how to adapt these strategies to different market conditions.
Aggressive Vs. Conservative Entry Techniques
Two primary entry methods exist: aggressive and conservative. Aggressive traders enter a short position as soon as the price dips below the neckline. This approach offers the potential to maximize profit but comes with increased risk. A false breakout, for instance, could quickly lead to losses if the price reverses.
Conservative traders prefer to wait for a retest of the neckline following the breakout. This confirmation minimizes the risk of false signals, but it could also mean forfeiting some initial downward movement. This method prioritizes mitigating risk over immediate gains. The best entry method for you will depend on your personal risk tolerance and trading style.
Stop-Loss Placement Strategies for Risk Management
Stop-loss orders are crucial for effective risk management. In a head and shoulder pattern, a common practice is to place the stop-loss just above the right shoulder peak. This placement provides a balance between protection and realistic market volatility. It minimizes potential losses while accommodating normal price fluctuations. A stop-loss placed too tightly might be triggered by standard market activity, while a stop-loss that is too wide can expose traders to significant losses.
Multiple Profit-Target Methods: Measuring Potential Gains
Determining profit targets can be approached in a number of ways. One common method involves measuring the distance between the head and the neckline. This distance is then projected downwards from the neckline breakout point. This “measured move” establishes an initial target.
However, many seasoned traders combine this with other technical analysis tools. Support and resistance levels or Fibonacci retracements can help pinpoint more precise targets. Observing price action and volume during the breakout can also provide valuable insights into the move’s strength, allowing for target adjustments. Consider exploring resources like the Supply & Demand course from Colibri Trader to enhance your understanding of these concepts.

Adapting to Different Market Conditions: Flexibility Is Key
While these tactics provide a solid foundation, adapting to diverse market environments is paramount. During periods of high volatility, wider stop-loss orders may be necessary to avoid getting stopped out prematurely. Conversely, tighter stops can maximize profits in calmer markets. Analyzing both winning and losing trades is essential for understanding the impact of these adjustments. Professional traders continuously refine their strategies based on market feedback and maintain stringent risk management, regardless of market conditions. Through disciplined analysis and adaptation, you can effectively use the head and shoulder pattern for consistent profitability.
Volume Analysis: The Pattern Confirmation Secret
Volume adds essential context to price movements, serving as a robust confirmation tool for head and shoulder patterns. This section dives into how volume validates these patterns, differentiating true setups from potentially misleading signals. Understanding this is what separates consistently profitable traders from the rest.
The Ideal Volume Signature
As a head and shoulders pattern forms, volume reveals crucial clues. Ideally, volume gradually decreases during the pattern’s development, especially as the right shoulder emerges. This decline suggests diminishing buying pressure, hinting at a possible reversal. For instance, a left shoulder forming on high volume followed by weaker volume on subsequent peaks indicates weakening momentum.
Furthermore, a significant volume surge typically accompanies the neckline breakout. This increased volume reinforces the price movement’s conviction and increases the likelihood of a sustained downtrend. This surge often signals institutional investors joining the selling pressure, amplifying the downward movement.
Identifying Volume Confirmations and Divergences
Careful volume observation helps traders identify volume confirmations that strengthen pattern reliability. Diminishing volume during right shoulder formation, followed by a surge during the breakout, provides powerful confirmation. This alignment of price and volume offers a high-probability trading setup. The combination points towards increased selling pressure, validating the bearish trend.
In contrast, volume divergences can signal potential pattern failures. A right shoulder forming on higher volume than the head, for example, might indicate continued buying interest, negating the bearish signal. Recognizing such divergences helps traders sidestep losing trades and protect their capital. These divergences serve as early warnings of a weakening pattern.
Volume Indicators and Multi-Timeframe Analysis
Experienced traders often employ volume indicators to confirm head and shoulders patterns. Indicators such as the On-Balance Volume (OBV) and Chaikin Money Flow (CMF) offer insights into underlying money flow, supporting volume patterns. These indicators help traders pinpoint accumulation and distribution phases, strengthening pattern validity. The Supply & Demand Course from Colibri Trader offers detailed guidance on using these tools.
Moreover, integrating volume analysis with multi-timeframe analysis provides an additional layer of confirmation. Examining volume patterns across various timeframes provides a broader market perspective. For example, a head and shoulders pattern on a daily chart, supported by similar volume behavior on the weekly chart, significantly boosts the pattern’s reliability. This wider view reinforces the bearish signal and suggests a substantial price move.
By grasping the interplay between volume and price, traders can identify high-probability head and shoulders patterns. Using this understanding alongside other technical tools provides a significant advantage in anticipating market reversals. This knowledge allows for more informed trading decisions and potentially improved profitability, minimizing costly errors, a topic we’ll explore further.
Avoiding The Costly Mistakes That Derail Pattern Traders

Even with a solid grasp of the head and shoulders pattern, many traders stumble into common traps. This section explores these pitfalls, offering practical advice to sidestep them and boost your trading performance. Learning from these mistakes can dramatically improve your results.
The Danger Of Premature Entries
One of the most frequent errors is entering a trade before the head and shoulders pattern fully forms. Jumping the gun before a confirmed neckline break can lead to significant losses if the expected reversal doesn’t occur.
For instance, a premature short entry could backfire if the price unexpectedly surges. Patience is paramount. Waiting for confirmation reduces the risk of false signals. This disciplined approach safeguards your capital and enhances the likelihood of successful trades.
Improper Stop Placement: A Silent Account Killer
Incorrect stop-loss placement can sabotage even the most promising head and shoulders setups. Stops placed too tightly often result in premature exits due to normal price fluctuations. On the other hand, stops set too wide can expose you to excessive losses if the pattern fails.
Finding the sweet spot is vital. A well-placed stop-loss, typically just above the right shoulder’s peak, optimizes the balance between risk and reward. This placement accommodates normal price volatility while limiting potential downside. Mastering proper stop placement is fundamental for long-term trading success.
Ignoring The Broader Market Context
Another common mistake is fixating solely on the head and shoulders pattern while disregarding the broader market environment. A seemingly perfect pattern can fizzle out if the overall market trend strongly opposes it. For example, a bearish head and shoulders pattern on a stock might not materialize if the broader market index is rallying.
Analyzing the bigger picture, using tools like the Colibri Trader’s Supply & Demand course, helps you gauge the pattern’s true potential. This broader perspective empowers you to avoid trades that contradict prevailing market forces and make more informed decisions.
Psychological Challenges: Conquering The Inner Game
Trading psychology plays a pivotal role in head and shoulders trading. Confirmation bias, the tendency to favor information that validates pre-existing beliefs, can lead traders to overlook warning signs. It often results in entering trades based on incomplete patterns.
Similarly, revenge trading, driven by the urge to recoup losses from missed opportunities, often causes impulsive and irrational decisions. Maintaining discipline and objectivity is essential for overcoming these psychological obstacles.
Developing a robust trading plan and sticking to it, regardless of emotional impulses, helps mitigate these risks. Recognizing and managing psychological biases significantly improves trading performance. This involves understanding your emotional responses to market events and developing strategies to manage them. Ultimately, this leads to more consistent and profitable trading.
To illustrate the practical application of the head and shoulders pattern, let’s look at the success rates across different market types. The following table provides a statistical overview:
Head and Shoulders Pattern Success Rates by Market Type
| Market Type | Pattern Success Rate | Average Price Movement | Typical Duration |
|---|---|---|---|
| Forex | 65% | 50-100 pips | 1-4 weeks |
| Stocks | 70% | 5-10% | 1-3 months |
| Commodities | 60% | 2-5% | 2-6 weeks |
This table showcases the pattern’s effectiveness across various markets. While the success rates and typical durations vary, the head and shoulders pattern offers valuable insights for traders in diverse markets. Understanding these nuances is crucial for applying the pattern effectively and maximizing your trading potential.
Creating a Complete Trading System Around the Pattern
The head and shoulders pattern, while a strong indicator on its own, becomes significantly more effective when part of a complete trading system. This involves combining it with other technical analysis tools to validate signals and improve profitability. Let’s explore building such a system, focusing on momentum indicators, moving averages, volume indicators, and multi-timeframe analysis.
Momentum Indicators: Early Warning Signs
Momentum indicators, such as the Relative Strength Index (RSI) and the Stochastic Oscillator, can offer early warnings of a potential head and shoulders pattern. These indicators track the speed and size of price movements, often revealing weakening momentum before the pattern fully forms. For instance, a bearish divergence, where the price hits a new high but the RSI doesn’t, could indicate the formation of a head. This early warning allows traders to begin watching for the pattern’s remaining components.
Moving Averages: Confirming Trend Changes
Certain moving average combinations can help confirm trend changes a head and shoulders pattern suggests. A break below a key moving average, like the 50-day or 200-day, can reinforce the bearish signal of a breakdown from the neckline. In an inverse head and shoulders pattern, a break above a key moving average can validate a bullish reversal. This combination of signals strengthens the trade setup and boosts the chances of a winning trade.
Volume Indicators: Revealing Institutional Activity
Volume indicators, like the On-Balance Volume (OBV) and Chaikin Money Flow (CMF), offer insights into the underlying money flow during pattern development. Decreasing volume during the right shoulder and a surge during the neckline breakout are vital confirmation signals. These indicators help to confirm those volume patterns by showing institutional activity. For example, a rising CMF during a developing inverse head and shoulders pattern suggests strong institutional buying, raising the chance of a bullish breakout.
Multi-Timeframe Analysis: Contextualizing the Pattern
Analyzing the head and shoulders pattern across various timeframes puts the formation into the right market context. A head and shoulders pattern on a daily chart, confirmed by similar patterns on weekly or monthly charts, considerably strengthens the signal. However, if a higher timeframe shows a conflicting pattern, it may be wise to reassess the trade. This multi-timeframe view filters false signals and pinpoints high-probability setups, ensuring the pattern aligns with the overall market trend.
Integrating the Tools for a Robust System
Building a complete trading system around the head and shoulders pattern requires integrating these tools effectively. This is not about using every indicator available, but selecting a few that work best for you and combining them with the pattern to confirm signals and manage risk. Through thorough chart study and practice, traders can refine their approach and create a methodology that uses the pattern’s strengths while minimizing its weaknesses. This leads to a robust trading system and improved trading outcomes.
Ready to enhance your trading with a price-action focused strategy? Explore Colibri Trader’s programs, including the Supply & Demand Course, designed to empower traders of all levels. Learn to understand market dynamics and reach your full trading potential.
