Excel Trading Journal Template: Boost Your Trading Strategy

Why Every Serious Trader Needs an Excel Trading Journal
Ever wonder why some traders consistently outperform the market while others struggle? The key often lies in meticulous record-keeping. Elite traders understand that turning random trades into strategic decisions requires careful documentation. This goes beyond simply tracking wins and losses; it’s about understanding the “why” behind each trade.
This approach helps traders identify profitable patterns that might otherwise go unnoticed. By meticulously logging every trade, successful traders gain valuable insights into their strengths and weaknesses, transforming their approach from guesswork into a data-driven process. This allows them to capitalize on opportunities and mitigate risks more effectively.
Psychological Benefits of a Trading Journal
Keeping a trading journal offers significant psychological benefits. It helps traders control emotional impulses by providing structure for decision-making. For instance, documenting the rationale behind each trade helps prevent impulsive decisions driven by fear or greed.
A journal also helps identify emotional patterns that affect trading performance. This self-awareness is key to developing discipline and emotional control, both essential for long-term success.
Overcoming Resistance to Documentation
Many traders resist journaling, seeing it as tedious or unnecessary. However, talking with professional traders reveals that consistent record-keeping forms the bedrock of data-driven decisions that compound over time. This structured approach shifts trading from isolated events into a continuous learning process. You might find this article helpful: How to master your trading journal.
Creating an Excel trading journal template is crucial, offering a structured framework for tracking and analyzing trades. A free trading journal spreadsheet might include columns for trade number, entry date, ticker symbol, quantity, entry and exit costs, profit/loss, and days in the trade.
Such detailed tracking lets traders review their performance and pinpoint areas for improvement. By analyzing this data, traders can refine strategies and boost their chances of success. For example, a trader might notice a pattern of losses on trades held longer than three days. They can then adjust their strategy to close positions sooner. This leads to better risk management and potentially higher profits.
Traders can backtest strategies using historical data from their journals to optimize future decisions. Maintaining a journal builds confidence in trading strategies and improves overall performance by providing a clear picture of past wins and losses. Incorporating robust data-driven decision making principles is essential for continued growth in your trading strategy.
Essential Components That Transform Trading Results
What separates a truly effective trading journal from a forgotten spreadsheet? The key is focusing on the essential components that provide valuable insights, avoiding unnecessary data. Successful traders know the importance of recording both measurable metrics and subjective observations. This involves tracking hard data, like entry/exit points, position sizing, and profit/loss (P&L), alongside softer variables like market conditions, emotional state, and the rationale for each decision.
This comprehensive approach provides a complete understanding of each trade.
Key Data Points for Actionable Insights
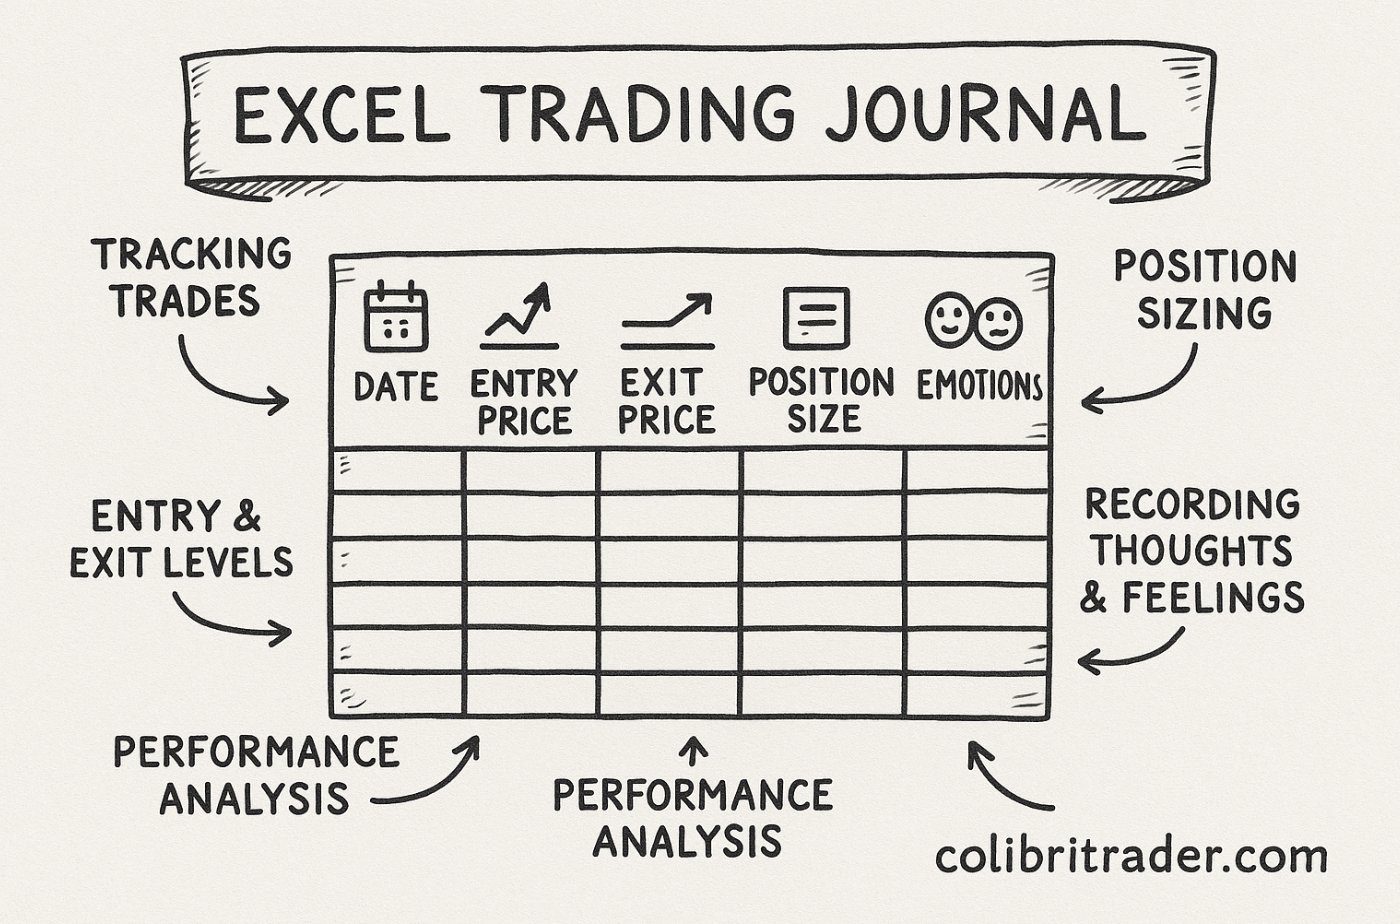
Creating a useful Excel trading journal template starts with these fundamental elements:
- Trade Details: Date, time, asset, and trade direction (buy/sell). These provide context and allow for efficient sorting and filtering.
- Execution: Entry price, exit price, and position size. These are critical for calculating P&L and understanding position management.
- Post-Trade Analysis: Profit/loss, risk/reward ratio, and notes on successes and areas for improvement. This is where real learning and strategy refinement happen.
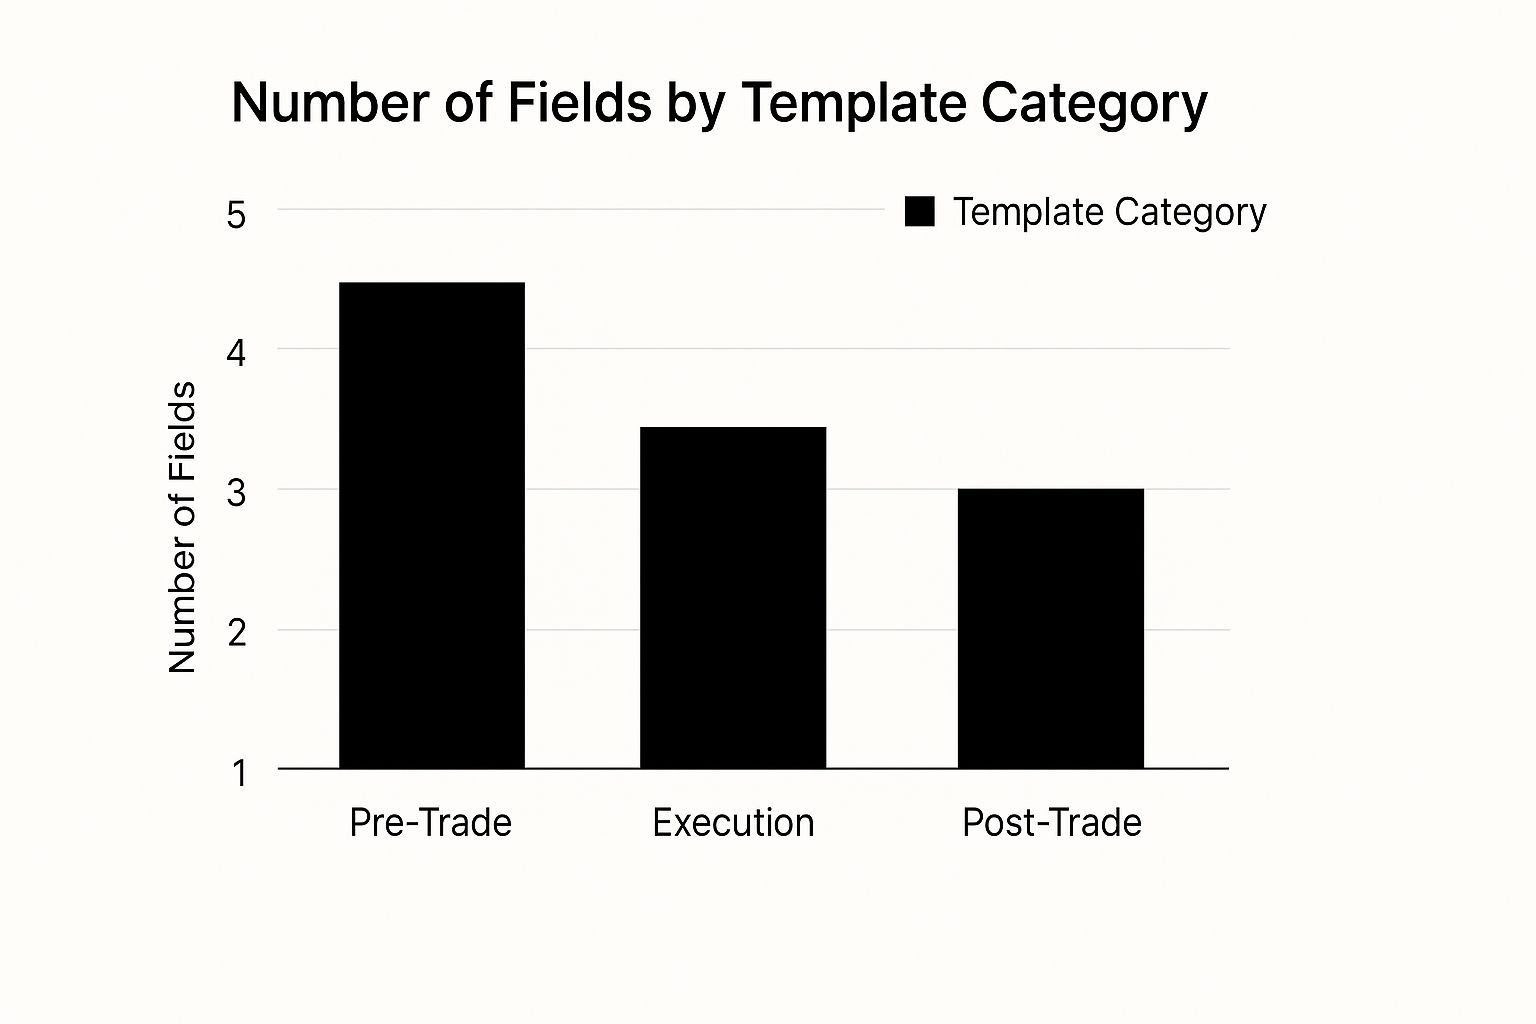
The infographic above illustrates the distribution of data fields within a trading journal, categorized into pre-trade, execution, and post-trade. Notice how, even though the execution phase has fewer fields, each one (entry price, exit price, and position size) is essential for accurate performance analysis. This emphasizes the importance of meticulous record-keeping.
To further understand the importance of a trading journal, you may find this resource helpful: How to backtest a trading strategy.
Utilizing Excel’s Power for Automated Analysis
Excel offers more than just manual data entry; its strength lies in automating calculations and uncovering patterns. Color-coding can visually highlight winning and losing trades, or those that deviate from your strategy. For instance, green could represent profits and red could highlight losses. This allows for rapid identification of areas needing attention.
Excel formulas can automate the calculation of key performance metrics. Functions like =SUM() for total profit, =AVERAGE() for average profit/loss per trade, and more complex formulas for win rate and maximum drawdown provide invaluable insights into progress and pinpoint strengths and weaknesses.
Structuring Your Template for Success
Experienced traders often organize their Excel trading journal templates with separate worksheets for different strategies or asset classes, promoting focused analysis. A dashboard summary worksheet can provide a quick overview of performance, using charts and graphs to display key metrics visually. This offers a clear snapshot of your trading performance. Finally, maintaining flexibility is essential. As your strategies evolve, the ability to add or remove columns ensures your journal remains a valuable tool.
To help illustrate the components of a good trading journal, let’s take a look at the following comparison table:
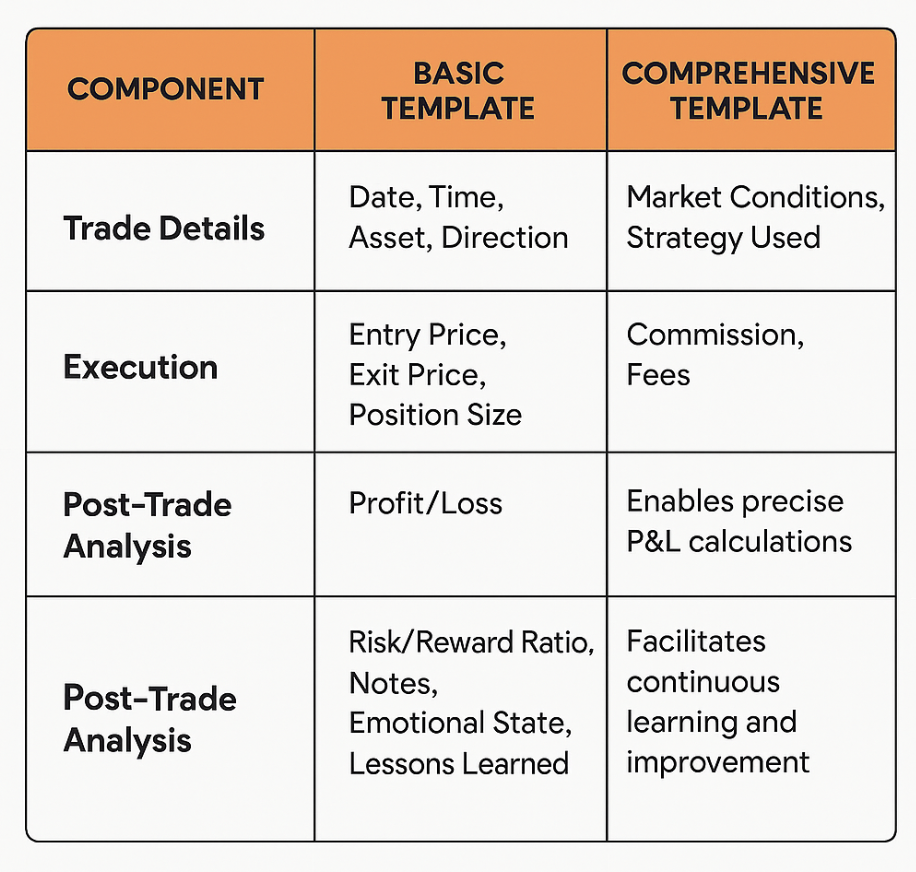
The table below outlines the key differences between a basic and a more comprehensive trading journal.
Essential Trading Journal Components Comparison
Comparison of basic versus comprehensive trading journal components with their benefits
| Component | Basic Template | Comprehensive Template | Key Benefit |
|---|---|---|---|
| Trade Details | Date, Time, Asset, Direction | Date, Time, Asset, Direction, Market Conditions, Strategy Used | Provides in-depth context for analysis |
| Execution | Entry Price, Exit Price, Position Size | Entry Price, Exit Price, Position Size, Commission, Fees | Enables precise P&L calculations |
| Post-Trade Analysis | Profit/Loss | Profit/Loss, Risk/Reward Ratio, Notes, Emotional State, Lessons Learned | Facilitates continuous learning and improvement |
This table summarizes the essential elements of both basic and comprehensive trading journals. While a basic journal captures the core trade data, a comprehensive journal delves deeper, providing a more holistic view of trading performance by including qualitative factors and more detailed metrics. By tracking these additional components, traders can gain a better understanding of their decision-making process and improve their overall results.
Building Your Custom Excel Trading Journal From Scratch
Ready to create an Excel trading journal template specifically designed for your trading strategy? This guide will help you build a robust system for documenting your trades, starting with the basic layout and moving on to automated calculations that instantly provide key performance metrics.

Designing Your Worksheet for Usability
First, think about the essential data points you need to track. These typically include Trade Details (date, time, asset), Execution (entry/exit price, quantity), and Post-Trade Analysis (profit/loss, fees). Organize these into clearly labeled columns. Using separate worksheets for different strategies, such as day trading and swing trading, can improve focus and clarity.
This initial setup is the foundation of a clear, user-friendly journal.
Implementing Data Validation and Automation
One of Excel’s strengths is its automation capabilities. Use dropdown menus for fields like “Strategy Type” or “Asset Class” to ensure consistency and reduce errors. This enforced consistency leads to better data quality for analysis. Also, use formulas for automatic calculations. A simple =SUM(ProfitLoss_Range) calculates your total profit/loss. More complex calculations, like win rate or maximum drawdown, are also possible with standard Excel formulas.
These automated features minimize manual effort and reduce the risk of mistakes.
Creating Specialized Worksheets and Dashboards
Consider creating separate worksheets for various strategies or asset classes. A day trading worksheet might track the time of day and market conditions, while a swing trading worksheet could focus on holding period and trend analysis. This segmentation enables more focused analysis. A dashboard summary sheet can provide a quick performance overview, displaying key metrics with charts and graphs.
Visualizing your performance data makes it easier to identify trends and areas for improvement.
As your trading progresses, so should your journal. Consider how automated trading journal templates can improve efficiency. For example, platforms like Tradervue offer automated integration with over 300 brokers, simplifying data entry and letting traders focus on refining their strategies. Automated trade imports save time and ensure data consistency, critical for accurate analysis. A trader could, for instance, analyze their performance across stocks, forex, and crypto using Tradervue’s template.
Building flexibility into your Excel trading journal is essential. Prepare for increased trade volume by using expandable data ranges and designing your layout for easy filtering and sorting. While adding advanced features, ensure data entry remains streamlined for consistent updates. A regularly maintained journal offers the most valuable insights.
Unlocking Advanced Analytics in Your Trading Journal
A simple excel trading journal template is more than just a list of your trades. It’s a powerful tool, brimming with potential. This section explores how advanced Excel features can transform basic trade data into valuable, actionable insights. It’s about moving beyond simply logging entries and exits. It’s about uncovering the hidden patterns driving your trading performance.
Unveiling Insights With Pivot Tables
One of the most powerful tools in Excel is the pivot table. Pivot tables summarize and analyze large amounts of data quickly.
For example, you can easily categorize your trading results by strategy, market conditions, or specific time periods. This helps pinpoint exactly where your edge lies. Perhaps you’ll discover your breakout strategy performs best during periods of high volatility.
This knowledge allows you to focus your efforts for maximum results.
Visualizing Your Performance With Charts and Graphs
Numbers tell a story, but visuals bring that story to life. Charts and graphs transform raw data into easy-to-understand trends.
You can instantly visualize winning and losing streaks, identify peak performance periods, and see how your strategies perform under different market conditions. For example, a simple line graph of your equity curve can reveal dangerous drawdown patterns.
This allows you to adjust your risk management before substantial losses occur.
Simulating Scenarios and Testing Strategies
Want to test a new strategy or tweak an existing one without risking real capital? Excel’s scenario analysis feature makes this possible. You can build models to simulate different market scenarios and assess their potential impact.
This might involve adjusting variables like entry/exit prices, position sizing, or stop-loss levels. By analyzing the outcomes of these simulated trades, you can optimize your strategies and make informed decisions in live trading.
You might be interested in: How to master pin bar strategies.
Key Metrics to Track in Your Excel Trading Journal
The data you track dictates the insights you gain. While the specifics depend on your trading style, some key performance metrics are universally applicable. The following table summarizes these vital metrics, their calculation, and target values for traders of varying experience levels.
To understand which metrics truly move the needle in your trading journey, consult the following table. It provides a breakdown of crucial metrics, their formulas, target values, and their significance.
Performance Metrics That Matter: Key metrics to track in your trading journal with recommended targets
| Metric | Formula | Beginner Target | Professional Target | Why It Matters |
|---|---|---|---|---|
| Win Rate | (Number of Winning Trades / Total Number of Trades) * 100 | 40% – 50% | 55% – 65% | Indicates the consistency of your winning trades. |
| Average Win/Loss Ratio | Average Profit of Winning Trades / Average Loss of Losing Trades | 1.5:1 | 2:1 or higher | Reveals the relationship between your average wins and losses; a higher ratio suggests potential for greater profitability. |
| Maximum Drawdown | (Peak Equity – Trough Equity) / Peak Equity * 100 | <20% | <10% | Measures the largest percentage decline from a peak to a trough in your account balance, highlighting risk tolerance and potential for recovery. |
| Profit Factor | Gross Profit / Gross Loss | 1.5 | 2 or higher | Indicates the overall profitability of your trading system; a higher profit factor indicates a more robust strategy. |
Tracking these metrics provides an objective performance assessment and identifies areas for improvement. This data-driven approach is more effective than relying solely on intuition. Building these calculations into your Excel trading journal, using formulas, ensures they’re always up-to-date and readily available.
Avoiding Critical Mistakes in Your Trading Journal
A well-structured Excel trading journal template is a powerful tool for any trader. But even the best template can be rendered useless if you fall into common traps. This section explores those potential pitfalls, drawing on the experience of seasoned traders, to help you analyze your performance effectively.
The Danger of Inconsistent Data Entry
Inconsistent data entry is a significant threat to the accuracy of your trading journal. Imagine diligently tracking your entry prices but occasionally forgetting your exit prices. This creates an incomplete and misleading picture of your actual performance, generating false signals about your profitability. These signals could lead you to make incorrect adjustments to your trading strategies.
For instance, consistently omitting losing trades will artificially inflate your win rate. This can breed overconfidence and potentially result in larger losses further down the line. Meticulous and complete data entry is crucial for accurate performance analysis.
Confirmation Bias and Distorted Analysis
Confirmation bias is the tendency to favor information that confirms your pre-existing beliefs. In trading, this can severely distort your analysis. If you only record trades supporting your preferred strategy and ignore those that contradict it, you’re creating a false sense of success. This behavior prevents you from identifying the weaknesses in your approach and adapting to changing market dynamics.
For example, if you believe a particular indicator always predicts winning trades, you might subconsciously overlook instances where it failed. This selective recording creates a distorted reality, hindering your ability to grow as a trader.
The Importance of Documenting Your Emotional State
Emotions have a profound impact on trading decisions. Neglecting to document your emotional state during a trade eliminates valuable context. Recording your mindset – whether you felt fear, greed, or confidence – provides insights into how your psychology influences your choices. This self-awareness is critical for developing emotional control and discipline.
Imagine entering a trade feeling overly confident and subsequently experiencing a substantial loss. Documenting your emotional state can highlight a destructive pattern to avoid in the future. Recognizing these emotional triggers allows you to develop strategies for managing them more effectively.
Safeguarding Your Journal’s Integrity
Several safeguards can prevent these common errors and ensure your Excel trading journal template remains a reliable tool:
- Data Validation Rules: Implementing data validation in Excel restricts entries to pre-defined options (e.g., “Buy” or “Sell” for trade direction). This minimizes input errors and improves consistency.
- Mandatory Fields: Making key fields mandatory (like entry/exit price and position size) ensures you don’t overlook crucial information during data entry.
- Scheduled Review Prompts: Set reminders to regularly review your journal – daily, weekly, or monthly. This promotes continuous refinement of your approach and helps you spot recurring patterns. To effectively use your journal, learn how to interpret the data you’ve collected. Explore available content analytics tools to gain deeper insights.
By implementing these safeguards, your Excel trading journal becomes more than just a record-keeping tool; it transforms into a powerful engine for continuous improvement. This disciplined, consistent approach sets apart consistently profitable traders from those who struggle.
Leveraging Your Trading Data For Continuous Growth

An Excel trading journal template isn’t just a static record; it’s a dynamic tool for improvement. This section explores how traders use their trading data to gain actionable insights, turning numbers into refined strategies. It’s about going beyond logging wins and losses and understanding what drives profitability.
Establishing A Review Framework
Consistency is crucial when reviewing your trading journal. Set a regular schedule – daily, weekly, and monthly. Each timeframe provides a unique perspective. Daily reviews can reveal emotional patterns or impulsive decisions. Weekly reviews can help identify recurring setups or refine entry and exit strategies.
Monthly reviews give a broader view of your performance and assess progress towards your goals. This structured approach prevents data overload and ensures regular analysis.
Categorizing Trades For Deeper Insights
To truly understand your market edge, categorize trades by different variables. This reveals the full picture, highlighting strengths and weaknesses. Consider these categories:
- Setup Type: Categorize by the entry trigger. This could include breakouts, reversals, or mean reversion strategies.
- Market Conditions: Note the market environment (bullish, bearish, or sideways) and volatility.
- Psychological Factors: Record your emotional state and confidence level before, during, and after each trade.
Analyzing performance across these categories identifies your most profitable setups. You’ll understand how different market conditions impact your results and pinpoint emotional patterns affecting decisions. For instance, you might discover you excel at breakout trading in volatile markets, but struggle with mean reversion in quieter periods.
Tracking Skill Development Over Time
Successful traders view trading as a continuous learning process. Your Excel trading journal is a powerful tool for tracking this development. Regularly assess key metrics like win rate, average win/loss ratio, and maximum drawdown.
Note any changes in these metrics over time. This data-driven approach avoids relying solely on gut feelings or recent results. It’s about objective analysis. Also, document lessons learned from both wins and losses, including insights into setups, market behavior, or psychological tendencies. Regularly revisiting these reinforces good habits and prevents repeating mistakes. This creates a powerful feedback loop for continuous learning.
Refining Your Edge Through Objective Analysis
Use the insights from your trading journal to inform future decisions. Identify and build upon your strengths. Perhaps you have a high win rate with a particular setup under specific market conditions. Focus on those high-probability opportunities.
Simultaneously, eliminate weaknesses. If you notice a pattern of emotional trading or consistent losses on a specific setup, develop strategies to address these. This data-driven approach ensures improvement is guided by objective analysis, not subjective feelings. By consistently reviewing your data and adapting your approach, you can continuously refine your edge and achieve long-term success.
Ready to transform your trading potential? Check out the day trading program- learn how to make $1,000 or more by risking only $100 per trade even if you have never traded before. Learn the Double-Digits day trading program now to pass challenges or trade on your own account