


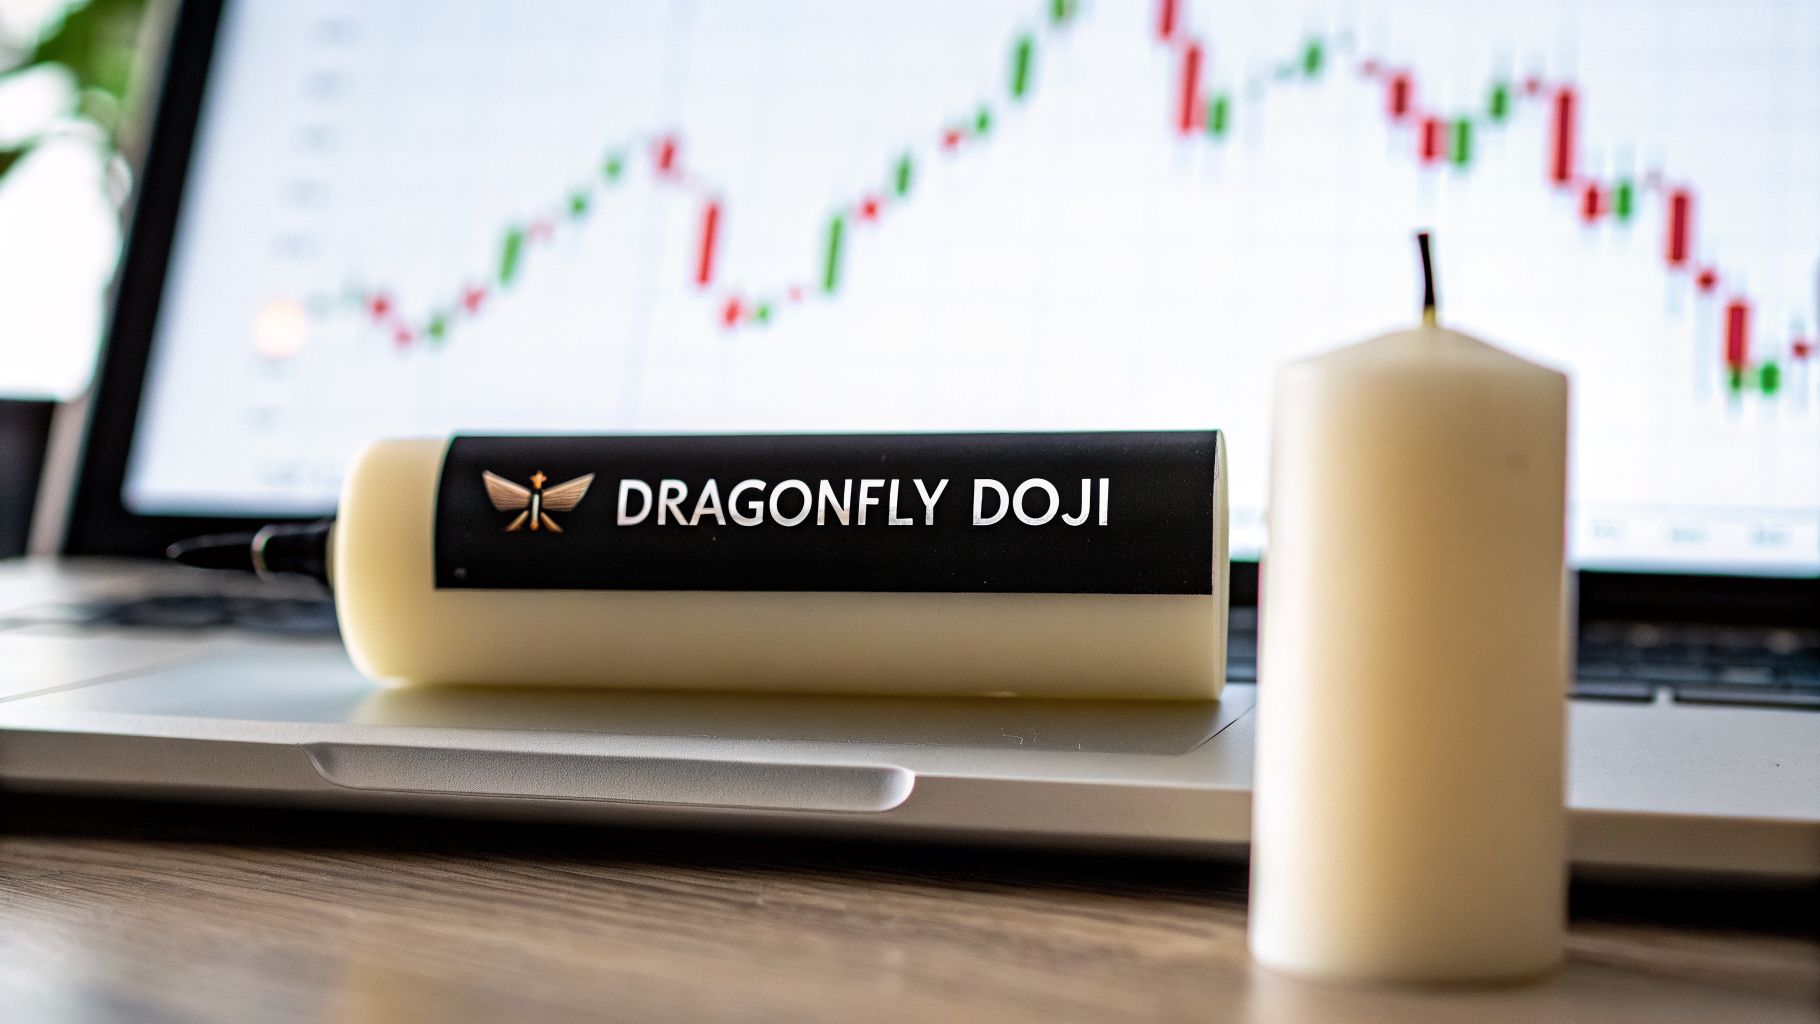
A Trader’s Guide to the Dragonfly Doji Candlestick
The dragonfly doji candlestick is one of those patterns that tells a whole story in a single candle. When you see one, it’s often a powerful signal that a bullish price reversal might be on the horizon.
Its unique 'T' shape is the key. It shows us that sellers gave it their best shot to tank the price, but buyers came in with overwhelming force, driving the price right back to where it started.
What Is a Dragonfly Doji and Why It Matters

I like to think of the dragonfly doji as a visual recap of a battle between buyers and sellers. For traders who know how to read price action, it’s much more than a shape—it’s a clear footprint of a dramatic shift in power.
Think of it like a tug-of-war. When the session opens, the sellers (bears) are in total command. They yank the rope hard, dragging the price down and creating that long lower shadow, or "tail." That tail marks the lowest point of the session and shows you just how aggressive the bears were.
The Decisive Reversal
But just when it looks like the sellers have won, the buyers (bulls) storm back in. They hit the market with so much force that they absorb every single sell order and shove the price all the way back up to its opening level.
The candle ends up closing at or extremely close to its high and open, leaving almost no "body" at the top. That's what gives the dragonfly doji its meaning. The price tried to go down, failed, and snapped right back.
Key Takeaway: That long lower tail is a massive rejection of lower prices. It’s the market screaming that a bear attack just failed, and that demand stepped in to viciously defend a price level.
To give you a quick reference, here are the core attributes of this pattern.
Dragonfly Doji At a Glance
| Characteristic | Description |
|---|---|
| Appearance | A 'T' shape. |
| Body | Tiny to non-existent body at the top of the trading range. |
| Shadows | A long lower shadow (tail) and little to no upper shadow. |
| Psychology | Sellers initially controlled the session, but buyers regained full control by the close. |
| Indication | Potential bullish reversal, showing strong rejection of lower prices. |
| Best Location | At the bottom of a downtrend or at a key support level. |
This table provides a snapshot, but the real skill is in understanding the context.
Understanding Its Importance
Seeing a dragonfly doji pop up on your chart, especially after a clear downtrend, is a signal you can't ignore. It doesn't guarantee a reversal is coming, but it’s a big clue that sellers are exhausted and buyers are waking up.
For a price action trader like myself, this is gold. It tells me the bearish mood might be fading and gives me a reason to start hunting for a potential long entry.
Because of this, it’s one of the most important patterns in the doji family. If you want to learn about the other variations, you can find more in our guide on what a doji candle is.
Reading the Market Psychology of the Dragonfly Doji

To really use the dragonfly doji candlestick effectively, you have to look past the shape and understand the story it's telling. This isn't just a pattern on a chart; it’s a minute-by-minute account of a fierce battle between buyers and sellers, where the market’s mood does a complete 180.
Imagine the market is in a clear downtrend. Sellers (the bears) are in complete control, feeling confident. As a new session kicks off, they keep pushing, driving the price down hard. This relentless selling pressure is what carves out that long lower wick, or tail, of the dragonfly.
With every tick lower, the bears feel more certain they have the market cornered. This is often called seller capitulation—that moment when it looks like there are no buyers left to stop the bleeding. The price is in a freefall, and the bears are running the show.
The Turning Point
But then, something snaps. Right at the bottom of that long wick, the selling pressure smashes into a wall. This isn't just any wall; it’s a hidden zone of massive demand where buyers were waiting patiently, seeing the falling prices as a massive discount. They step in, and they step in with force.
This is the climax of the story. The buyers start soaking up every sell order the bears throw at them. They don't just stop the price from falling—they start pushing it back up with surprising speed and strength.
That long lower wick isn't just an empty line on your chart. It's the footprint of a failed bear attack. It visually maps out the entire price range where sellers tried to take control but were ultimately overpowered and sent into a full retreat.
The dragonfly doji candlestick acts as a visual receipt of this intense market conflict. It proves that despite a strong initial push by sellers, buyers had the final say, completely rejecting the lower prices and demonstrating significant strength.
Grasping this psychology is what separates traders who just spot patterns from those who actually understand the forces moving the market. You're not just seeing a "T" shape; you're witnessing the exact moment bearish momentum dies and a new bullish conviction is born. You can dig deeper into this by reading about what market sentiment is and how it shapes price.
From Indecision to Bullish Conviction
As the buyers press their counter-attack, they manage to drive the price all the way back up to where the session started. The candle closes at or extremely close to its opening price, leaving that signature dragonfly shape behind.
This closing price is the final word. It tells us that even after a wild ride, the net result was a showdown that the bulls clearly won. The market tested lower prices, found them totally unacceptable, and snapped back with authority.
This whole sequence turns what could have been a moment of indecision into a powerful signal of bullish intent. Here’s what we learn from this battle:
- Seller Exhaustion: The bears threw everything they had at the market and failed. This is a huge clue that their power is fading.
- Active Demand: Buyers aren't just lurking; they are aggressive and ready to defend a specific price level.
- Rejection of Lows: That long tail is a crystal-clear message that the market has zero interest in lower prices right now.
When you see the dragonfly doji through this psychological lens, you can truly appreciate its power as a potential reversal signal. It’s a snapshot of a failed bearish campaign and the first spark of a bullish comeback, giving you a critical clue for what might happen next.
How to Identify a Perfect Dragonfly Doji
Seeing a "T" shape on your chart is one thing, but knowing when to trust it is another entirely. A lot of candles can look like a dragonfly doji, but only a handful are the real deal—the ones that signal a high-probability trade.
Think of yourself as a screener. Your job is to separate the genuine signals from all the market noise. To do that, a perfect dragonfly doji candlestick has to pass a strict, two-part test before you should ever consider putting money on it. First, the anatomy of the candle itself, and second, where it shows up.
The Anatomy of a High-Probability Dragonfly
A textbook dragonfly doji is actually quite rare. When you find one, it's a powerful statement from the market. Here's the checklist I use to validate the pattern’s structure:
Open, High, and Close Are Almost Identical: This is the non-negotiable rule. These three prices must be at the exact same level, or extremely close. This is what creates that flat top of the "T" and shows that buyers fought all the way back to where the session started.
A Very Long Lower Tail: The lower shadow, or tail, needs to be long and stick out. A good rule of thumb is that the tail should be at least two or three times longer than a typical candle body for that timeframe. This long tail is the visual footprint of the sellers' failed attack.
No Upper Shadow (or an Insignificant One): A perfect dragonfly has no upper wick at all. A tiny, barely visible shadow might be okay, but anything more than that starts to weaken the signal. An upper shadow tells you that buyers couldn't quite hold the price at its peak, which is a small crack in the bullish story.
Context Is Everything
Even a textbook-perfect dragonfly doji means nothing on its own. Its power comes from its location on the chart. A dragonfly that pops up in the middle of a choppy, sideways market is just noise. Ignore it.
The most powerful signal happens when the dragonfly doji candlestick forms at the bottom of a clear downtrend. This is the key. Its appearance here suggests that the sellers are finally running out of steam and a major turning point could be just around the corner.
A dragonfly doji at a major support level is the gold standard of reversal signals. It shows that buyers not only rejected lower prices but did so at a historically significant level, adding a powerful layer of confirmation to your trade idea.
On the flip side, its bearish twin, the Gravestone Doji, signals a potential reversal at the top of an uptrend. If you want to understand both sides of these reversals, you might find it helpful to read our guide on the Gravestone Doji candlestick.
So, finding a great dragonfly setup is always a two-step process. First, check the candle's anatomy—the "T" shape, long tail, and no upper shadow. Second, confirm its location. Make sure it appears after a solid downtrend, ideally at a known support zone. This filtering process is how you focus only on the trades with the highest odds of working out.
A Step-by-Step Plan for Trading the Dragonfly Doji
Seeing a dragonfly doji on your chart is one thing. Actually turning that little candlestick into a profitable trade? That’s a completely different game. Spotting the pattern is just the first step; you need a solid plan for your entry, your stop-loss, and your exit.
This is where most new traders get tripped up. Without a plan, you're just trading on emotion. You see the doji, get excited, and jump in, often turning a great setup into a frustrating loss. A concrete plan is what separates guesswork from a genuine strategy.
Let’s walk through the exact steps to trade this powerful reversal signal, from identification to taking profit.
This quick visual breaks down what you're looking for: a long lower shadow, a tiny body up top, and, most importantly, context. The pattern has to show up at a support level to mean anything.

When these three elements come together, you have a signal worth paying attention to. A dragonfly floating in the middle of nowhere is just noise.
Step 1: Confirm Bullish Momentum
Here’s the most common mistake I see: traders buying the second the dragonfly doji closes. Don't do it. The pattern signals a potential reversal, not a guarantee. All it tells you is that the fight between bulls and bears just ended in a draw. Now you need to see who comes out swinging.
The best practice is to wait for confirmation.
Look for the very next candle to be a strong, bullish candle that closes clearly above the high of the dragonfly doji. This is the market telling you, "Okay, the bulls meant business, and they're in control now." That follow-through is your green light.
Trader's Tip: Patience is your best friend here. By waiting for the next candle to break the dragonfly's high, you’ll sidestep a ton of false signals where the price just chops around or even continues its slide downward.
Step 2: Define Your Entry and Stop-Loss
Once you get that bullish confirmation, it’s time to plan your attack. A systematic approach to your entry and stop is non-negotiable for managing your risk.
Your plan needs two specific price points before you ever click "buy":
- Entry Point: A common and effective entry is to place a buy order as soon as the price moves above the high of the dragonfly doji. Some more conservative traders will wait for the confirmation candle to fully close above that high for extra certainty.
- Stop-Loss Placement: Your stop-loss goes just below the low of the dragonfly's tail. This is your line in the sand. If the price breaks below this point, the bullish rejection has failed, and your reason for being in the trade is gone.
Placing your stop here protects you from a major loss if the reversal fizzles out. It gives the trade just enough room to work without exposing your account to a big hit.
Step 3: Set Clear Profit Targets
Getting into a trade is easy. Knowing when to get out with a profit is what separates amateurs from professionals. A dragonfly doji can kick off a great new uptrend, but you need to have realistic targets to actually bank those gains.
You absolutely must decide on your profit targets before you enter the trade. This keeps you from making emotional decisions in the heat of the moment.
Here are two of my favorite ways to set targets:
- Target the Next Resistance Level: Look left on your chart. Where did the price struggle before? Find the nearest significant resistance—a previous swing high, a major moving average, or a supply zone. These are the natural spots where sellers might show up again, making them perfect places to cash out.
- Use a Fixed Risk-to-Reward Ratio: This is all about discipline. Aim for a minimum risk-to-reward ratio, like 1:2 or 1:3. For every dollar you're risking (the distance from your entry to your stop), you're aiming to make at least two or three. This simple math ensures that your winners pay for your losers, and then some.
It also pays to be realistic about the pattern's performance. While confirmation and context are everything, the numbers give us a baseline. Backtesting studies show the dragonfly doji candlestick has a success rate of about 55.3% as a bullish reversal signal. The same research shows an average return of around 0.46% over a 10-day holding period for long trades. You can read a full breakdown of the dragonfly doji's historical performance on BullishBears.com.
This data doesn't mean the pattern is bad; it just proves why a rock-solid trading plan is so critical. Not every signal will be a home run.
How to Avoid False Signals and Costly Mistakes
Let's be clear: while the dragonfly doji is a fantastic pattern, no signal in trading works 100% of the time. If you treat it as a guaranteed buy signal, you're setting yourself up for some painful losses.
The truth is, this candlestick can and will give you false signals. Understanding why they fail is what separates traders who protect their capital from those who don't.
Most false signals happen when you ignore the market context. A dragonfly doji candlestick that pops up in the middle of a choppy, sideways market is just noise. It's showing a moment of indecision, not a real shift in power. Without a clear downtrend to reverse, the pattern means nothing and should be ignored.
The Strong Trend Trap
One of the most dangerous mistakes I see traders make is fighting a powerful, high-momentum downtrend with a single dragonfly. In these markets, sellers are in complete control. That one little candle is more likely a brief pause for breath, not a genuine reversal.
Often, aggressive sellers will see that tiny bounce as a gift—a chance to add to their short positions at a better price. Before you know it, the downtrend slams back down with even more force. Trading against that kind of momentum is like trying to stop a freight train with your bare hands.
A single dragonfly doji is rarely enough to halt a powerful, established trend. The market needs more evidence that the sellers are exhausted. Wait for multiple signs of a bottom forming, not just one candle.
Introducing the Gravestone Doji and Other Variations
Another common point of confusion is mistaking the dragonfly for its variations. The bearish twin of the dragonfly is the Gravestone Doji. It looks like an upside-down "T" and warns of a potential reversal at the top of an uptrend. Mixing these two up can lead to disastrous trades.
- Dragonfly Doji: Long lower shadow, signals a potential bullish reversal at a bottom.
- Gravestone Doji: Long upper shadow, signals a potential bearish reversal at a top.
You'll also run into "imperfect" dragonflies—candles with slightly bigger bodies or even a small upper shadow. They still signal indecision, but the further they get from that perfect "T" shape, the less reliable they become as a pure reversal signal.
Confluence: The Ultimate Filter
So, how do you filter out all the noise and focus only on the signals that matter? The answer is confluence. A dragonfly doji should never be traded on its own. Its real power comes when it confirms something you already see on the chart.
Instead of hunting for the pattern, look for it to appear at key areas you've already identified:
- At a Major Support Level: When a dragonfly forms right on a key horizontal support zone, it’s a strong sign that buyers are stepping in to defend that price.
- Bouncing Off a Trendline: Seeing a dragonfly touch a long-term ascending trendline gives you a great reason to believe the uptrend is ready to continue.
- Aligning with a Moving Average: The pattern popping up at a dynamic support level, like the 50 or 200-period moving average, adds serious weight to the bullish case.
Historical data backs this up. Context is everything. While the pattern's general success rate is around 55%, specific setups perform much better. For instance, research from ThePatternSite.com shows that in bear markets with down breakouts, the dragonfly doji can hit its price target up to 80% of the time. This just proves how critical market conditions are and why you must always trade with confluence.
Integrating the Dragonfly Doji into Your Strategy
A single candlestick, even a powerful one like the Dragonfly Doji, is just one clue. If you really want to succeed, you have to stop hunting for individual patterns and start thinking like a professional price action trader. It's about piecing together the market's story.
The Dragonfly Doji candlestick isn't a magic bullet that prints money. Its real power comes alive when it shows up at a high-probability location you've already identified on your chart. Think of these as hotspots where you fully expect a battle between buyers and sellers to break out.
Using Confluence to Build Your Case
The trick is to stop reacting to a Dragonfly Doji after it appears and start anticipating where it should form. The most reliable signals pop up when the candlestick confirms a technical level you've already marked out.
- Demand Zones: These are areas where price previously shot up, leaving a cluster of unfilled buy orders behind. When a Dragonfly Doji forms right in that zone, it tells you that sidelined buying pressure is kicking in.
- Long-Term Support Levels: A horizontal line that has propped up price multiple times in the past is a major level to watch. A Dragonfly rejecting this line is a strong sign that historical support is holding firm once again.
- Key Moving Averages: Dynamic support from indicators like the 50 or 200-period moving average can also act as a springboard. A Dragonfly bouncing cleanly off one of these MAs adds another layer of evidence to your bullish idea.
When you spot a Dragonfly Doji at one of these confluent points, your trade idea transforms from a hopeful guess into a well-supported plan. You're no longer just trading a candlestick; you're trading a high-probability reaction at a critical market area, with the candlestick acting as your final confirmation.
This shift in thinking is what separates amateurs from pros. You’re not a pattern hunter anymore. You are a market analyst building a case for a trade, and the Dragonfly Doji is your final, compelling piece of evidence.
Backtesting for Confidence and Proof
Reading about a strategy is one thing. Trusting it with your hard-earned money is something else entirely. That requires confidence built on proof, and that’s where backtesting comes in.
The final step is to go back through your charts and study how the Dragonfly Doji has performed for yourself.
Scroll back in time on your favorite pairs or stocks. Find every single time a Dragonfly Doji appeared at a key support level or demand zone. Log what happened next. Did price reverse? How far did it run before pulling back? What did the failed signals have in common?
Doing this work builds the data-backed proof you need to pull the trigger without hesitation. By seeing the pattern work (and fail) with your own eyes, you develop the intuitive feel and rock-solid confidence needed to execute your plan when a real opportunity appears in live markets.
Frequently Asked Questions
Still have a few questions? Let's clear up some of the common points of confusion I see traders run into with the dragonfly doji candlestick. Getting these details right can make all the difference.
Is a Dragonfly Doji Always Bullish?
Mostly, yes. But you have to know where to look for it. The dragonfly doji earns its reputation as a bullish reversal signal when it shows up after a solid downtrend, right on top of a key support level. Context is everything here.
But what if it pops up in the middle of an existing uptrend? It's not necessarily a sell signal, but it is a warning flag. It tells you the bulls might be getting tired and losing control. Think of it as a sign of indecision, a pause in the momentum.
What Is the Difference Between a Dragonfly Doji and a Hammer?
They look incredibly similar, and both signal a bullish reversal. The real difference is tiny but important, and it’s all in the candle's body.
A textbook dragonfly doji has no real body at all. The open, high, and close are all at the exact same price, leaving just a flat line at the top of a long lower wick.
A Hammer has a small, visible body at the top. This means the close was a bit below the high for the session, but still way up from the lows. Both patterns show that sellers tried to push the price down and failed spectacularly.
Key Difference: I think of it this way: a dragonfly doji shows pure indecision that happens to resolve in the bulls' favour. A Hammer shows a more decisive fight that the bulls clearly won by the end of the session.
How Reliable Is the Dragonfly Doji Pattern?
On its own? The reliability is just okay. A lone dragonfly doji is simply a snapshot of indecision where sellers got rejected. It’s a clue, not a confirmed trading plan.
Its reliability shoots up when you get confirmation. I never trade a dragonfly doji until I see it form at a proven support zone and it’s followed by a strong bullish candle that closes above the doji's high. Always use it as part of a broader strategy, not as a standalone magic bullet.
Ready to transform your trading skills with proven price action strategies? At Colibri Trader, we provide no-nonsense guidance to help you achieve consistent results. Start your journey by taking our free trading quiz and discover your true potential. Learn more at https://www.colibritrader.com.