


What Is a Bull Flag Pattern A Trader’s Guide
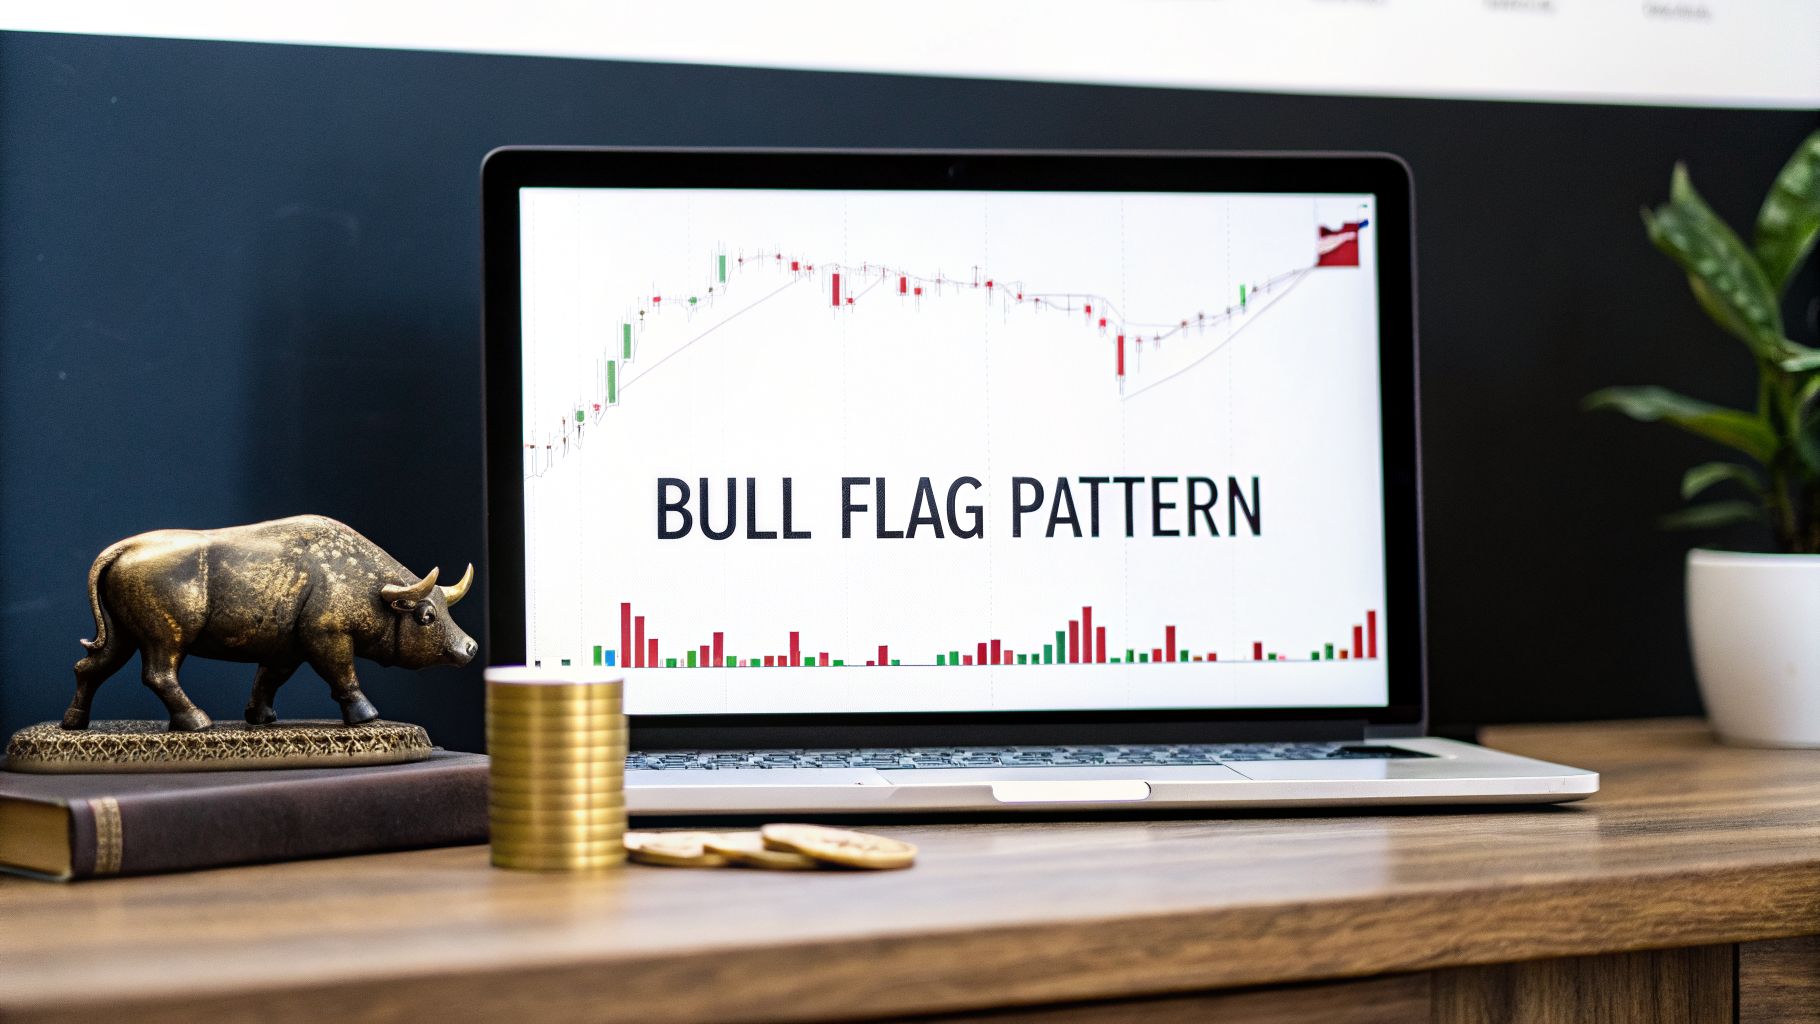
A bull flag is one of the most reliable chart patterns out there, signaling that a strong uptrend is likely to continue. I think of it as the market taking a quick breather after a massive sprint upwards, gathering steam before the next leg of the race. It's a favorite for price action traders because you don't need a mess of complicated indicators to spot it—the story is told right there in the price.
Understanding The Bull Flag Pattern
The pattern gets its name because, well, it looks exactly like a flag on a flagpole. This simple visual makes it one of the easiest formations to identify once you know what you're looking for. It has two main parts, and each one tells you something specific about what's happening with buyers and sellers.

To really get a feel for this pattern, you need to understand its two core components. Each one represents a different phase of market action and tells a story about who is in control.
Let's break them down in this quick table.
Anatomy of a Bull Flag Pattern
| Component | Description | What It Signals |
|---|---|---|
| The Flagpole | An explosive, near-vertical price surge on high volume. | A massive influx of buying pressure. Bulls are decisively in control. |
| The Flag | A brief, orderly pullback or consolidation, forming a downward-sloping channel or rectangle. | Minor profit-taking, but sellers lack the power to reverse the trend. New buyers are accumulating positions. |
| The Breakout | The price pushes decisively above the flag's upper trendline. | Confirmation that the pause is over and the original uptrend is resuming. |
These pieces fit together to tell a very clear story about market momentum.
The Two Core Components
The pattern is really defined by these two distinct parts. You need both for a valid setup.
First, you have The Flagpole. This is that initial, explosive move higher. It’s a nearly vertical price spike that shows a sudden burst of aggressive buying. A strong, clear flagpole is absolutely essential; without it, you don't have a bull flag.
Next comes The Flag. This is the consolidation period that follows the big move. It looks like a small, downward-drifting rectangle or channel. This slight dip shows that some of the early buyers are cashing out and taking profits, but crucially, sellers don't have enough conviction to drive the price down and reverse the trend.
This pause isn't a sign of weakness. It's actually a period of healthy accumulation where the market digests the recent move and new buyers get ready to jump in. This orderly pullback is exactly what we want to see, as it tells us the underlying bullish sentiment is still very much intact. If you want to learn more about these sideways moves, have a look at our guide on what market consolidation is and its importance.
The bull flag is a story of momentum and rest. The flagpole is the burst of energy, and the flag is the controlled rest before the trend continues its journey higher.
When the price finally breaks out above the top of the flag, it's the confirmation we've been waiting for. It signals that the bulls have wrestled back full control and the original uptrend is ready to resume, often with the same force as the initial flagpole move.
The Anatomy of a High-Probability Bull Flag
Not all bull flags are created equal. I’ve seen countless traders get excited by a pattern that looks like a flag, only to watch the trade crumble. The real skill is learning to spot the difference between a weak lookalike and a high-probability setup that’s ready to move.
To me, a reliable bull flag isn't just a shape; it's a specific sequence of events on the chart. Think of it as a checklist. Before I even consider a trade, I make sure every single one of these boxes is ticked. If even one element is missing, I walk away. It’s that simple.

These components are the footprints of smart money. A genuine bull flag shows you clear evidence of aggressive buying, followed by a disciplined pause. It's a story of conviction, not a chaotic tug-of-war between buyers and sellers. By vetting each element, you filter out the noise and focus on setups with real potential.
The Five Essential Elements
A quality bull flag is a story where each piece confirms the bullish narrative. A missing part is a major red flag (pun intended), warning you that the setup is likely to fail.
Here are the five critical parts I always look for:
- Strong Preceding Uptrend: The pattern has to show up in a market that’s already moving up. A bull flag that forms in a downtrend or a messy, sideways market is a trap. I ignore them completely.
- The Explosive Flagpole: This isn’t a slow, grinding move higher. You need to see a sharp, almost vertical rally built on high volume. This is your proof that buyers are in aggressive control and mean business. A weak flagpole signals a lack of commitment.
- The Orderly Flag: This is the consolidation, or the "rest." It should be a tight, downward-sloping channel. Crucially, the pullback needs to be shallow. I look for a retracement of no more than 38% of the flagpole. If it pulls back too deep, it tells me sellers are getting a foothold.
- Specific Volume Behavior: Volume is your truth indicator. You want to see high volume on the flagpole, which then noticeably decreases during the flag's formation. This tells you that the sellers are weak and the pause is just that—a pause, not a reversal.
- A Clean Breakout: This is the final trigger. I need to see a decisive candle close above the flag's upper boundary, and it absolutely must be on a surge in volume. This is the signal that buyers are back and ready to kick off the next leg up.
A high-probability bull flag is a story of buyer dominance. The flagpole shows their initial power, the shallow flag shows seller weakness, and the volume signature confirms their underlying control.
The flag itself is outlined by two parallel trendlines. If you're not confident in drawing these accurately, our guide on how to draw a trendline is a great place to master this skill. A clean, contained flag where price respects these lines is the hallmark of a disciplined pattern. When any of these five elements look weak, the probability of a successful trade drops dramatically.
Understanding the Psychology Behind the Pattern
Chart patterns aren't just squiggles on a screen. I see them as a visual story of the constant tug-of-war between buyers and sellers playing out in real time. To really get a feel for the bull flag, you have to understand the why behind its shape—the psychology that makes it such a powerful setup.
Think about a stock that’s been pushing higher. All of a sudden, a wave of aggressive buying hits the market, rocketing the price upward. This creates the sharp, almost vertical flagpole. This isn’t a random event; it's a blast of pure optimism, usually sparked by good news or a major shift in market sentiment. The conviction is so strong that sellers are simply blown out of the water.
The Pause That Refreshes
After such an explosive move, the market has to catch its breath. This is where the flag begins to take shape. The first wave of buyers, the ones who got in early, start to skim some profits. Their selling creates a gentle downward or sideways drift, which forms that classic channel look.
But don't mistake this for a reversal. The real clue is in the volume. During this phase, you should see trading volume drop significantly.
A drop in volume while the flag is forming is one of the most important tells you can get. It shows there's no real conviction from the sellers. There just isn't enough bearish firepower to reverse the powerful move that just happened.
This quiet, orderly pullback is exactly what patient traders, especially the big institutions, are waiting for. They don't see this dip as a red flag; they see it as a low-risk chance to get in. They use this consolidation to build up their positions at a better price before the next leg up they're anticipating.
The Battle for Control
The bull flag pattern is a temporary truce. You have the early bulls cashing in, while a new group of patient bulls are buying the dip. The sellers are there, but they’re weak and can't push the price down with any real force.
This tension builds up like a coiled spring. The falling volume tells you the sellers are running out of steam. As soon as they’re exhausted and the institutional players have loaded up, it only takes a tiny bit of fresh buying to break the stalemate. That spark ignites the breakout, and the price explodes higher, often with the same kind of force we saw in the initial flagpole, as the dominant uptrend takes over again.
How to Identify and Validate Bull Flags in Real Time
Spotting a bull flag on a live chart is more than just pattern recognition. Anyone can see a shape that looks like a flag, but knowing how to tell a high-probability setup from a dud is what separates consistently profitable traders from the rest. It’s all about knowing what clues to look for.
Think of it like being a detective. A genuine bull flag leaves a trail of evidence, and your job is to follow it. I’ve found that having a simple, rule-based checklist is the best way to do this. It keeps you disciplined and helps you avoid the messy, unreliable patterns that just bleed your account dry.
Step 1: Analyze the Flagpole's Strength
The first thing I always look for is the flagpole. This is the foundation of the entire pattern, and if it's weak, the rest doesn't matter. A weak, choppy climb to the top is an instant red flag for me, and I’ll just move on to the next chart.
Here’s what a strong flagpole looks like:
- A sharp, explosive move up. It should look almost vertical on the chart. This tells you that buyers are in complete control and have aggressively pushed the price higher.
- A surge in volume during the climb. High volume is non-negotiable. It confirms there’s real money and conviction behind the move, not just random market noise.
- It forms within an existing uptrend. A bull flag is a continuation pattern. It should show up as a pause in an established uptrend, not out of nowhere in a sideways or falling market.
Without a powerful flagpole, any pattern that follows is likely a trap. It’s your first and most important green light.
The psychology here is pretty straightforward. You have aggressive buyers creating the flagpole, a brief pause as sellers try to step in, and then the bulls take over again.

This visual captures it perfectly: initial buyer dominance, a short-lived pullback, and then the breakout as bulls regain control.
Step 2: Confirm the Flag's Structure
Once I've confirmed a strong flagpole, I zoom in on the consolidation—the flag itself. The structure of this pause is just as crucial as the initial move up. What you want to see is a tight, orderly channel that drifts downward, against the main trend.
A shallow pullback is a sign of strength. It shows that sellers lack the power to reverse the trend, and bulls are simply catching their breath before the next push higher.
This is where volume gives you another major clue. As the flag forms, you should see volume dry up. This tapering off shows that there's no real conviction from the sellers. They aren't pushing the price down with any force.
In my experience, the bull flags that lead to the most explosive moves are the ones that break out on 20% to 30% above-average volume. The combination of a strong pole, a tight flag, and declining volume during the consolidation is a textbook setup.
Step 3: Monitor for a Valid Breakout
The last piece of the puzzle is the breakout. This is your trigger, the signal that the pause is over and the uptrend is ready to resume.
But not just any move above the flag's trendline counts. I wait for a strong, decisive candle to close cleanly above the resistance line. This shows commitment from the buyers.
Most importantly, this breakout must happen on a significant surge in volume. This is your final confirmation that buyers have returned in force and are ready to drive the price higher. A breakout on weak volume is a warning sign that the move might not have enough fuel to follow through.
If you really want to master this final step, our guide on how to trade breakouts effectively breaks down the specific techniques I use.
Alright, let's talk about how to actually trade this pattern. Spotting a beautiful bull flag on your chart is one thing, but turning it into a profitable trade requires a solid plan.
Without a plan, you're just guessing. A clear set of rules for your entry, stop-loss, and take-profit keeps you from making emotional decisions in the heat of the moment. This is how you build consistency.
Here's a simple, three-step approach I use for trading bull flags.

Step 1: Pinpoint Your Entry Trigger
Your entry is everything. Jump in too soon, and you risk getting caught in a fakeout. Wait too long, and you might miss the entire move. You need a specific event that tells you, "Okay, the buyers are back in control."
For me, the most dependable signal is a strong candle closing decisively above the flag's upper trendline. I don't care if the price just pokes its head above the line for a second. I want to see a full candle close, confirming that the buyers mean business. This one rule filters out a ton of market noise.
- Aggressive Entry: You can enter as soon as a candle closes above the flag’s resistance line. This gets you into the trade early, but you have a slightly higher chance of it being a false breakout.
- Conservative Entry: A safer way is to wait for the breakout, then enter when the price pulls back to test that old resistance line, which should now be support. This gives you more confirmation, but sometimes the price takes off without a retest, and you miss the trade.
Step 2: Set a Protective Stop-Loss
I'll say it again for the people in the back: every single trade needs a stop-loss. It's your safety net. It defines exactly how much you're willing to lose if the trade goes against you, and it protects your trading account from a catastrophic loss.
With a bull flag, placing your stop is pretty logical. The best spot is just below the lowest low of the flag consolidation.
Putting your stop here gives the trade enough room to wiggle around without stopping you out prematurely. If the price does break below this low, it's a clear signal that the pattern has failed. The bulls have lost control, and you want to be out of that trade anyway.
Your stop-loss is the point where your trade idea is proven wrong. Never, ever move it down to try and avoid a loss.
Step 3: Calculate Your Profit Targets
Knowing when to take your profits is just as crucial as knowing when to get in. With the bull flag, there's a classic technique for setting a logical price target called the "measured move."
It's a straightforward method that uses the pattern's own momentum to project a target.
Here’s how you do it:
- Measure the Flagpole: Calculate the price distance from the very bottom of the flagpole to its peak.
- Project the Move: Take that same distance and add it to the breakout point of the flag. That new price level is your primary profit target.
The logic here is that the burst of buying pressure that created the flagpole is likely to repeat itself after the consolidation phase. This technique works because you're basing your target on the power the market has already shown.
The bull flag has earned its reputation as a reliable pattern, and this structure helps traders find predictable entry and exit points. You can learn more about its consistency across different markets and timeframes. Using the measured move simply lets the market's own geometry guide your trade management.
Common Questions About the Bull Flag Pattern
Once you get the hang of the bull flag's mechanics, you'll probably still have a few questions. This is normal. A lot of traders wonder how it stacks up against other patterns or what to do when a perfect-looking setup goes wrong.
Let’s tackle some of the most common questions I get. Think of this as a quick reference to sharpen your understanding and help you trade these patterns with more confidence.
What Is the Difference Between a Bull Flag and a Bull Pennant?
At a glance, bull flags and bull pennants can look almost identical. There's a good reason for that—they both signal the exact same thing. Both are bullish continuation patterns that pop up after a strong move higher, showing a brief pause before the trend kicks off again.
The only real difference is their shape.
- Bull Flag: The consolidation part looks like a rectangle or a channel that slopes gently downward. The top and bottom lines are parallel.
- Bull Pennant: The consolidation looks like a small, symmetrical triangle. The trendlines squeeze together, pointing toward a single point.
Even though they look a bit different, the market psychology behind them is the same. In both cases, the market is just catching its breath after a big run. Volume dries up during the consolidation and then comes roaring back on the breakout. Because of this, I approach both patterns with a very similar strategy for my entries, stops, and targets.
How Reliable Is the Bull Flag Pattern?
The bull flag is one of the more reliable continuation patterns you'll find in technical analysis. I've found its success rate is high because the structure is so clear. It represents a strong agreement among traders that the original trend is about to continue.
When all the pieces are there—a strong flagpole, a tidy flag, and the right volume signature—the odds are stacked in your favor.
But you have to remember that no chart pattern works 100% of the time. The market can and will do anything, and even textbook setups fail.
The reliability of a bull flag isn't a guarantee of profit; it's a statistical edge. Your success depends on combining pattern recognition with disciplined risk management, such as using a stop-loss on every single trade.
Think of the pattern as a green light, not a blank check. It gives you an edge, but you must always protect your capital in case the trade doesn't go your way. A failed pattern is just another part of the business of trading.
What Does a Failed Bull Flag Look Like?
Knowing how to spot a failing pattern is just as important as identifying a good one. A failed bull flag can turn a great-looking setup into a loss in a hurry. Recognizing the warning signs early can save you from a lot of pain.
A bull flag officially fails when the price breaks below the flag's lower support trendline instead of breaking out to the upside. This is the clearest sign that sellers have taken control and the bullish continuation you were waiting for isn't going to happen.
Here are the key warning signs I look for:
- Breakdown Below Support: The price closes decisively below the bottom of the flag channel. This is the final confirmation of failure.
- High Volume on the Breakdown: If that breakdown happens with a big spike in selling volume, it's an even stronger signal that a reversal is underway.
- Lack of Breakout Momentum: The price might try to poke its head above the flag's resistance but does so on weak volume. It can't get any traction and quickly falls back into the channel.
When you see these signs, the bullish idea is dead in the water. Instead of a continuation, the breakdown is more likely the start of a new downtrend or a much deeper correction.
At Colibri Trader, we teach you to master price action so you can trade with confidence, free from complex indicators. Our action-based programs provide the clear, no-nonsense guidance needed to achieve consistent results. Transform your trading performance by exploring our courses at https://www.colibritrader.com.