


Your Guide to Understanding Doji Candle Meaning
A Doji candle is a powerful signal of indecision in the market, popping up when the opening and closing prices are almost identical. It often looks like a cross or a plus sign, telling you that neither the buyers nor the sellers could gain the upper hand. For a trader, understanding the doji candle meaning is a crucial first step in reading market sentiment and spotting potential turning points.
What a Doji Candle Signals to Traders
Picture a fierce tug-of-war between the market bulls (buyers) and bears (sellers). Throughout the trading session, both sides are pulling with everything they've got, pushing the price up and then yanking it back down. A Doji forms when, at the end of all that effort, the rope is right back where it started. This visual standoff on your chart is a pure, unfiltered signal of indecision.
The core message? The current trend might be running out of gas. If an asset has been climbing steadily and a Doji appears, it’s a hint that the buyers are getting tired. On the flip side, a Doji at the bottom of a downtrend suggests the sellers might be losing their grip.
Before we dive deeper, let's get a quick snapshot of what a Doji tells us.
Doji Candle at a Glance
| Characteristic | What It Means for Traders |
|---|---|
| Open = Close | A perfect stalemate between buyers and sellers. |
| Small/No Body | Shows extreme indecision in the market. |
| Long Wicks | Price moved a lot, but ended up back where it started. |
| Context Matters | Its meaning changes depending on the preceding trend. |
| Not a Standalone Signal | It’s a warning, not an entry signal. Always wait for confirmation. |
This table boils it down, but the real skill comes from understanding the candle's anatomy in the context of the broader market action.
The Anatomy of Indecision
What really makes the Doji stand out is its unique structure. It has a tiny—or sometimes nonexistent—body, which is the dead giveaway that the open and close prices were neck and neck. The long lines stretching out from the body, known as wicks or shadows, show the full story of the battle that took place during that trading period.
- Small or No Body: The key feature. It shows the open and close prices are at or very near the same level.
- Upper Wick: This shows the highest price the bulls managed to push to during the session.
- Lower Wick: This represents the lowest price the bears dragged the market to before the close.
A Doji isn't a red or green light. Think of it as a yellow traffic light for traders. It’s a signal to slow down, pay very close attention, and see what the next candle does before making a move.
The Doji candlestick pattern, a classic tool from Japanese technical analysis, is a vital indicator for spotting market uncertainty. To really get the most out of it, you need a solid foundation in chart reading. If you're just starting, getting a handle on how to read stock charts is essential. And for a deeper dive into candlesticks specifically, check out our detailed guide on how to read candlestick charts.
Decoding the Four Major Types of Doji Patterns
While the basic Doji signals a draw between buyers and sellers, not all moments of indecision are created equal. Different variations of this pattern tell a much more nuanced story about what’s really going on under the market’s hood.
Think of them as different kinds of pauses in a conversation. Some are thoughtful, some are tense, and others signal a complete change of topic. By learning to tell the four major types apart, you can get a much clearer picture of what the market is trying to tell you.
This infographic simplifies the core dynamic behind every Doji, showing how the tug-of-war between bulls and bears results in a stalemate.
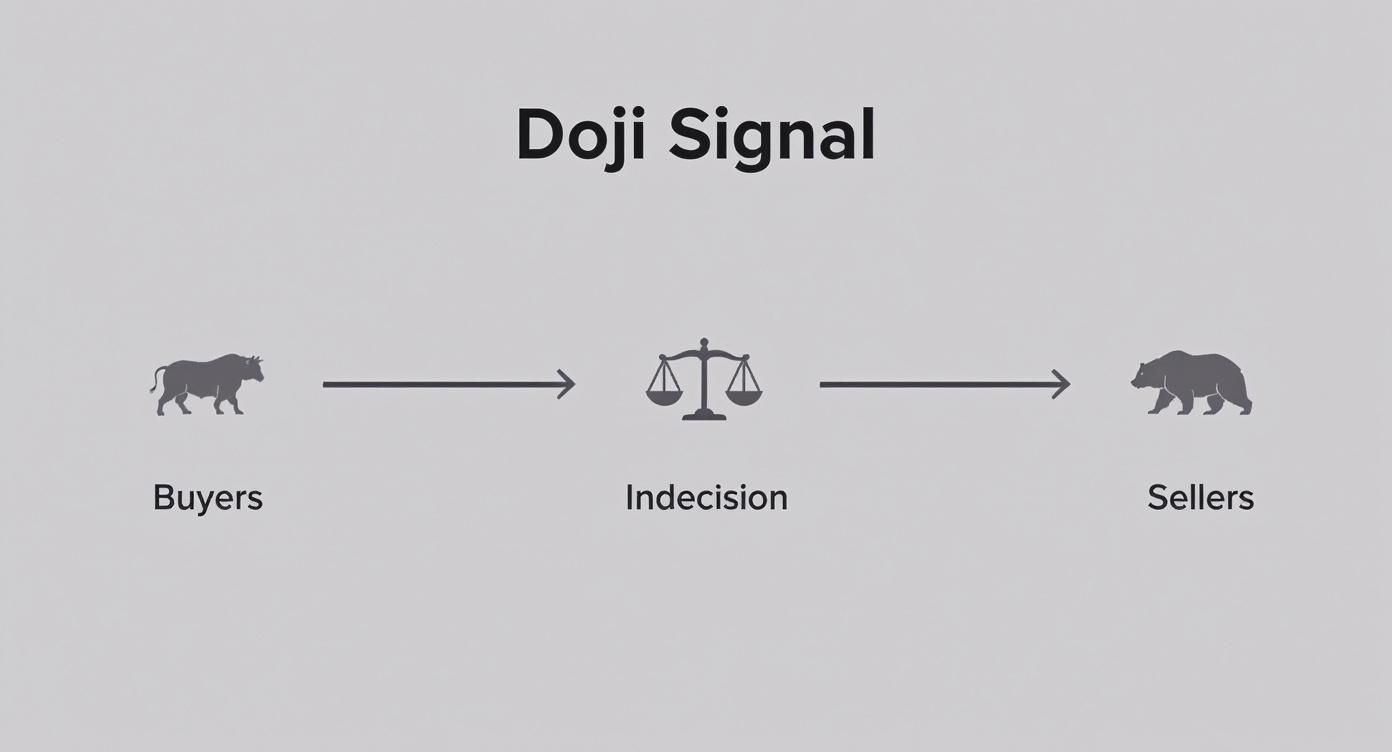
This visual drives home the point: a Doji represents an equilibrium where neither side can gain control, leading to a critical moment of market uncertainty.
The Standard Doji
The Standard Doji is the one you'll see most often. It looks like a simple plus sign or a cross, with relatively short and roughly equal upper and lower wicks. This pattern points to a straightforward moment of indecision.
Market forces reached a temporary balance without any wild price swings. It’s a classic sign that the prevailing trend might be losing steam, but you absolutely need confirmation from the next few candles before even thinking about a trade.
The Long-Legged Doji
Now for the dramatic sibling of the family: the Long-Legged Doji. This one features significantly longer upper and lower wicks, telling you the session was a battleground. Imagine the price soaring high, then plummeting low, only to end right back where it started.
This pattern screams heightened indecision and confusion. When it shows up after a strong trend, it’s a major red flag that the market is struggling to find direction. A potential reversal could be sharp and volatile. The longer the wicks, the greater the uncertainty.
Here’s the story it tells:
- High Volatility: The market went on a wild ride during the session.
- Strong Indecision: Despite the chaos, neither side could claim victory by the closing bell.
- Potential Reversal: It’s a powerful warning that the current trend is on very shaky ground.
The Dragonfly Doji
The Dragonfly Doji is a T-shaped candle with a long lower wick and practically no upper wick. Its name is a perfect fit, as it looks a lot like a dragonfly. This pattern tells a very specific story.
Sellers were in complete control at first, pushing the price way down. But then, out of nowhere, buyers staged a powerful rally, driving the price all the way back up to the opening level by the close.
When this appears at the bottom of a downtrend, it’s a distinctly bullish signal. It shows that intense selling pressure was absorbed and forcefully rejected. Buyers are stepping in with conviction. The longer that lower wick, the stronger the bullish reversal signal. It suggests a support level has held firm.
The Gravestone Doji
The Gravestone Doji is the mirror opposite of the Dragonfly and is a classic bearish reversal pattern. It looks like an upside-down "T"—a long upper wick with little to no lower wick.
This pattern forms when buyers push the price up significantly after the open, but their momentum completely fizzles out. Sellers then take over, slamming the price right back down to the opening level by the end of the session.
When a Gravestone Doji appears at the top of an uptrend, it's a massive warning sign for anyone who is long. It signals that buying pressure is exhausted and sellers are now overpowering the market. It’s the perfect picture of a failed rally. The doji candle meaning here is a crystal-clear signal of bearish rejection at a resistance level.
The Market Psychology Behind the Doji Pattern
To really understand what a Doji is telling you, you have to look past the chart and see the human story playing out. Every single candlestick represents a battle between buyers and sellers. The Doji is the perfect picture of a dramatic stalemate—a dead heat where neither side could claim victory.
Think of it as a snapshot of pure market indecision.
Imagine how a single trading session unfolds. The bulls, feeling optimistic, start pushing the price up. But as it climbs, sellers see an opportunity and start fighting back, shoving the price right back down. This intense tug-of-war carries on, with momentum shifting back and forth, until the bell rings and the price has settled almost exactly where it began.
A Story of Exhaustion
The real insight here is that a Doji often signals exhaustion. And where this stalemate happens is everything.
When a Doji appears after a long, sustained uptrend, it’s a whisper that the buyers are finally running out of gas. Their relentless push has been met with equal force, and you can almost feel their momentum fading.
On the flip side, a Doji at the bottom of a deep downtrend suggests the sellers are losing their grip. Despite all their efforts to drive the price lower, buyers managed to hold the line. This tells you the selling pressure is weakening. It’s a classic example of what is market psychology in action—reading the subtle shifts in sentiment.
A Doji is a pause in the market's narrative. It’s that critical moment when the dominant group—whether buyers or sellers—starts to show signs of weakness. That hesitation creates an opening for the other side to take control.
This pause is your cue to pay very close attention. It's not a signal to jump into a trade, but a warning that the prevailing trend is now in question. The balance of power might be about to shift, and the next few candles will likely tell you who won the fight.
Context Is Everything
One of the biggest mistakes traders make is ignoring the context of a Doji. If you spot one in the middle of a choppy, sideways market, it’s usually just noise. All it does is confirm the indecision that was already there.
Its true power is unlocked when it shows up at a key price level after a strong, directional move.
Let’s look at two scenarios:
- At the Top of an Uptrend: A Doji here points to bullish exhaustion. The upward momentum has hit a wall, and the trend could be ready to reverse.
- At the Bottom of a Downtrend: This signals bearish fatigue. The sellers couldn’t push the price any lower, hinting that a bullish reversal could be just around the corner.
Getting a feel for this psychological battle is what separates amateur chart-watchers from seasoned traders. You stop just identifying patterns and start interpreting what the market is actually trying to tell you.
How To Trade Doji Signals Effectively
Seeing a Doji pop up on your chart is a great start, but it's just that—a start. The real skill is turning that observation into a disciplined, profitable trade. Think of a Doji as a flashing yellow light at an intersection. It's telling you to slow down and pay attention, not to slam on the gas.
The single biggest mistake I see traders make is reacting to the Doji itself. Don't do it. The best approach, bar none, is to wait for confirmation from the candle that comes after the Doji. That next candle tells you who won the fight—the bulls or the bears.
Combining The Doji With Other Indicators
A lone Doji is interesting, but a Doji that shows up with friends is powerful. This idea is called confluence, and it’s all about finding multiple signals that point to the same outcome. It’s like getting a second and third opinion from trusted experts before you act.
Two of the best tools to pair with a Doji are the Relative Strength Index (RSI) and Moving Averages.
- Relative Strength Index (RSI): This is a momentum indicator that tells you if a market is getting overbought (usually a reading over 70) or oversold (below 30). A Gravestone Doji at the top of a rally is a good signal. But a Gravestone Doji appearing while the RSI is screaming "overbought" above 70? That's a high-probability setup you can't ignore.
- Moving Averages (MAs): MAs often act as dynamic areas of support and resistance. Picture a Dragonfly Doji forming right as the price taps a major moving average, like the 50-day or 200-day MA. That's the market confirming that a key support level is holding strong, adding serious weight to the bullish signal.
And this isn't just theory. A deep dive into global indices found that Doji patterns appearing in overbought or oversold conditions resulted in a trend reversal about 65% of the time within the next 5 to 10 trading days.
A Step-by-Step Trading Framework
Let's walk through a real-world example. Imagine you're looking at a bearish reversal signal from a Gravestone Doji at the peak of an uptrend.
Step 1: Identify the Setup
You've been watching a nice, clear uptrend, but you notice the momentum is starting to fade. Suddenly, a Gravestone Doji prints right at a known resistance level. You glance at your RSI and see it’s pushed above 70, flagging overbought conditions. This is the A+ setup you've been waiting for.
Step 2: Wait for Confirmation
This is where patience pays off. You don't enter a short position just yet. You wait for the next candle to close. If that candle is a big, ugly bearish bar that closes below the Doji's low, you've got your confirmation. The sellers have officially taken control.
Step 3: Plan Your Entry and Exit
Now that you have confirmation, you can plan your trade like a professional.
- Entry: Enter a short position near the close of that bearish confirmation candle.
- Stop-Loss: Place your stop-loss just a few pips above the high of the Gravestone Doji's long wick. This is your safety net if the reversal fizzles out.
- Profit Target: Set your take-profit at the next major support level down, or aim for a risk-to-reward ratio of at least 1:2.
Trading with a clear structure like this transforms gambling into a repeatable process. It's a fundamental lesson when you learn how to trade with price action, because it forces you to react to what the market is actually doing, not what you hope it will do.
Before putting real capital on the line, it's vital to have a solid plan for controlling risk exposures in foreign exchange. By always using a stop-loss, you define your maximum pain point before you even enter the trade. This single habit is a cornerstone of long-term survival in the markets.
To help you put this all together, here's a quick checklist to run through before you take a trade based on a Doji signal.
Doji Trading Confirmation Checklist
This table is designed to be a quick mental scan before you commit to a trade. Running through these points helps ensure you're acting on a high-quality signal, not just a random flicker on the chart.
| Checklist Item | Condition to Look For | Why It Matters |
|---|---|---|
| Clear Prior Trend? | Is there a defined uptrend or downtrend leading into the Doji? | A Doji signals a potential reversal or pause. It's most meaningful when it appears after a strong directional move. |
| Key Price Level? | Does the Doji form at a known support/resistance level, pivot point, or major moving average? | A Doji at a significant price level shows the battle between buyers and sellers is happening at a critical location. |
| Indicator Confluence? | Is the RSI overbought/oversold? Is there a divergence? Do other indicators confirm the signal? | Confluence increases the probability of the trade working out. It's like having multiple experts agree on a diagnosis. |
| Confirmation Candle? | Did the next candle close decisively in the direction of your intended trade (e.g., below a Gravestone Doji's low)? | This is the most crucial step. It confirms that one side has won the indecisive battle the Doji represented. Never trade without it. |
| Risk/Reward Defined? | Have you identified a logical spot for your stop-loss and a realistic profit target with at least a 1:2 ratio? | A good setup isn't a good trade unless the potential reward justifies the risk. This keeps your strategy profitable over the long run. |
By making this checklist a habit, you build the discipline needed to filter out low-probability setups and focus only on the trades that give you a genuine edge.
Common Mistakes to Avoid When Reading Dojis
I've seen it time and time again: understanding what a Doji candle really means is what separates disciplined traders from those who get burned by false signals. Many costly mistakes come from a few common, but totally fixable, misinterpretations of what this pattern is telling you.
Learning to sidestep these pitfalls is what turns that moment of market indecision into a real, profitable opportunity.

By far, the most damaging mistake is trading the Doji in isolation. A Doji isn't a green light to jump into a trade; it's a question mark. It's the market asking, "Is this trend running out of steam?"
Acting on a Doji the moment it appears, without waiting for the next candle to give you an answer, is pure gambling. You absolutely have to wait for a confirmation candle to see who won the battle.
Ignoring Market Context
Another classic error is failing to look at the bigger picture. A Doji that pops up in the middle of a choppy, sideways market is usually just noise. It doesn't tell you anything new—it just confirms the indecision that was already there. No edge in that.
The real power of a Doji is unlocked when it shows up after a strong, sustained trend. Its location—right at a peak or a trough—is what gives it predictive value. Context is everything.
For a Doji to be significant, it needs to signal a change in market sentiment. This change is most powerful when it happens at the end of a clear directional move, suggesting either the bulls or the bears are finally exhausted.
Disregarding Trading Volume
Finally, a lot of traders completely forget to check the volume that comes with the Doji. A genuine signal of indecision, a real tug-of-war between buyers and sellers, should ideally happen on significant volume.
- Low Volume Doji: This could just be a quiet day with not much going on. It's less of a standoff and more of a sign of general disinterest. I'd be wary of trusting it.
- High Volume Doji: Now this tells a story. It shows a fierce fight took place. High volume validates the indecision, making whatever happens next—a breakout or a breakdown—far more meaningful.
The Doji pattern has been a cornerstone of market analysis for centuries. Its rise in Western markets in the 1980s proved its universal appeal, but study after study shows it's a neutral signal that demands confirmation. If you want to dig deeper, there's some great information on the history and importance of the Doji candlestick pattern to enhance your knowledge. By sidestepping these common blunders, you can start reading its signals with much greater accuracy.
Frequently Asked Questions About Doji Candles
When you're staring at the charts, a lot of practical questions pop up about candlestick patterns. Let's tackle some of the most common ones I hear about the Doji so you can use this pattern with more confidence.
Is a Doji Always a Reversal Signal?
No, and getting this right is a game-changer. A Doji is primarily a signal of indecision, not a guaranteed reversal. It’s a huge clue that the current trend is running out of gas and taking a breather.
Think of it like a tug-of-war. A Doji at the top of a strong uptrend means the buyers and sellers pulled with equal force, ending in a draw. The reversal is only confirmed if the sellers come back and win the next round, which you'd see as a big bearish candle right after the Doji. Without that confirmation, it’s just a pause in the action.
Is a Doji Bullish or Bearish?
On its own, a Doji is completely neutral—it's the perfect picture of a stalemate. Whether it leans bullish or bearish depends entirely on where it shows up and what type it is.
- A Dragonfly Doji appearing at the bottom of a downtrend is a bullish sign. It shows that buyers stepped in and aggressively rejected lower prices.
- A Gravestone Doji at the peak of an uptrend is bearish. It tells you that sellers came in strong and slapped down a rally attempt.
The standard, cross-shaped Doji stays neutral until the next candle closes, revealing who finally won the fight.
Which Timeframe Is Best for Trading Dojis?
Doji patterns are much more reliable on higher timeframes, like the 4-hour, daily, or weekly charts. On the really short timeframes, like the 1-minute or 5-minute charts, you'll see Dojis all the time. Most of them are just market noise, not meaningful indecision.
A Doji on a daily chart represents an entire day of battle between bulls and bears. That carries a lot more weight than a pattern that formed in just a few minutes. Higher timeframes help filter out the random noise and show you the significant shifts in market sentiment.
What Is the Difference Between a Doji and a Spinning Top?
This is a really common point of confusion. Both patterns signal indecision, but the difference is all in the body. A Doji has a paper-thin body, or sometimes no body at all. This means the open and close prices were pretty much identical.
A Spinning Top, on the other hand, has a small but visible body. This tells you there was a small difference between the open and close, but it still shows that neither the bulls nor the bears could gain much ground. A Doji is just a more extreme—and often more powerful—signal of a complete stalemate.
Ready to stop guessing and start trading with a proven, straightforward strategy? At Colibri Trader, we teach you how to read price action directly from the charts, without relying on confusing indicators. Take our free Trading Potential Quiz and see how our action-based programs can help you achieve consistent results. Transform your trading today.