


Mastering Day Trading Candle Patterns
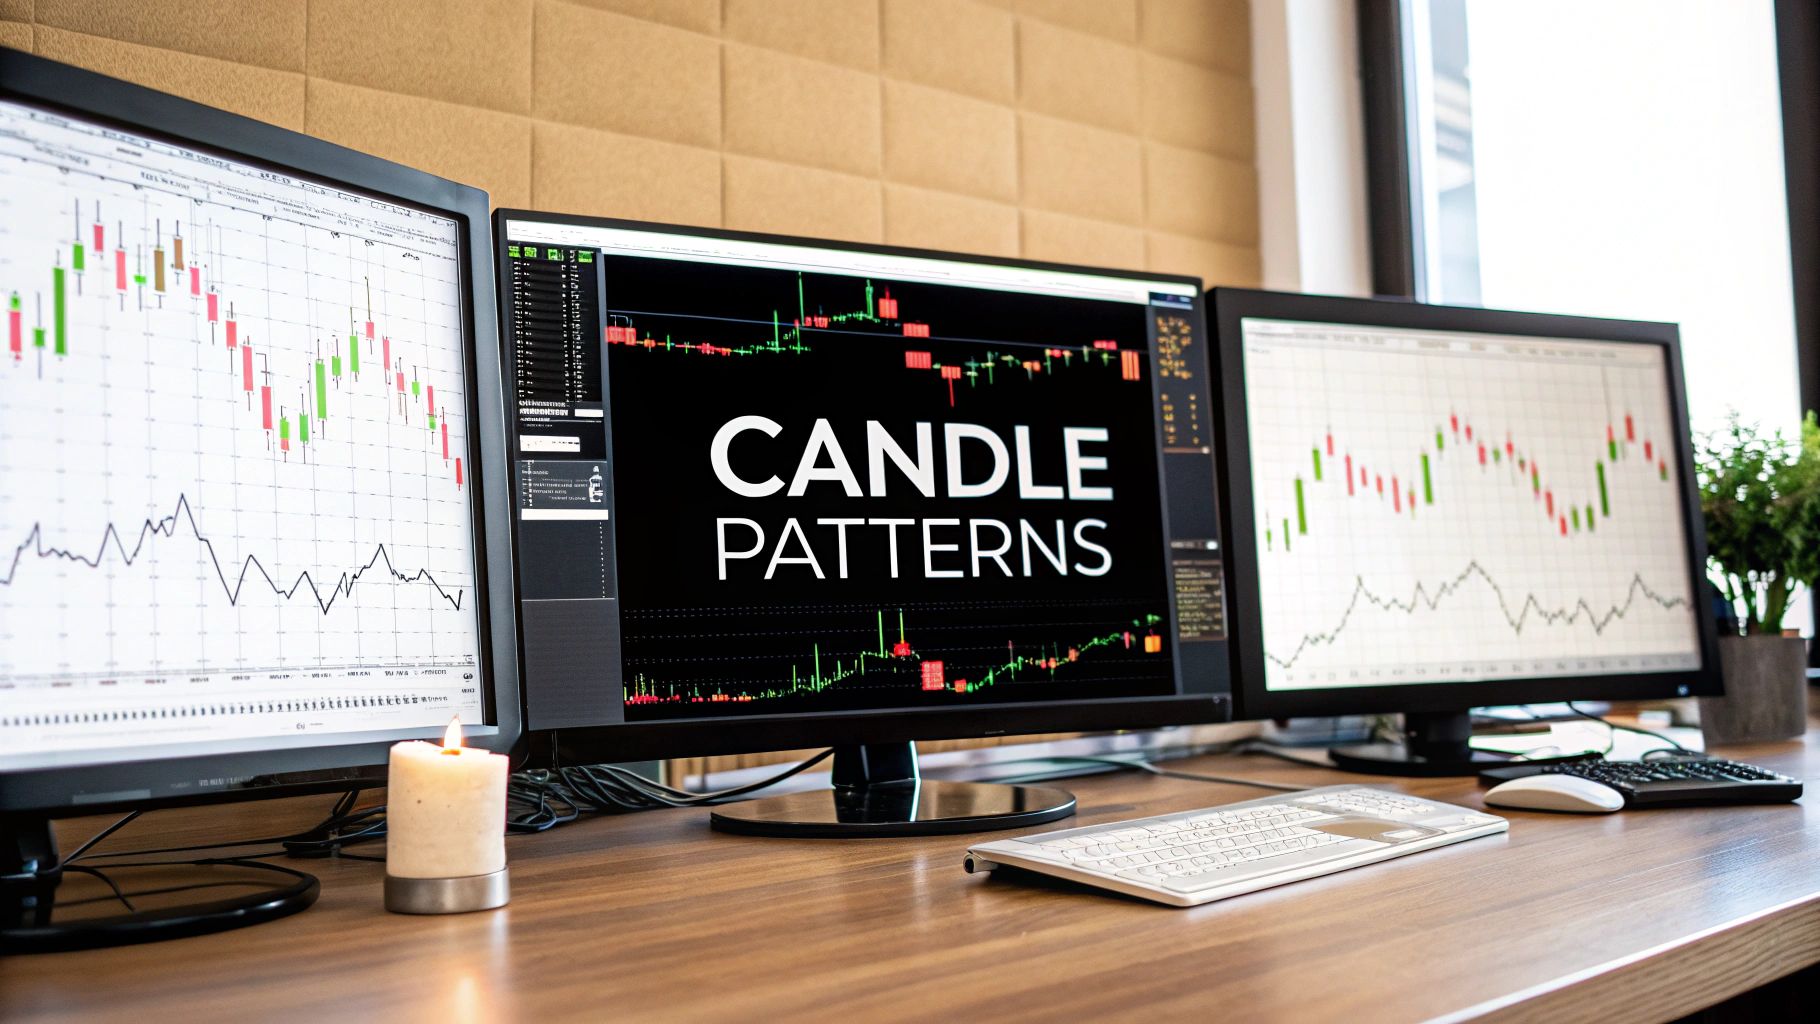
Day trading candle patterns are your window into the market's soul. They're visual stories, playing out in real-time, that show the constant tug-of-war between buyers and sellers. Learning to read these patterns is like learning a new language—one that can help you spot high-probability entry and exit points before they happen.
Learning the Language of Price Action
Welcome to the fast-paced world of day trading. Here, the market doesn't speak in numbers alone; it communicates through the language of candlesticks. Don't just see them as data points. Think of each candle as a miniature story about the ongoing battle between buyers (the bulls) and sellers (the bears).
Understanding this visual language is the first, most critical step toward making smarter trading decisions.
These simple shapes you see on a chart are built from just four key pieces of price information within a set timeframe, like one or five minutes: the open, high, low, and close. The way these points interact with each other is what gives each candle its unique shape and, more importantly, its meaning.
Decoding a Candlestick's Anatomy
To truly master day trading candle patterns, you have to start with the basics: the anatomy of a single candle. Every part offers a clue into the market psychology during that specific period.
- The Body: This is the thick, solid part of the candle. It shows you the distance between the opening and closing price. A long green (or white) body screams strong buying pressure. A long red (or black) body? That signals a seller's market.
- The Wicks (or Shadows): These are the thin lines sticking out from the top and bottom of the body. They mark the highest and lowest prices hit during that period, showing you the full range of the price battle. Long wicks are often a sign of volatility and indecision.
A candle's real story is told by the relationship between its body and wicks. A long lower wick, for example, tells you that sellers tried to push the price way down, but buyers stormed back in and drove it higher before the period closed. Bulls won that fight.
Before we get into complex patterns, it's worth taking a moment to internalize what each part of the candlestick tells us about the market's underlying psychology.
Quick Guide to Candlestick Anatomy
| Candlestick Component | What It Represents | Market Psychology Insight |
|---|---|---|
| Body Color | Direction of price movement (Green/White = Up, Red/Black = Down) | Shows who was in control: buyers or sellers. |
| Body Size | The strength of the price move between the open and close | A long body indicates strong conviction; a short body suggests indecision. |
| Upper Wick | The session's high relative to the closing (or opening) price | A long upper wick shows that buyers tried to push the price up but failed. |
| Lower Wick | The session's low relative to the closing (or opening) price | A long lower wick reveals that sellers tried to push the price down but were rejected. |
This fundamental knowledge is the alphabet for reading your charts. Before you can interpret patterns like the Hammer or the Engulfing, you need to be fluent in what each candle’s size, color, and wick length is telling you.
For a deeper dive into the basics, it's a great idea to spend time understanding candlestick charts and their core principles. Mastering this foundation is absolutely essential for spotting the subtle shifts in momentum that define successful day trading.
Identifying Bullish Reversal Patterns
Finding the precise moment when sellers lose their grip on a downtrend can boost your trading edge. Bullish reversal patterns act like a flare in the night sky—clear, unmistakable, and begging for attention. These formations aren’t mere chart ornaments; they narrate a battle where the bears exhaust themselves and the bulls take command.
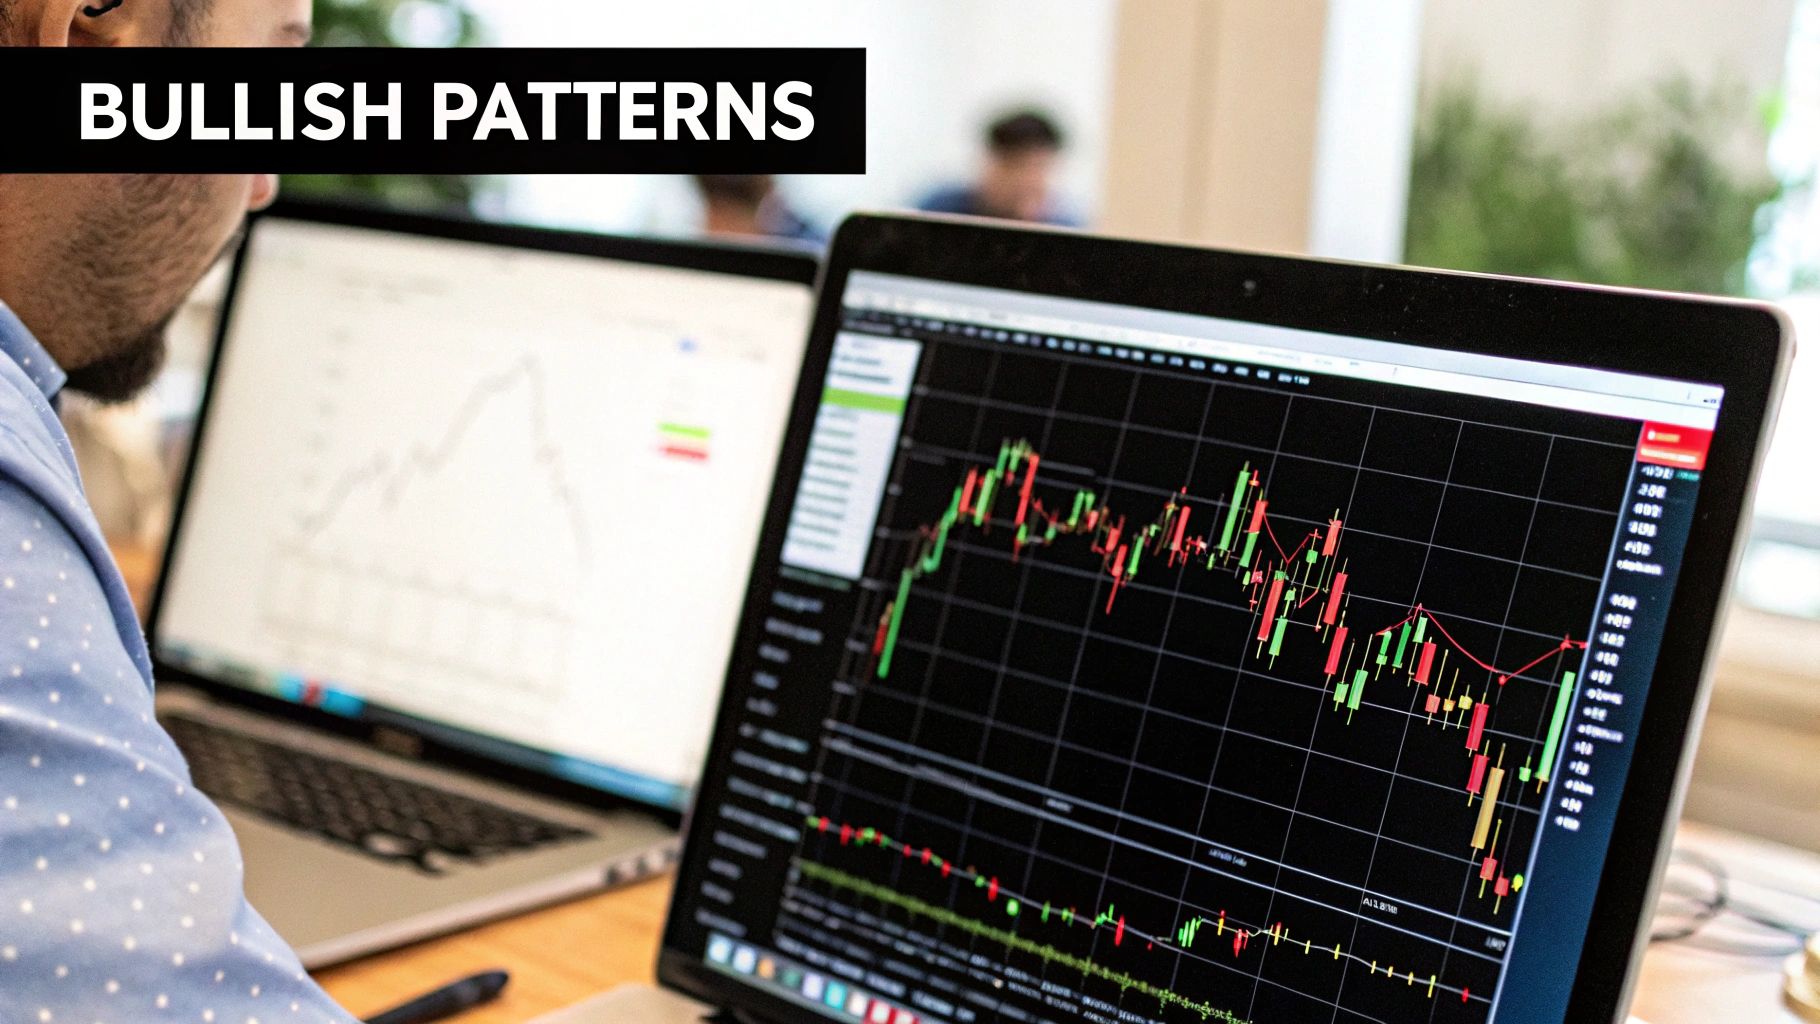
Two of the most dependable signals are the Hammer and the Morning Star. Peel back their layers, and you’ll see fear turning into opportunity—especially near strong support zones, where buyers lie in wait.
The Hammer: A Story Of Bullish Rejection
Picture this: sellers have driven prices lower all session long. Then, out of nowhere, the market dives again—only to be met by a fierce wave of buying. By the close, price sits back near its open, mocking the bears’ effort.
This drama unfolds in a single candlestick known as the Hammer.
- Small Body: Closes near its opening, signaling that bears couldn’t hold the lower ground.
- Long Lower Wick: At least twice the body’s length, this tail proves the intraday low was aggressively rejected.
- Minimal Upper Wick: Bulls stayed in control from the rejection point through to the close.
“The Hammer speaks volumes: bears gave it one last push and lost. Its long shadow is the bruise on their credibility.”
A deep dive into 16,000 days of S&P 500 data shows the Hammer—when paired with proper confirmation—predicts market bottoms at a rate well above chance. For the full study, check out the predictive power of candlestick patterns.
The Morning Star: A Three-Act Bullish Play
Unlike the single-bar revelation of a Hammer, the Morning Star plays out over three candles, much like a mini-drama:
- Act I – The Large Bearish Candle
Sellers open the show with conviction, extending the downtrend. - Act II – The Small Indecision Candle
A Doji or spinning top appears, marking a tug-of-war and signaling that bearish pressure is running out of steam. - Act III – The Large Bullish Candle
Buyers surge back, closing well into the body of Act I. Momentum flips, and the bulls have the final say.
This sequential handoff—bearish confidence to outright bullish resolve—makes the Morning Star one of the clearest reversal signals on any timeframe.
Practical Application For Day Traders
Spotting these patterns is only half the equation. Here’s a concise framework to trade them effectively:
- Context Is King
Look for formations at known support levels: prior lows, moving averages, pivot points. - Wait For Confirmation
For a Hammer, enter when the next candle closes above its high. For a Morning Star, price should hold above the midpoint of Act I. - Volume Speaks Volumes
A spike in volume on the Hammer or the third candle of the Morning Star adds credibility to the signal. - Define Your Risk
Place stops just below the pattern’s low—under the Hammer’s wick or the Morning Star’s Act II low.
For a deeper dive into trade management and pattern variations, explore our guide on Day Trading Candlestick Patterns.
Spotting Key Bearish Reversal Patterns
Just as a bullish reversal tells you it might be time to go long, a bearish pattern is a flashing red light warning you that an uptrend is losing gas. For day traders, catching these formations in real-time is how you protect your profits or even start planning a short entry.
Think of these patterns as a story unfolding on your chart—a story of buyers getting tired and sellers finally taking over. Learning to spot the subtle clues that buyers are losing their grip is a non-negotiable skill.
Two of the most dependable bearish day trading candle patterns you'll see are the Shooting Star and the Evening Star. Each one tells a different tale about a failed rally and a coming shift in who's in control of the market.
This chart gives you a close-up look at how a bearish pattern can signal that the price is about to head south.
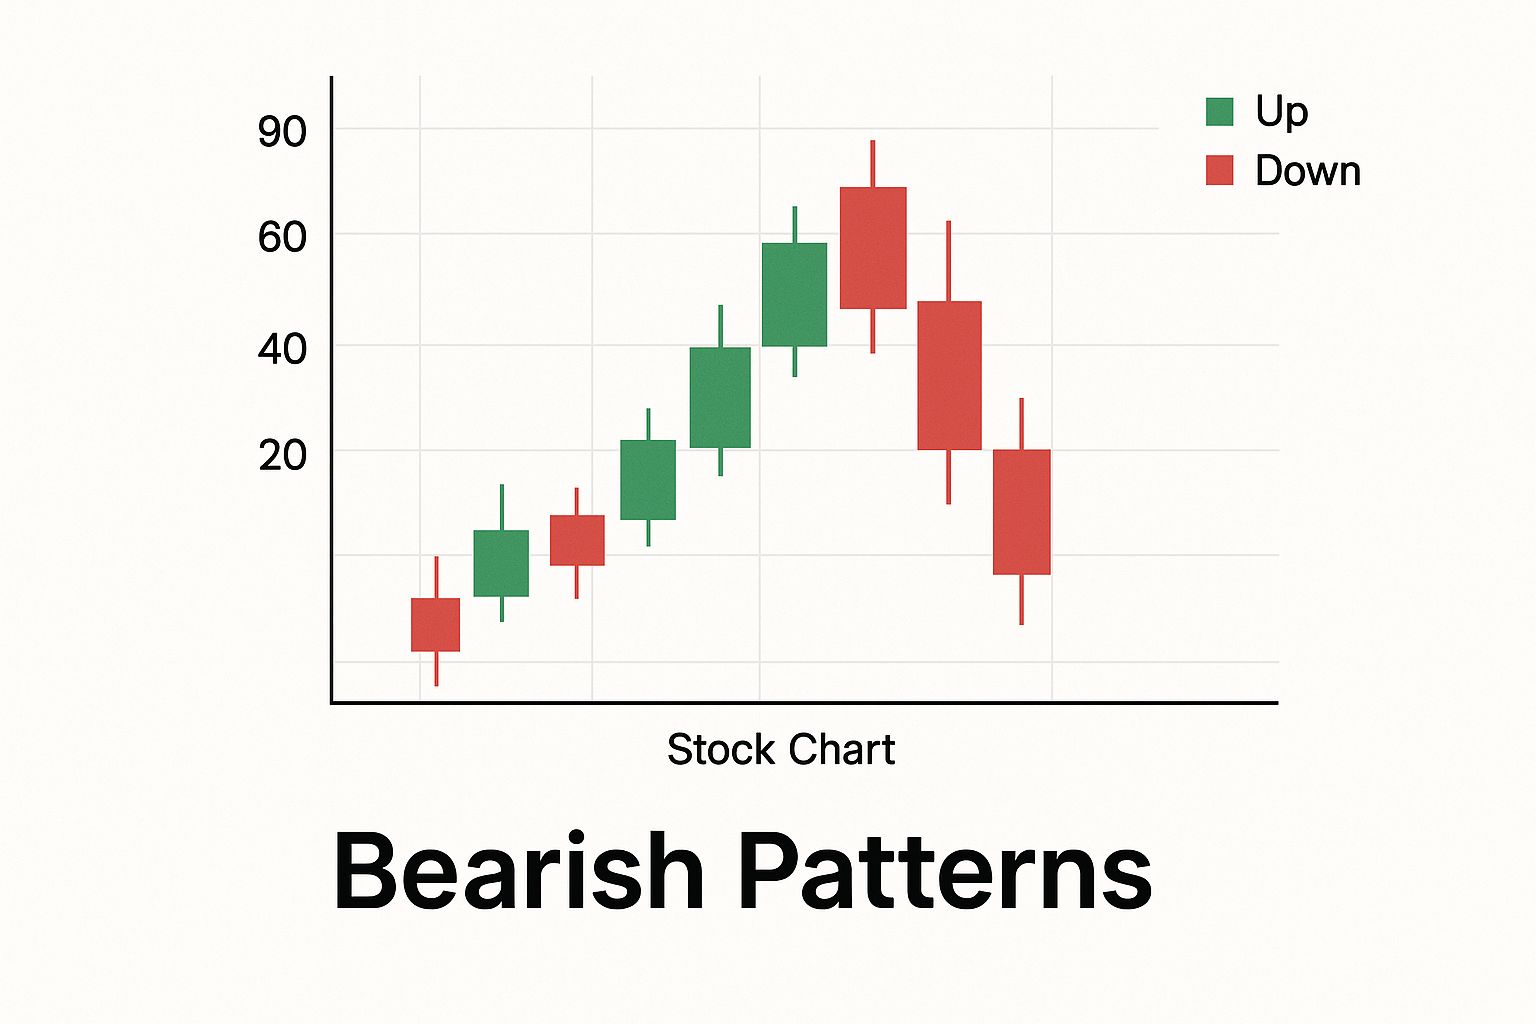
What you’re seeing here is a clear rejection of higher prices. That's a classic theme in any formation that warns of a market top.
The Shooting Star: A Failed Bullish Advance
Picture this: buyers are confidently pushing the price higher all session. They hit a new peak, feeling good, but then… they stumble. Sellers see their chance, flood the market, and slam the price right back down to where it started.
This entire drama, playing out in a single candle, is what we call a Shooting Star.
It's the mirror opposite of the bullish Hammer pattern and acts as a powerful signal that a top might be in. The anatomy of the candle itself reveals the psychological tug-of-war.
- Small Body: The candle’s close is very near its open. This shows that the impressive rally that happened during the session was completely wiped out by the end.
- Long Upper Wick: This is the most important part. The wick needs to be at least twice the length of the body, visually representing the high price level that bulls fought for but ultimately failed to defend.
- Minimal Lower Wick: There's little to no shadow below the body. Once the sellers took charge, they stayed in control right until the close.
A Shooting Star's long upper wick is like a monument to a failed bullish attack. It shows you the exact point where buying pressure vanished and sellers took decisive control.
This one candlestick tells a powerful story of rejection at a key price level. When it shows up after a strong run-up, especially near a known resistance zone, it’s a signal that every day trader needs to pay attention to.
The Evening Star: A Three-Step Bearish Takeover
While the Shooting Star is a quick, one-punch knockout, the Evening Star is more like a three-act play. It methodically shows a gradual power shift from buyers to sellers. This three-candle pattern gives you a much more detailed story of a market topping out.
- Act I – The Bullish Surge: The story begins with a strong, healthy bullish candle that continues the existing uptrend. At this stage, everything looks great for the buyers.
- Act II – The Peak of Indecision: The second candle is small—often a Doji or a spinning top—and it usually gaps up from the first one. This little candle is a huge sign that the buying momentum has hit a wall. The market is hesitating.
- Act III – The Bearish Confirmation: The final act is a strong bearish candle that closes deep into the body of the first bullish candle. This move confirms that sellers have wrestled control away from the buyers and the reversal is on.
The Evening Star is so well-respected because it doesn’t just show a single moment of rejection. It walks you through the entire process of an uptrend dying: from confidence to doubt, and finally, to a confirmed power shift.
To help you quickly tell the difference between bullish and bearish signals, here’s a simple breakdown of the most common reversal patterns.
Bullish vs. Bearish Reversal Patterns
| Pattern Type | Bullish Pattern | Psychological Signal (Bullish) | Bearish Pattern | Psychological Signal (Bearish) |
|---|---|---|---|---|
| Single-Candle | Hammer | Sellers tried to push price down but buyers regained control, signaling a potential bottom. | Shooting Star | Buyers tried to push price up but sellers took over, signaling a potential top. |
| Two-Candle | Bullish Engulfing | A strong buying day completely overtakes the previous selling day, showing a decisive shift. | Bearish Engulfing | A strong selling day completely overtakes the previous buying day, showing a decisive shift. |
| Three-Candle | Morning Star | A period of indecision is followed by a strong bullish move, confirming buyer control. | Evening Star | A period of indecision is followed by a strong bearish move, confirming seller control. |
This table serves as a quick reference, but remember that the real skill lies in interpreting these patterns within the broader market context.
How to Trade Bearish Reversal Patterns
Spotting one of these patterns is just the first step. To actually trade it, you need a solid plan. Simply seeing a bearish candle isn't enough—context and confirmation are everything.
- Location Matters: A Shooting Star or an Evening Star that forms right at a major resistance level, a daily pivot point, or a key moving average is infinitely more powerful than one that just pops up in the middle of a random price range.
- Seek Confirmation: Don't jump the gun. Always wait for the pattern to be fully formed. For a Shooting Star, a good entry signal is when the next candle trades below its low. For an Evening Star, the third candle is your confirmation.
- Manage Your Risk: Placing a stop-loss is straightforward. A logical spot is just above the high of the entire reversal pattern. That means placing it slightly above the long wick of the Shooting Star or above the high of the indecisive second candle in the Evening Star formation.
These patterns are an essential part of any price action trader's toolkit. To get a more complete picture, many traders benefit from learning about the full range of trading reversal patterns to build out their knowledge.
By combining these bearish signals with smart risk management and an awareness of market context, you'll be much better equipped to make a move when an uptrend starts showing signs of exhaustion.
Riding the Momentum with Continuation Patterns
Strong trends rarely rocket straight up or careen straight down. They move in waves. They push, pause to catch their breath, and then push again. These pauses are where continuation patterns show up, and they are a day trader's best friend.
Learning to spot these patterns is what separates a confident trader from a nervous one. It's the skill that helps you ride a winner without getting shaken out by meaningless noise. Even better, it gives you a lower-risk way to hop aboard a trend that's already moving.
Think of it like a climber scaling a mountain. They don't just sprint to the summit. They climb a pitch, find a solid ledge to rest and regroup (that's our consolidation), and then start the next leg of their climb. Continuation patterns are those ledges.
Reading The Doji: A Moment of Indecision
One of the most common signs that a trend is taking a breather is the Doji. This is a unique candle with a tiny (or even non-existent) body, meaning the open and close prices were almost identical. Its power comes from what it reveals about the market's psychology: a perfect stalemate.
After a big run up or down, a Doji tells you that the dominant side—be it the bulls or the bears—is running out of steam. The battle has ground to a halt.
- In an Uptrend: A Doji shows that the buying frenzy has cooled off, but sellers haven't managed to take over.
- In a Downtrend: It signals that sellers have eased up, but buyers aren't yet stepping in with any real conviction.
On its own, a Doji is neutral. Its location on the chart is what gives it meaning. When you see a Doji appear after a string of strong bullish candles, pay close attention. The trend isn't necessarily over, but it's thinking about what to do next.
A Doji is the market taking a deep breath. It's a sign of pure indecision where neither bulls nor bears could win the session. The very next candle often reveals who won the fight during that pause.
Flag Patterns: The Classic Consolidation Signal
Where a Doji shows a single moment of indecision, Flag patterns show a more structured period of consolidation. For an intraday trader, these are some of the most reliable continuation signals you'll find.
A Bull Flag forms in an uptrend. You'll see a sharp, almost vertical move up (the "flagpole"), followed by a small, downward-sloping rectangle or channel (the "flag"). This pattern isn't a sign of panic; it shows organized profit-taking before the next move higher. When the price breaks out of the top of that flag, the original trend often resumes with a vengeance.
A Bear Flag is the mirror image. It shows up in a downtrend after a steep drop. It looks like a weak, upward-drifting channel—a feeble bounce before sellers regain control and shove the price lower.
The trick to trading flags is patience. Don't jump the gun. Wait for a decisive breakout from the flag's channel, and make sure it's in the direction of the original trend. Keep an eye on your volume indicator—a breakout on a surge of volume is a much stronger confirmation that the trend is back on.
Why Context Is Everything
It’s critical to remember that no pattern exists in a vacuum. A pattern's reliability depends entirely on the market context around it. Even classic reversal patterns can act in funny ways if the overall trend is strong enough.
For example, the Morning Star is a well-known three-candle bullish reversal pattern. One analysis covering a decade of market data found it had a 65% success rate in calling bullish reversals. You can explore detailed findings on candlestick success rates to see how different patterns stack up.
This highlights a key point: while we're on the lookout for pauses like Flags and Dojis within a trend, we have to stay alert for powerful reversal signals that could flip the script. A continuation pattern is only valid until a stronger reversal pattern shows up and says otherwise. Context is king.
Building a Complete Trading Strategy with Candle Patterns
Spotting individual day trading candle patterns is a great start, but it's just one piece of the puzzle. A lonely Hammer candle floating in the middle of nowhere on your chart doesn't mean much.
But what about a Hammer that forms right at a major support level, bounces perfectly off a key moving average, and is backed by a huge spike in trading volume? Now that is a high-probability trade setup.
True trading mastery isn't about finding one perfect signal. It's about creating confluence—that sweet spot where multiple, separate signals all point to the same conclusion. Think of the candlestick pattern as the trigger, but the context is the whole battlefield. A solid strategy weaves these patterns into a complete system that tells you not just when to get in, but where to set your stop loss and when to cash out.
Combining Patterns with Key Price Levels
Where a pattern shows up is often more important than the pattern itself. Pro traders don't just trade patterns blindly; they wait for them to appear at significant price zones where the psychological battle between buyers and sellers is already heated.
These key levels are the natural lines in the sand for the market:
- Support and Resistance: A bullish engulfing pattern right on a known support level is a powerful sign. It shows that buyers are stepping in with force to defend that price.
- Moving Averages: A Shooting Star getting rejected hard from the 50-period moving average? That adds serious weight to the bearish signal.
- Pivot Points: Daily or weekly pivots act like magnets for price. Seeing a reversal pattern form right at one of these levels is a strong cue to pay attention.
When a pattern lines up with one of these zones, it stops being just a random candle and becomes a confirmation of a much larger market dynamic.
Integrating Volume for Confirmation
Volume is the fuel that powers a price move. A candlestick pattern shows you the price story, but volume tells you how much conviction is behind that story. A reversal pattern on weak, low volume is questionable at best. But that same pattern on high volume? That's a powerful statement from the market.
A bullish reversal pattern on a massive volume spike is the market shouting, not whispering. It signals that big players are backing the move, which dramatically increases the chance it will actually follow through.
Take a Morning Star pattern, for example. It's a strong signal on its own. But if that third, big bullish candle forms on the highest volume of the day, it adds a huge layer of credibility. This is your clue that institutional money is likely flooding in, validating the reversal and making it a much safer trade to take.
This multi-layered approach is what turns simple pattern spotting into a structured, high-probability trading plan. And as technology gets better, so does our ability to confirm these classic techniques. A fascinating 2025 study used neural networks to analyze historical candlestick data and achieved a predictive accuracy of up to 99.3% on its test set. You can dive into the research yourself in this machine learning and candlestick study to see how modern data science is backing up what savvy traders have known for decades.
Common Questions About Day Trading Candle Patterns
As you start working these powerful visual cues into your trading, a few questions always pop up. It's totally natural. Tackling these common questions head-on will build your confidence and help you get past the practical hurdles of using day trading candle patterns the right way.

Here are some clear, straight-to-the-point answers to what traders ask most when they're learning to read the charts.
What Is the Most Reliable Candlestick Pattern
There’s no single "best" pattern. Sorry to disappoint! The effectiveness of any pattern comes down to market context. That said, patterns that show a clear psychological battle, like Engulfing patterns, Hammers, and Morning Stars, are highly respected by seasoned traders.
Their reliability skyrockets when they show up at key support or resistance levels and are backed by a big spike in volume. The real goal isn't to find one magic pattern. It's to look for confluence—where multiple signals all point to the same outcome.
How Do I Avoid False Signals
Avoiding false signals is a game of patience and confirmation. This is critical: never act on a pattern until the candle has closed. An intraday move can look like a perfect Hammer, only to completely fall apart in the last few seconds of the candle.
Once the pattern is locked in, you need to look for confirmation from the next candle.
- For a bullish signal, the next candle should ideally be green and close higher.
- For a bearish signal, you want to see a red candle that closes lower.
And always, always look at the bigger picture. Does this little pattern make sense with the overall trend on a higher timeframe? Is it forming at a logical price level where you'd expect a reaction? Using other tools like moving averages or volume can help you filter out a ton of noise and avoid those frustrating fake-outs.
Think of candlestick patterns as the trigger, not the whole system. Their power is unlocked when you use them as an entry signal within a bigger trading plan that already defines market conditions, risk management, and how you’ll execute the trade.
Can I Trade Using Only Candlestick Patterns
While some highly experienced price-action traders do successfully trade on "naked" charts (charts with zero indicators), I wouldn't recommend that path for most people starting out. A much more durable and consistent strategy is to use candlestick patterns as one core piece of a complete trading plan.
Your plan needs to spell out the exact market conditions you'll trade in, your non-negotiable risk management rules, and how you’ll manage the trade once you're in. Candlesticks are great for telling you when to consider pulling the trigger, but your overall strategy tells you if the conditions are even right to be aiming in the first place.
At Colibri Trader, we teach a complete price-action approach that will change how you see the market. We'll help you move beyond just spotting patterns and learn to build a full-fledged trading strategy that can deliver consistent results. Discover your trading potential with us today.