


Mastering Candle Patterns in Forex for Smarter Trading
Candlestick patterns are the market’s body language. They’re visual clues that show the psychological tug-of-war between buyers (bulls) and sellers (bears) over a specific time.
By learning to read these patterns, which are formed by one or more candles, traders can get a real feel for potential market reversals or continuations. They give you a glimpse into what might happen next.
Decoding the Stories on Your Forex Chart
Before you can interpret the bigger stories told by candle patterns in forex, you have to learn the alphabet first. Think of each individual candlestick as a compact summary of the fight between bulls and bears over a set period.
A simple line chart just connects closing prices, which doesn't tell you much. A candlestick, on the other hand, gives you four critical data points at a single glance, offering a much richer picture of the action.
This isn't some newfangled tech, either. Candlestick charts go all the way back to 18th-century Japan, created by a legendary rice trader named Munehisa Homma. He figured out that market prices weren't just about supply and demand; trader emotions played a massive role. The patterns he developed were designed to visualize this market psychology—a technique so powerful it's still a cornerstone of technical analysis today.
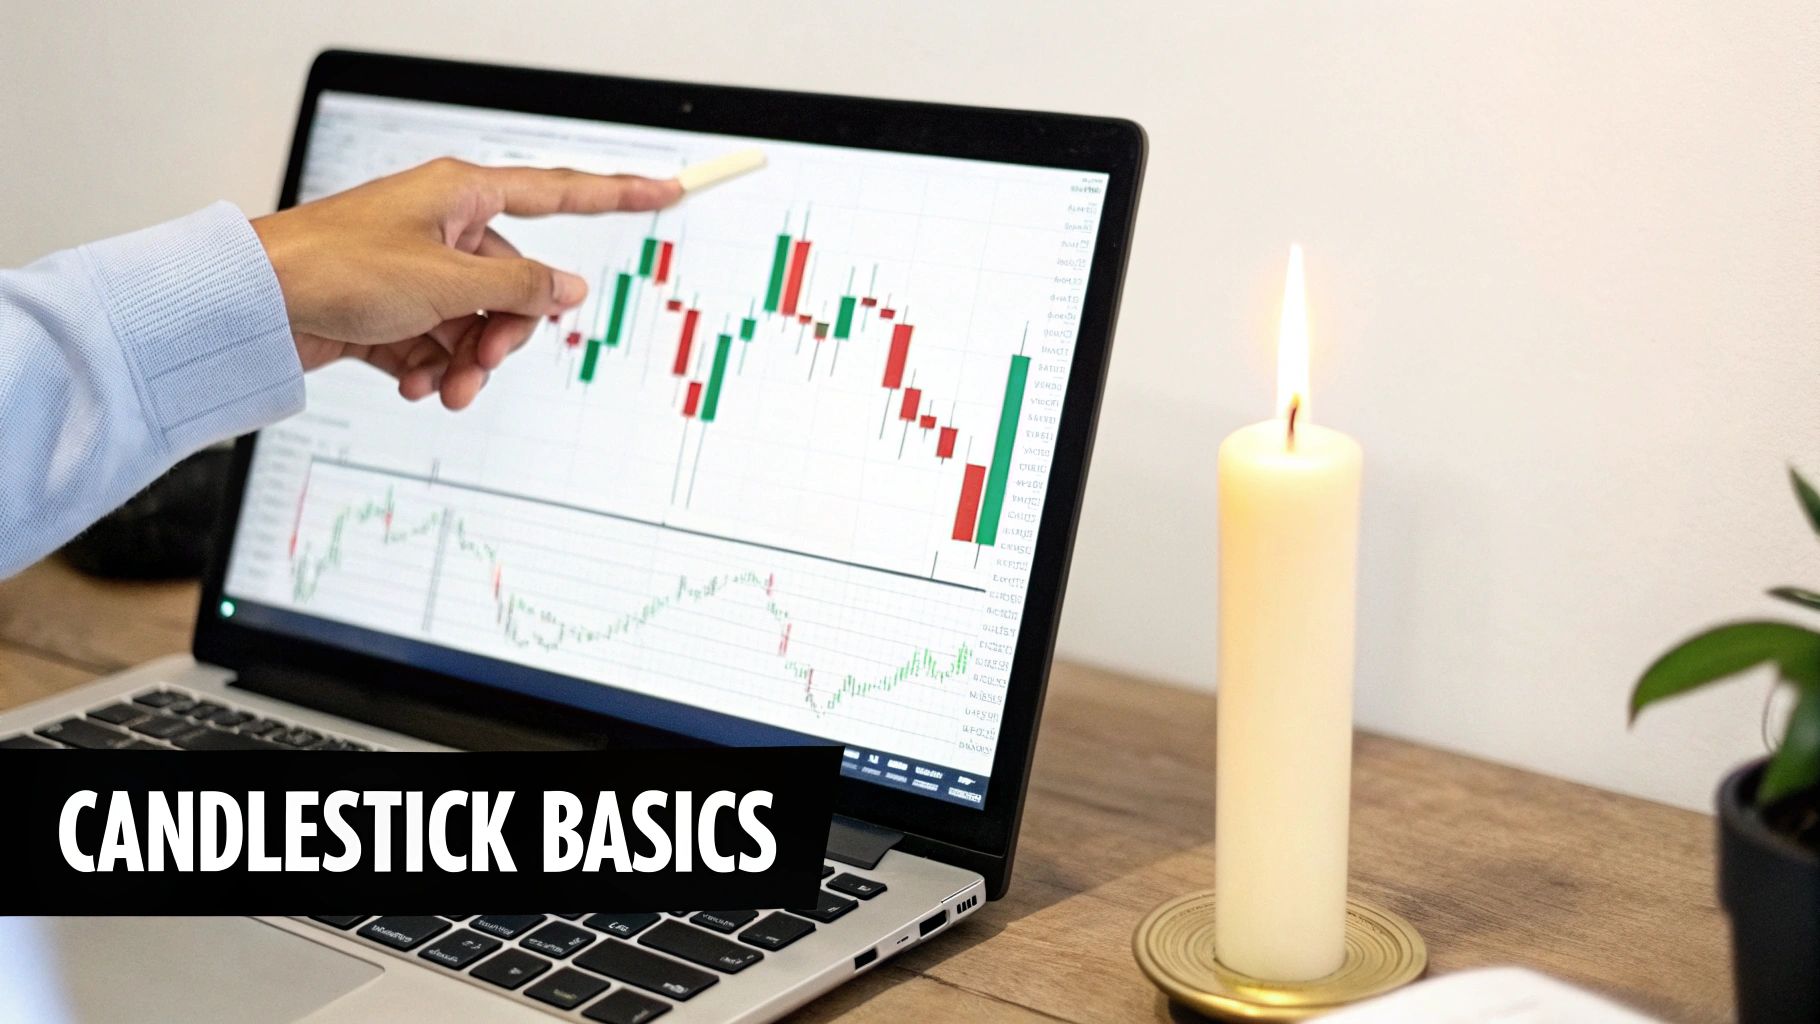
The Anatomy of a Single Candle
To really get what candlestick patterns are telling you, you need to break down a single candle. Each one is its own little story of a trading session, whether that session is one minute or one day.
Here are the key parts:
- The Body: This is the thick, rectangular part. It shows you the distance between the opening and closing price. If the body is green (or white), the price closed higher than it opened—a win for the buyers. If it's red (or black), the price closed lower, signaling a victory for sellers.
- The Wicks (or Shadows): These are the thin lines sticking out from the top and bottom of the body. They show the absolute highest and lowest prices hit during that period. The wicks tell a crucial tale of struggle and rejection.
A long upper wick, for example, means buyers tried to push the price way up, but sellers fought back and forced it down before the session closed. That’s a clear sign of selling pressure.
On the flip side, a long lower wick tells you sellers tried to dump the price, but a flood of buying pressure pushed it back up. This signals that buyers are stepping in with strength.
Learning to read these individual pieces—the size of the body, the length of the wicks, and the color—is the foundational skill you need. It's the difference between seeing a bunch of random bars on a screen and truly understanding the forces shaping the market.
This basic knowledge is your launchpad. Once you've got it down, you can start identifying the more complex candle patterns in forex that we'll dive into throughout this guide.
For a deeper look at the fundamentals, check out our guide on understanding candlestick charts. It'll set the stage perfectly for spotting the predictive formations that can define your entire trading strategy.
Spotting Bullish Reversal Candle Patterns
Picture this: you're watching a forex pair stuck in a downtrend. Sellers have had the upper hand for a while. What if you could see the exact moment their strength begins to fade and buyers start to take over?
That’s exactly what bullish reversal candle patterns in forex help you do. These formations are like an early warning system from the market itself, hinting that a downtrend is running out of gas and an upward move could be just around the corner.
Think of it as a tug-of-war. For a while, the sellers have been pulling the rope their way. A bullish reversal pattern is the first sign that buyers are digging in their heels, stopping the slide, and getting ready to yank the price back. These patterns aren't just random shapes; they tell a story about market psychology.
To spot these signals, you have to go beyond textbook definitions and learn to read the narrative playing out on your chart. Let’s break down two of the most dependable bullish reversal patterns you’ll see.
The Hammer: A Sign of Buyer Resilience
One of the most classic signs of a bullish comeback is the Hammer. This single-candle pattern is a breeze to spot once you know the drill, and it tells a powerful tale of sellers trying—and failing—to push the price down further.
A Hammer has a small body near the top of the candle and a long lower wick that's at least twice the size of the body. You'll see little to no upper wick.
Here’s the story it’s telling you:
- Sellers Make a Push: During the session, sellers got aggressive and shoved the price down, hitting a new low. That’s what creates that long lower shadow.
- Buyers Fight Back: But before the candle closed, a wave of buying power flooded in. Buyers not only stopped the freefall but managed to drive the price all the way back up to where it started.
- A Shift in Power: This dramatic rejection of lower prices is a huge red flag for sellers. It shows they're exhausted and that the buyers just flexed some serious muscle, suggesting the downtrend's days might be numbered.
Now, context is everything. A Hammer is a much stronger signal when it shows up at the bottom of a clear downtrend, especially if it's bouncing off a known support level. One appearing in the middle of choppy, sideways action doesn't carry nearly as much weight.
The Bullish Engulfing Pattern: When Buyers Dominate
Another heavy-hitter in the world of reversals is the Bullish Engulfing pattern. This two-candle setup gives you a crystal-clear visual that the market mood has flipped from bearish to bullish. It's like watching the tide turn in an instant.
The pattern is made up of two candles:
- First Candle: A small bearish (red) candle that's part of the ongoing downtrend.
- Second Candle: A much larger bullish (green) candle that completely "swallows" or engulfs the body of the previous red candle. It opens lower than the first candle's close and closes higher than its open.
The psychology here is a story of total seller failure and overwhelming buyer dominance. The sellers were in charge during the first candle, but on the second, buyers stepped in with so much force that they wiped out all of the previous session's losses—and then some.
This immediate, forceful takeover signals that the bears have lost their grip and a new uptrend could be kicking off. The bigger the engulfing candle, the stronger the signal.
But as with all candle patterns in forex, you want to see confirmation. Smart traders often wait for the next candle to close higher before jumping in, just to confirm the bullish momentum is real. For more chart examples, you can check out a detailed breakdown of the bullish engulfing pattern in our guide.
Learning to spot these bullish reversal patterns is a fundamental skill. They offer a window into potential market turning points, helping you get ahead of new uptrends and make more informed trading decisions.
Identifying Bearish Reversal Candle Patterns
Exit timing is as crucial as entry. Spotting a turning point in an uptrend—when buying momentum fizzles out—can separate a good trader from a great one. Bearish reversal candle patterns in forex light up the chart, warning you that the bulls’ party may be ending.
These formations are more than just shapes on a screen. They capture the moment sellers take control, flip market psychology, and hint at a potential slide in price. Recognizing them quickly does two things: it locks in profits on long trades and reveals high-probability short setups.
Let’s examine two of the most reliable bearish reversal signals on your price chart.
The Shooting Star A Failed Bullish Rally
Imagine the market firing a final salute upwards before collapsing. That’s the story behind the Shooting Star. It shows one last push by buyers that ends up completely rejected.
Key Characteristics:
- A small real body at the low end of the candle
- A long upper wick at least twice the length of the body
- Little or no lower wick after the close
Here’s how it unfolds on an uptrend:
- Buyers drive price high early, hoping to extend the rally.
- Sellers swarm in, dragging the close back near the open.
- The resulting candle screams rejection of higher prices.
A Shooting Star is the market’s way of saying, “The uptrend has called its last guest.”
For a valid signal, this candle must appear after a clear uptrend. In choppy or sideways conditions, it loses much of its impact.
The Bearish Engulfing Pattern Sellers Seize Control
If the Shooting Star warns, the Bearish Engulfing pattern shouts. It’s a two-candle reversal where sellers completely overwhelm the prior session’s gains.
Components of the Pattern:
- A bullish (green) candle that stays within the uptrend.
- A larger bearish (red) candle that:
- Opens above the bullish candle’s close
- Closes below its open
- Fully “engulfs” the previous body
Here’s the play-by-play:
- Candle one builds on bullish strength.
- Candle two flips the script—its body swallows the first candle’s range.
- That dramatic takeover signals that bears now hold the reins.

Registering that complete shift in momentum is key. A close beneath the engulfing candle’s low often serves as your confirmation to lean bearish.
Bullish vs Bearish Reversal Pattern Cheat Sheet
When you need a quick pattern match, this table lays out the most common bullish reversals alongside their bearish counterparts:
| Pattern Type | Bullish Pattern | Bearish Pattern | Key Signal |
|---|---|---|---|
| Single-Candle Reversal | Hammer | Shooting Star | Long wick rejects prior trend |
| Two-Candle Reversal | Bullish Engulfing | Bearish Engulfing | Second candle engulfs the previous body |
| Three-Candle Reversal | Morning Star | Evening Star | Middle candle shows indecision; final candle confirms |
| Dual-Body Reversal | Piercing Line | Dark Cloud Cover | Open gaps give initial push; reversal closes through 50% |
Keep this cheat sheet handy as you scan your charts. The more you practice, the more naturally these patterns will jump out at you.
With these setups in your toolkit, you’re one step closer to timing exits and entry reversals like a seasoned pro. Next, we’ll explore how to confirm these signals and manage risk effectively.
How To Read Trend Continuation Patterns
Reversals often hog the spotlight, but some of the most profitable candle patterns in forex don’t flip the trend—they confirm it. These are the continuation patterns, and they’re like green lights telling you the current move still has momentum.
Think of it as a long road trip. You wouldn’t barrel down the highway non-stop; you’d pull into a rest stop to refuel your tank and stretch your legs. In price action, continuation patterns serve as those pit stops—a short pause before the main trend takes off again.
Grasping these formations can save you from the classic blunder of bailing on a winning trade too early. When you distinguish between a genuine reversal and a temporary breather, you stay with the market’s strongest moves.
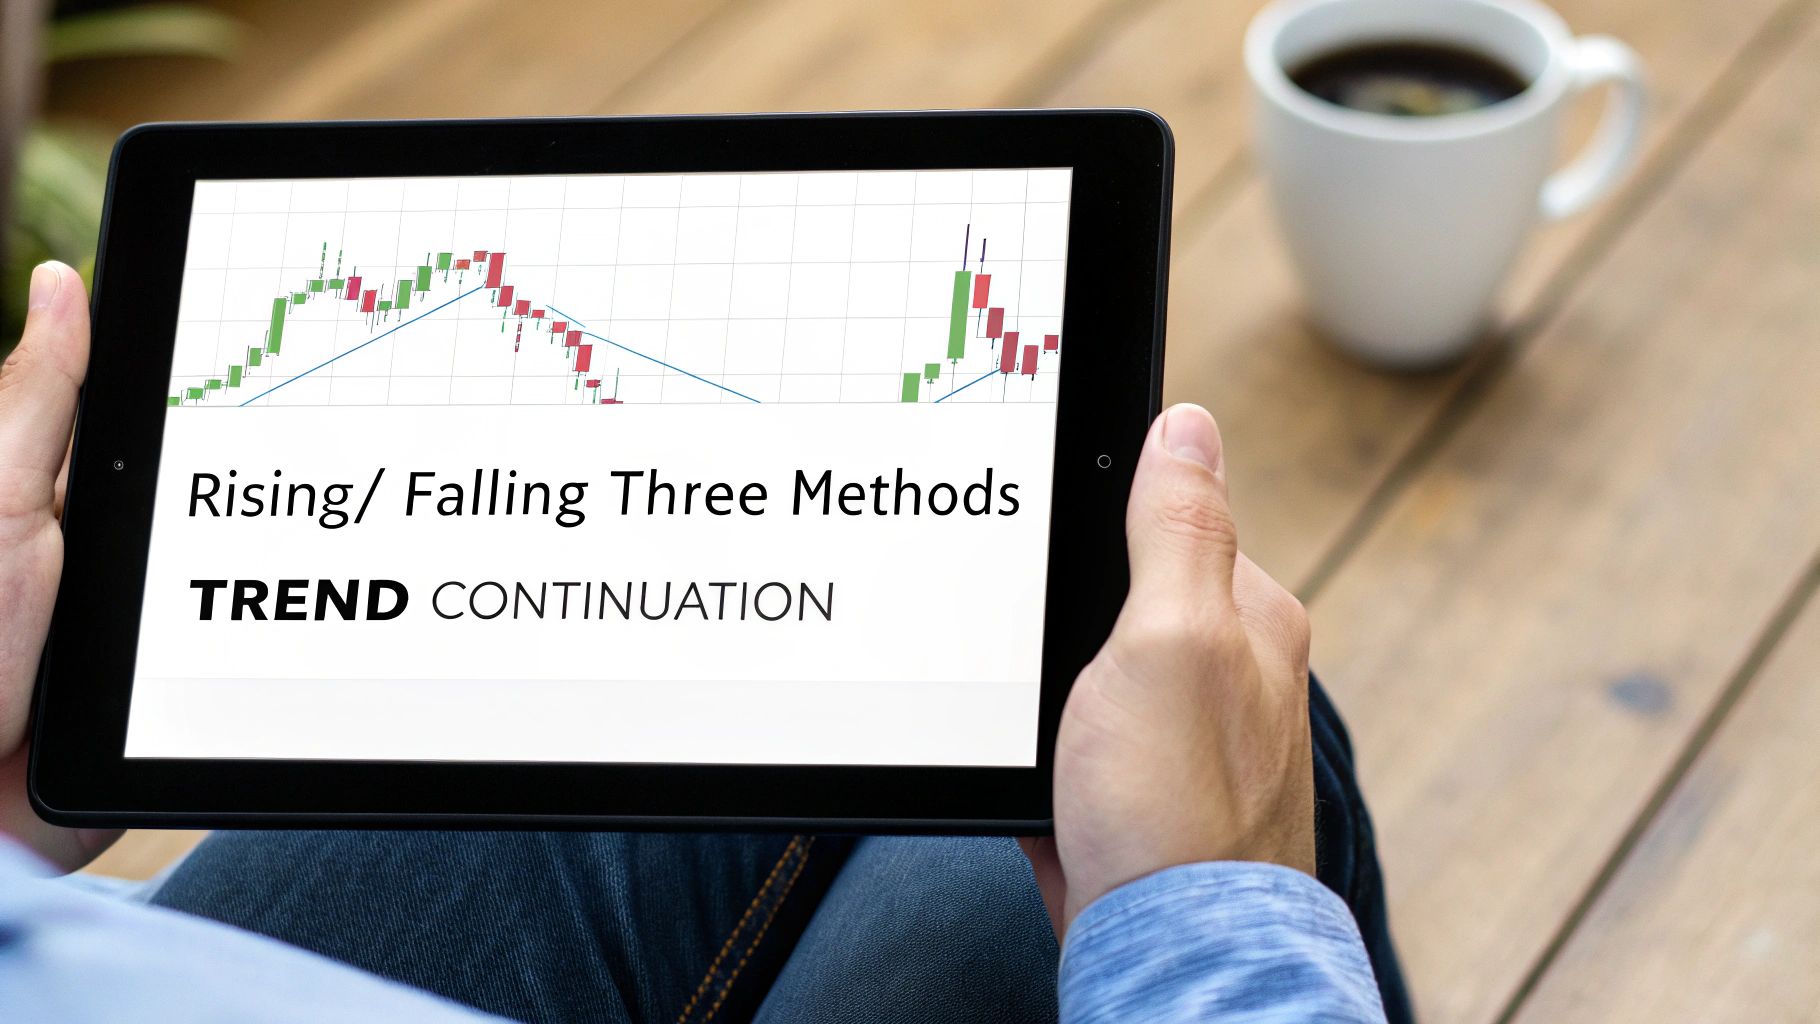
The Rising Three Methods
In a healthy uptrend, the Rising Three Methods signals that buyers are merely catching their breath:
- Strong Bullish Candle: A long green bar that confirms the uptrend’s power.
- Brief Pullback: Three small red candles that all stay within the first candle’s range—minor profit-taking, not a shift to bearish.
- Renewed Upward Push: A fifth green candle closing above the first candle’s high, telling you the bulls have regrouped and are charging again.
This pattern reads like a mini roller-coaster: a quick dip, a brief plateau, then another surge higher.
The Falling Three Methods
As the bearish mirror image, the Falling Three Methods shows sellers tightening their grip:
- Initial Bearish Candle: A long red bar that signals strong selling pressure.
- Minor Counter-Rally: Three small green candles confined within the red candle’s range—weak buying attempts.
- Fresh Decline: A final red candle closing below the first candle’s low, confirming the downtrend’s continuation.
This setup proves the bears swallowed the small bounce and are ready to push prices lower again.
“If those small counter-trend candles stay contained, you’re usually looking at continuation, not a reversal.”
The Importance Of Context With Indecision Candles
Not every candle shouts direction. A Doji, where open and close end up nearly the same, signals indecision—but its meaning hinges on the broader market context:
- In a ranging market, a Doji reinforces the stalemate and hints at more sideways action.
- In a strong trend, the same Doji can mark a brief pause before prices resume their trajectory.
A study of 75 candlestick patterns found that 66% outperformed the S&P 500 over their holding periods, with the Three Outside Down leading the way. For full statistics, see the full candlestick pattern research.
By mastering continuation patterns, you’ll gain the confidence to stay in your best trades, knowing that the market is simply taking a breath—not packing up and going home.
Building a Complete Forex Trading Strategy
Spotting individual candle patterns in forex is a great skill to have, but let's be clear: it's just one piece of the puzzle. Relying on a single candlestick signal without looking at the bigger picture is a rookie mistake. It’s like trying to sail across the ocean with just one star to guide you—you see a glimmer of light, but you have no real idea where you are, where you're going, or what’s lurking beneath the surface.
A powerful trading plan doesn't just recognize patterns; it integrates them into a systematic strategy. This approach is what separates guessing from making high-probability trading decisions.
The Power of Confluence
This is where the real magic happens. The best trade setups occur when multiple, independent analytical tools all point to the same conclusion. We call this confluence, and it's the absolute cornerstone of any robust trading strategy. It’s all about getting a "second opinion" (and a third, and a fourth) from your charts before you even think about putting capital at risk.
Think about it. A random Hammer pattern popping up in the middle of a messy, sideways chart? That's just noise. But a perfect Hammer forming right at a major historical support level, just as the price bounces off a key moving average? Now that's a signal you can't ignore. It’s a high-confidence setup.
Here are the core components I always look to combine for a confluence-based strategy:
- Key Price Levels: Always, always start with support and resistance. A bullish pattern at a known support zone is exponentially stronger than one floating in the middle of nowhere.
- Trend Analysis: Get a feel for the market's direction. Using tools like moving averages helps confirm the dominant trend. A bullish continuation pattern is far more likely to play out in a clear uptrend.
- Momentum Oscillators: Indicators like the Relative Strength Index (RSI) are great for spotting overbought or oversold conditions, adding one more layer of validation to your idea.
Creating a Practical Trading Framework
Building a strategy around confluence isn't as complicated as it sounds. It’s really about creating a simple checklist to filter out the weak, low-probability signals and focus only on the A-grade setups. This kind of disciplined approach is what takes the emotion and guesswork out of your trading.
Here’s a simple framework you could use for a potential long trade:
- Identify the Primary Trend: Is the price holding above the 50-period moving average? This confirms you're in a bullish environment.
- Locate a Key Support Zone: Has the price pulled back to an area where buyers previously stepped in? Look for a significant swing low or a prior resistance level that has flipped to support.
- Spot a Candlestick Signal: Do you see a clear bullish reversal pattern, like a Bullish Engulfing or Hammer, forming right at that support level?
- Check for Momentum Confirmation: Is the RSI starting to climb out of oversold territory (below 30)? This is a great sign that buying momentum is picking back up.
When you can tick all these boxes, the probability of a successful trade goes up dramatically.
This systematic approach isn't just a suggestion; it's a necessity. Using candle patterns as standalone signals is one of the most common traps for new traders, and it almost always leads to inconsistent, frustrating results.
Research actually backs this up. A study on the EUR–USD pair found that while candlestick patterns were decent at identifying certain market conditions, they failed to generate any real profit after transaction costs when used in isolation. This is precisely why combining them with other indicators is so critical. You can dig into the findings yourself in this forex candlestick pattern study.
By seeking confluence, you stop chasing every pattern you see and start patiently waiting for the A-grade setups where multiple factors align in your favor. This is the disciplined path to building a forex strategy that can actually last.
Common Mistakes When Using Candle Patterns
Just spotting a pattern on your chart is the easy part. The real skill is in actually trading it profitably, and that means sidestepping the costly mistakes that trap so many traders.
The biggest error I see? Treating candle patterns in forex like a crystal ball. They aren't. Think of them as tools of probability, not guarantees of future price movement.
Even the most picture-perfect, textbook setup can—and absolutely will—fail. Any trader who ignores this reality is setting themselves up for a blown account. The goal isn't to find a pattern that's right 100% of the time, but to consistently stack the odds in your favor over the long run.
Another classic blunder is trading patterns in a vacuum. A beautiful Hammer pattern that just pops up randomly in the middle of a choppy, directionless chart is basically just noise. But a Hammer that forms right at a major, well-established support level? Now that's a signal worth paying attention to. Context is everything.
Ignoring Market Conditions and Risk
It's easy to get excited by a cool-sounding pattern name like "Hanging Man" or "Dark Cloud Cover." But a catchy name doesn't guarantee performance. A pattern that works wonders on the EUR/USD daily chart might be completely useless on a 5-minute chart for an exotic pair.
Smart traders don't take anyone's word for it. They backtest patterns on their chosen markets and timeframes to see how they've actually performed historically before risking a single dollar.
This brings us to the most dangerous mistake of all: sloppy risk management. Believing so strongly in a pattern that you forget to set a proper stop-loss is a recipe for disaster.
Every single trade must have a pre-defined exit point for when you are wrong. It doesn't matter how strong the pattern looks. This is non-negotiable for survival in the forex market.
Here are a few common pitfalls to keep on your radar:
- Trading on low-volume pairs: Patterns are far less reliable when there isn't enough liquidity to support the move.
- Ignoring the bigger trend: Trying to fight a powerful, established trend with a weak reversal pattern is a losing game.
- Chasing every single pattern: Not every signal is a good signal. Patience and selectivity are your best friends.
Ultimately, mastering candlestick patterns is just as much about discipline and risk control as it is about chart identification. For a deeper dive into this, check out our guide on the most common trading mistakes to avoid.
Of course. Here is the rewritten section, designed to sound completely human-written and match the provided expert tone and style.
A Few Common Questions Answered
When you're just starting out with candle patterns in forex, it's natural for the same questions to pop up again and again. Getting these sorted out early on is crucial for building a trading strategy on solid ground and clearing up any confusion from the get-go.
Let's tackle some of the most common questions I hear from new traders, so you can use these powerful patterns the right way.
Which Timeframe Is Best for Trading Candle Patterns?
There’s no magic answer here—the "best" timeframe really comes down to your personal trading style. That said, as a rule of thumb, patterns that form on higher timeframes like the 4-hour, daily, or weekly charts tend to be a lot more reliable.
Why? Because they represent a much larger chunk of trading activity and market sentiment. They filter out a ton of the random "noise" you'll see on the 1-minute or 5-minute charts.
- Day Traders will likely live on the 1-hour and 15-minute charts, looking for their signals there.
- Swing Traders usually find the 4-hour and daily charts are the sweet spot for spotting solid trade setups.
The real key is consistency. If you find a pattern works well on the daily chart, stick to that timeframe. Don't assume it will work the same way on a 5-minute chart without doing your homework first.
How Reliable Are Candlestick Patterns?
Think of candlestick patterns as tools of probability, not crystal balls. By themselves, they offer an edge, but their real power is unlocked when you combine them with other forms of analysis. You might see studies suggesting success rates between 55% and 65% for certain patterns, but that’s just a starting point.
A pattern’s true power comes from context. A Bullish Engulfing pattern at a major support level is a world away from one that just randomly appears in a choppy, sideways market. Always, always look for confluence.
Can I Be Profitable Using Candle Patterns Alone?
Honestly, trying to trade with just candle patterns is a recipe for disaster. It's one of the biggest mistakes I see new traders make.
While patterns are fantastic for timing your entries, they're just one piece of the puzzle. Without understanding the broader market trend, key support and resistance levels, and having a rock-solid risk management plan, you'll just be spinning your wheels. Profitable trading requires a complete approach, and using patterns in isolation simply won't get you there.
At Colibri Trader, we cut through the noise and teach a straightforward, price-action-based approach. We'll help you master these concepts and build a complete trading strategy without a single confusing indicator in sight. Ready to transform your trading? Learn more at Colibri Trader.