


How to Calculate Dividend Yield: A Trader’s Quick Guide
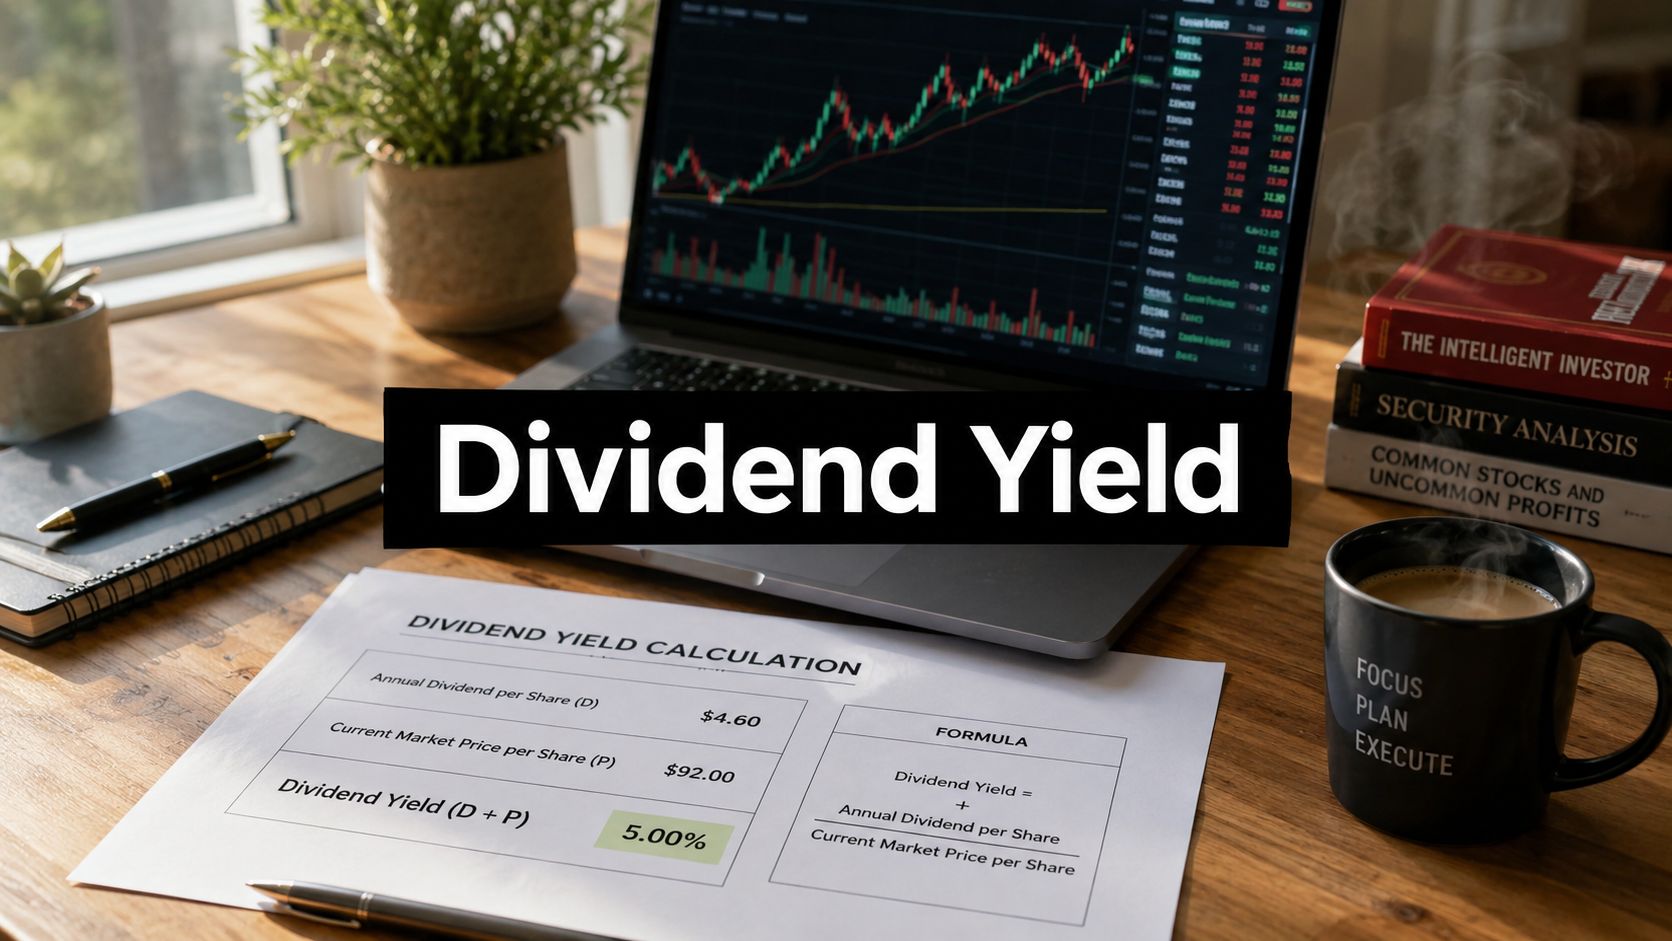
Annual dividend per share divided by the current share price, multiplied by 100, gives you dividend yield. If a stock pays $2 annually and trades at $50, the yield is 4%. If it pays $5 on a $100 stock, the yield is 5%.
That's the math, but traders usually get tripped up by what the number means after price starts moving. You're staring at a chart, a stock has been sold hard, and suddenly the listed yield looks huge. The question isn't just how to calculate dividend yield. The primary question is whether that rising yield is confirming opportunity, warning of stress, or merely distracting you from the tape.
For a pure price action trader, yield should never replace structure, trend, or risk control. But it can add context fast. A yield spike can tell you the selloff is getting extreme. A stable yield range can hint where longer-term income buyers may get interested. Used that way, it becomes a secondary confirmation tool, not a reason to fight momentum.
Why Dividend Yield Matters Even to Price Action Traders
A lot of traders ignore dividends because they don't want to drift into balance-sheet analysis or valuation debates. I get that. If you trade off levels, trend, momentum, and reaction, you don't need to become an income investor overnight.
But you also shouldn't ignore a piece of information that can explain why some stocks behave differently around major zones.
A common setup looks like this. You've got a stock dropping into a weekly demand area. The chart is ugly, but the company has a reputation as a dividend payer, and the displayed yield is suddenly much higher than usual. That doesn't mean you buy. It means you've found a clue. Higher yield can reflect a lower price, and lower price often reflects fear. Fear can create capitulation, and capitulation sometimes shows up near turning points.
Price action still comes first. Yield just helps explain who may be waiting on the other side of the move.
That's especially useful if you already trade with a clean-chart mindset. If your approach is based on structure and order flow logic rather than indicators, yield can fit without clutter. It gives you a quick way to ask, “Is this stock cheap on the chart, or is the market pricing in real dividend risk?”
For newer traders building that skill set, a solid foundation in price action trading helps keep the order of operations straight. Read the chart first. Use dividend yield second. Never reverse that order.
Calculating Dividend Yield The Right Way
A stock drops hard into support, and the yield on your platform suddenly looks much more attractive than it did a month ago. Before that number influences a trading decision, make sure it is calculated correctly.

Start with the annual dividend
Dividend yield is annual dividend per share divided by current share price, multiplied by 100. Fidelity explains the standard approach in its dividend yield guide.
The part traders often mishandle is the annual dividend input. If the company pays quarterly, use the last four quarterly payments or annualize the current regular payout only if that reflects what the company is currently paying now. Monthly payers need the same treatment. Use a full-year figure, not a single payment, or the yield will be understated and your comparison will be off.
That sounds basic, but it matters in practice. A bad input gives you a bad read on whether a selloff has created a legitimate income cushion or just a number that looks attractive on a watchlist.
Then use the current share price
The share price is the live part of the formula. That means yield can change fast even when the dividend stays the same.
For a price action trader, that is the useful part. Yield expands when price falls and contracts when price rises. So the calculation is not just accounting. It is a quick way to measure how much of the current chart damage has changed the stock's income profile.
Use this process:
- Find the annual dividend per share.
- Check the current share price.
- Divide annual dividend by share price and multiply by 100.
Use the formula on a simple example
If a stock pays $2 per share annually and trades at $50, the yield is 4%. If another stock pays $5 annually and trades at $100, the yield is 5%.
The math is easy. The trading value is in the comparison. A higher dollar dividend does not automatically mean a better opportunity. Yield standardizes the payout so you can compare stocks with very different prices and quickly see whether a recent selloff has made the payout more interesting or more dangerous.
Practical rule: compare yield, then study the chart that produced it.
I use yield as a filter, not a trigger. If a stock shows an unusually high yield near a major level, I want to know whether that came from a controlled repricing or a breakdown that could still have room to run.
Where traders usually find the inputs
Most broker and charting platforms already show dividend and yield fields. I still check the raw numbers when the setup matters, especially after a sharp decline or around an earnings gap.
That extra step helps catch bad assumptions. Some platforms make the displayed yield look precise without showing whether the figure is based on recent payouts or an indicated future rate. That distinction changes how much weight the number deserves.
If you also want a cleaner way to monitor the cash side, this practical guide for tracking dividend income is useful. And if you want to keep dividends in context with the full trade result, Colibri Trader's article on how to calculate profit in stocks helps frame the difference between price gain, income, and total return.
Trailing Yield vs Forward Yield What Traders Need to Know
The number on your screen may be accurate and still mislead you.
That usually happens because traders assume every listed yield means the same thing. It doesn't. Some platforms emphasize trailing yield, while others display forward yield, and the difference matters most right after a company changes its dividend policy.

Trailing yield looks backward
Trailing yield uses dividends already paid over the last year. It's grounded in actual payouts, so it tells you what the stock has recently delivered in cash terms.
For traders, that makes trailing yield useful when you want a factual baseline. It answers a narrow question: what did this stock really pay relative to price?
Forward yield looks ahead
Forward yield uses expected future dividends. That might be based on the current indicated payout rate, company guidance, or platform assumptions.
That can be helpful, but it also introduces uncertainty. If management has hinted at a dividend change, or the business is under pressure, forward yield can paint a cleaner picture than reality deserves.
Why this changes trading decisions
Take a simple hypothetical case. A stock has sold off sharply, and your platform still shows a rich yield because it's using trailing data. Then the company cuts the dividend. The trailing yield still looks attractive for a while, but the future cash payout has changed. If you're using that old number as confirmation for support, you're reading stale information.
The reverse can happen too. A company raises its dividend after consolidating for months. Forward yield may improve before trailing yield catches up. That doesn't mean the chart will break out, but it does mean the stock may start attracting a different class of buyer.
A quick comparison helps:
| Yield type | What it uses | Best use for traders | Main risk |
|---|---|---|---|
| Trailing yield | Past dividends | Establishing what was actually paid | Can lag a recent dividend cut or hike |
| Forward yield | Expected dividends | Gauging current policy and likely buyer interest | Can be wrong if expectations change |
Before you act on a high yield reading, confirm whether your platform is showing trailing or forward data. That one check can keep you from building a trade around an outdated premise.
When I look at yield on a chart candidate, I treat trailing yield as evidence and forward yield as a scenario. Evidence gets more weight. Scenarios need confirmation.
A Price Action Trader's Guide to Using Dividend Yield
Most investors use dividend yield to sort income stocks from non-income stocks. Traders can use it differently. We can use it to judge whether the price move is changing the stock's character in a way that might matter at key levels.

In major markets, that distinction is real. As of April 30, 2026, the S&P 500 had an overall dividend yield of about 1.09%, while the S&P 500 Dividend Aristocrats Index averaged roughly 2.5% to 2.8%. Broad benchmarks often yield around 1% to 2%, while mature dividend-paying sectors like utilities can sit around 3% to 4.5% and REITs around 4% to 6%, according to AmeriSave's discussion of dividend yield ranges and market context.
That matters because a stock with a rising yield may be moving from “ordinary market stock” territory into “income buyer attention” territory. I'm not saying that creates support by itself. I'm saying it can help explain why some names start attracting demand after a washout while others keep breaking down.
Use yield as a sentiment gauge
When price drops fast and the dividend hasn't changed yet, yield rises mechanically. To a trader, that can signal one of two things.
First, the market may be overreacting, and the stock is approaching a level where income-focused buyers start paying attention. Second, the market may be pricing in a dividend problem before it becomes official.
Your job is to let the chart tell you which one it is.
Look for confirmation in the tape:
- Reaction at support: Does price reject the level quickly, or does it keep accepting lower prices?
- Candle quality: Are you seeing strong rejection wicks or weak closes near the lows?
- Follow-through: Does the bounce hold, or do sellers immediately reclaim control?
Yield doesn't answer those questions. It helps you ask better ones.
Use stable yield behavior around major zones
Some stocks spend long periods acting like magnets for income buyers. They don't explode higher. They often rotate, base, and trend in a slower way. In those names, yield can help explain repeated support behavior around longer-term zones.
If a dividend-paying stock approaches a major weekly level and the yield is becoming more compelling relative to where it usually trades, that can support your thesis that patient buyers may step in. Still, I want price confirmation first. I'd rather miss the first piece of the reversal than catch a falling knife because the yield looked tempting.
A short video can help if you want to think about this through a chart-reading lens rather than a fundamental one.
Keep it secondary
This is the practical framework I use:
- Start with structure. Identify trend, level, and liquidity first.
- Check the yield only after the chart qualifies. If the chart is random, yield won't save it.
- Ask what the yield is saying about sentiment. Has fear pushed price low enough to attract a different buyer base?
- Manage risk as if the yield means nothing. Stops, position size, and invalidation still come from price.
That keeps the tool in the right place. Useful, but never in charge.
The High Yield Trap When a Good Number Is a Bad Sign
The easiest mistake in this space is chasing the highest number on the watchlist.
A high dividend yield can look like free money. It often isn't. Yield is income relative to price, so it can rise solely because the stock is falling. That's why a dramatic yield spike can be a warning sign rather than a bargain.
Why the trap happens
Many articles stop at the formula and never deal with the harder question: when does a high yield turn into a danger signal? Saxo notes that dividend yield alone excludes price appreciation, ignores sustainability, and can mislead when the payout isn't well supported by earnings or cash flow. It also points out that more complete analysis requires looking at payout ratio, earnings support, and cash flow sustainability in addition to yield in its guide to calculating dividends and evaluating yield context.
That lines up with what traders see on charts. A collapsing stock often shows an attractive yield right before more damage hits. The denominator is shrinking. The business may be under pressure. The yield looks better while the trade gets worse.

Red flags I watch before taking a trade
I don't need a deep fundamental model to avoid obvious traps. I just need enough context to know whether the market is discounting a real problem.
- Sharp recent price damage: If the stock is falling in a straight line, the higher yield may just be a symptom of panic.
- Weak response at support: A stock that can't bounce from an obvious level usually isn't under quiet accumulation.
- Dividend uncertainty: If traders are openly questioning whether the payout holds, the listed yield can become irrelevant fast.
- Coverage concerns: If the dividend doesn't appear supported by earnings or cash flow, the yield may be fragile.
- Headline risk: Restructuring, debt stress, or business deterioration can turn “cheap” into “cheaper.”
Capital comes first. If the chart says sellers are still in control, don't let a juicy yield talk you into early entries.
That mindset is close to the broader discipline of capital preservation. A trader survives by avoiding obvious asymmetric downside. Yield traps are dangerous because they look conservative while acting speculative.
What works better than yield chasing
A better process is to treat high yield as an alert, not a signal.
Ask:
- Is price stabilizing?
- Has selling pressure changed character?
- Is there any sign the dividend narrative is improving rather than deteriorating?
If you can't answer those from the chart and basic context, there's no edge in forcing the trade. The market will give you another setup. It always does.
Conclusion Putting It All Together
It's easy to calculate dividend yield. Annual dividend per share divided by current share price, multiplied by 100. The hard part is using that number without letting it distort your trading decisions.
For a price action trader, yield works best as context. It can show when a selloff has pushed a stock into territory that may attract income-focused buyers. It can also warn that a falling price is inflating the headline number and creating a value trap. That difference matters more than the formula.
The useful approach is simple. Read the chart first. Mark the level. Watch the reaction. Then check yield to understand whether the move may be changing who's interested in the stock. If the price confirms your idea, yield can strengthen the story. If the price contradicts it, ignore the yield and respect the tape.
That keeps your process clean. You don't need to become a dividend specialist to benefit from this metric. You just need to know what it measures, what it misses, and when it's likely to be lying to you.
The best use of dividend yield in trading is modest and disciplined. Let it filter, confirm, and warn. Don't let it lead.
If you want a cleaner framework for reading charts, managing risk, and building a rules-based approach around pure price action, Colibri Trader offers educational resources focused on structure, discipline, and practical trade execution without relying on indicator-heavy analysis.