


A Trader’s Guide to the Bullish Engulfing Pattern
When you're scanning charts, some patterns just jump out at you. The bullish engulfing pattern is one of them—a powerful, two-candle formation that can signal a downtrend is running out of steam and a reversal is on the horizon.
Put simply, it’s what happens when a small red (bearish) candle is immediately followed by a larger green (bullish) one. The green candle's body completely swallows, or engulfs, the body of the previous red candle. This visual drama often points to a significant power shift from sellers to buyers.
Decoding the Power Shift of a Bullish Engulfing Pattern
Think of the market as a constant tug-of-war. During a downtrend, the sellers (bears) are clearly winning, pulling the price down. The bullish engulfing pattern is that moment where the buyers (bulls) suddenly dig in their heels, grab the rope, and yank it back with decisive force.
This pattern tells a compelling story in just two candles. The first is a small bearish candle, suggesting sellers are still in charge but maybe getting a little tired.
Then comes the drama. The second candle opens at or even below the previous close, looking like the bears are trying for one last push. But then, buyers storm in with overwhelming force, driving the price all the way up and past the previous candle's opening price. This complete reversal in a single session screams that sentiment has flipped. The sellers have lost control.
The Anatomy of the Signal
To spot this pattern correctly, you need to know its two key parts:
- The First Candle: A bearish (red or black) candle that shows up during a downtrend. The size isn't critical, but a smaller body can sometimes hint at seller exhaustion.
- The Second Candle: A bullish (green or white) candle whose body completely engulfs the body of the first candle. This means it opens at or below the prior close and closes above the prior open.
This clear visual makes it one of the easier patterns to recognize. It's the mirror opposite of its bearish counterpart, which you can read about here: https://www.colibritrader.com/bearish-engulfing-candle-pattern/
At its core, the bullish engulfing pattern is about rejection. The market emphatically rejects lower prices and establishes a new, higher trading range. It’s a strong signal that the path of least resistance has just switched from down to up.
To make it even clearer, here's a quick breakdown of the pattern's key characteristics.
Bullish Engulfing Pattern At a Glance
| Characteristic | Description |
|---|---|
| Pattern Type | Bullish Reversal |
| Candles | 2 (A small bearish candle followed by a large bullish candle) |
| Preceding Trend | Downtrend |
| Key Feature | The body of the second (bullish) candle completely engulfs the body of the first (bearish) candle. |
| Market Psychology | A rapid shift from selling pressure to overwhelming buying pressure. |
| Confirmation | Often confirmed by a subsequent bullish candle, high volume, or formation at a key support level. |
This table helps summarize what to look for, but remember that context is everything when it comes to trading.
Reliability and Market Context
As powerful as this pattern looks, it's not a crystal ball. Trading it blindly is a recipe for disappointment. Its reliability can be a bit misleading if you're looking at it in a vacuum.
One study found the pattern acts as a bullish reversal about 63% of the time. While that's better than a coin flip, it's a long way from a sure thing.
The real key to trading this pattern successfully is context. A bullish engulfing pattern that forms at a major support level, after a long and sustained downtrend, and on higher-than-average volume is infinitely more meaningful than one that just pops up randomly in choppy, sideways action.
If you're looking to build on this and deepen your knowledge of technical analysis, you can explore a broader range of trading concepts in our Academy.
How to Spot High-Probability Setups
Seeing a bullish engulfing candle is just the beginning. The real art is separating a strong, high-probability setup from random market noise. Without that filter, you’ll end up chasing false signals and hurting your P&L.
Think of yourself as a forest scout hunting for a rare tree. You wouldn’t stop at “it’s green.” You’d check the bark, the leaf shape, the soil. A top-tier bullish engulfing follows the same idea: it ticks very specific boxes before you act.
The Three Core Criteria
Before you even consider pulling the trigger, every bullish engulfing pattern needs to pass these three checks:
- Clear Preceding Downtrend: Look for a series of lower lows and lower highs. If there’s no visible bearish momentum to reverse, the setup lacks depth.
- Complete Body Engulfment: The second candle’s body must fully “swallow” the first candle’s body. Wicks don’t matter as much—what tells the story is the shift in opening and closing prices.
- Opposing Candle Colors: The first candle should be bearish (red/black) and the second bullish (green/white). That color jump signals a decisive shift from sellers to buyers.
If any of these elements is missing, the pattern’s edge evaporates.
Why Market Context Is King
A textbook pattern in a random trading range rarely produces winners. But place that same pattern where buyers have shown up before—or at a key trend line—and it becomes potent.
A bullish engulfing pattern is like a spark. On its own, it’s tiny. But drop it onto a pile of dry tinder—say, a major support level—and it can ignite a full-blown rally.
Here are three prime contexts to watch for:
- At a Historical Support Level: When price revisits a zone that’s bounced before, you get double confirmation—pattern and level align.
- Near a Key Moving Average: A bullish engulfing off the 50-day or 200-day moving average suggests the bigger trend is still intact after a pullback.
- At a Fibonacci Retracement Zone: In a healthy uptrend, a 61.8% pullback capped by an engulfing candle often marks the end of the correction and the resumption of the trend.
By combining pattern rules with these contextual filters, you’ll only trade when the odds swing in your favor—leaving the false breakouts behind.
Using Volume to Confirm the Signal
Spotting a picture-perfect bullish engulfing pattern is a great start, but it's only half the story. Experienced traders know this pattern isn't a signal to jump in blindly; it's an invitation to dig deeper. The real key to trading this setup with confidence is finding confirmation—more evidence that the sudden switch from selling to buying has real power behind it.
Acting on the pattern alone is like hearing a single rumor. It might be true, but it's a huge gamble. We need more proof before we put our capital on the line.
The single most powerful confirmation tool is a big spike in trading volume on the day the engulfing candle forms. Think of the candlestick pattern as a whisper of a potential reversal; a surge in volume is the roar of the crowd backing it up.
High volume tells you that the bullish move isn't just a few small players messing around. It shows widespread participation and genuine conviction. It's the market shouting, "Yes, we agree with this new upward direction, and we're putting our money where our mouth is."
Why Volume Is the Ultimate Tell
Volume shows you the intensity, the raw power, behind a price move.
A bullish engulfing pattern that forms on low or even average volume is highly questionable. It could easily be a "false signal" or what traders call a "bull trap"—a quick little pop that fools buyers into thinking a new uptrend has started, right before the price collapses again.
But when you see a massive spike in volume accompanying that big green candle? That changes everything.
A huge surge in trading activity tells you a few critical things:
- The big money has arrived. Institutional players like hedge funds and banks are making their move. Their massive orders are what create those dramatic volume spikes.
- Sellers are getting steamrolled. The high volume proves that a tidal wave of buying pressure was needed to absorb every last sell order and still push the price way up.
- The new trend has fuel in the tank. A reversal backed by heavy volume has a much better shot at actually going somewhere. It signals a real transfer of power from the bears to the bulls.
A bullish engulfing pattern without high volume is like a powerful engine with no fuel. It might look impressive, but it’s not going anywhere. The volume spike is the proof of commitment that turns a potential signal into a high-probability trade.
Other Powerful Confirmation Techniques
While volume is your go-to confirmation, layering it with other signals stacks the odds even more in your favor. This multi-layered approach helps filter out market noise and builds the confidence you need to take the trade.
1. Wait for the Next Candle's Close
This is a simple, disciplined tactic. Instead of jumping in right away, wait for the next candle to close. For a truly strong confirmation, you want to see this third candle close above the high of the bullish engulfing candle. This proves the buyers are still in control and are successfully pushing prices higher.
2. Check for Bullish Divergence
Sometimes, indicators like the Relative Strength Index (RSI) or MACD can give you a heads-up before the pattern even appears. Bullish divergence is when the price on your chart makes a new low, but the indicator makes a higher low. This disagreement suggests the downward momentum is running out of steam. A bullish engulfing pattern appearing right after you've spotted bullish divergence is an incredibly potent combination.
3. Analyze the Broader Trend Context
Where the pattern shows up matters immensely. As we've discussed, a signal appearing at a major, historical support level is far stronger. But you also need to zoom out and look at the bigger picture. Does this small reversal fit into a larger potential shift in the market? You can learn more about how to identify market trends in our guide to get a better feel for this.
The bullish engulfing pattern is often said to have a high success rate—some studies claim it's over 70%—but that number is misleading. In the real world, its success depends almost entirely on these confirmation factors. The pattern is especially sensitive to volume; low-volume signals are notoriously unreliable, while high-volume signals show that the buyers mean business.
By patiently waiting for these extra layers of proof, you stop just reacting to shapes on a chart and start trading like a professional—with a clear, analytical edge.
Building Your Bullish Engulfing Trading Plan
Spotting a confirmed bullish engulfing pattern is the moment you switch from just watching the charts to actively looking for a trade. But jumping in without a plan is just a roll of the dice. A solid trading plan turns a promising chart pattern into a repeatable strategy, with clear rules for when you get in, how you manage your risk, and where you take your profits.
Think of it like a pilot's pre-flight checklist. You don't just see a clear sky and hit the throttle; you go through a systematic process to make sure the flight is safe and ends up where you want it to go. Your trading plan is that checklist, and its job is to keep you disciplined when the pressure is on.
Choosing Your Entry Strategy
Once you've found a high-probability bullish engulfing pattern, you've got two main ways to enter the trade. The one you pick usually comes down to your personal risk appetite and trading style.
1. The Aggressive Entry
This is exactly what it sounds like: you get into the market either right as the big engulfing candle is about to close, or the second it does.
- The Logic: You're trying to catch the move right from the very beginning. If the reversal takes off like a rocket, you'll maximize your potential profit.
- Best For: Traders who feel very confident in the setup. Maybe it’s happening at a major support level with a huge spike in volume. You're willing to accept a slightly lower win rate in exchange for the best possible entry price.
2. The Conservative Entry
This one requires a bit more patience. Instead of hopping in immediately, you wait for a little more proof.
- The Logic: You only enter after the next candle closes above the high of the bullish engulfing candle. This shows you that the initial burst of buying has some follow-through.
- Best For: Traders who prioritize a higher chance of a winning trade, even if it means getting in at a slightly higher price and potentially shrinking the profit margin a bit.
Neither entry is "better"—they just represent different trade-offs between risk and reward. The trick is to pick the one that fits you and stick with it.
Setting a Disciplined Stop-Loss
Your stop-loss is your safety net. It's the line in the sand where you admit the trade idea was wrong, and it’s what saves your account from a devastating loss. For the bullish engulfing pattern, the placement is incredibly logical.
The best place to set your stop-loss is just below the low of the bullish engulfing candle.
Why there? The whole idea behind this trade is that the bottom of this pattern marks the point of "peak selling," where the bulls finally took over. If the price breaks back below that low, the bullish story falls apart. It’s time to get out with a small, manageable loss.
A trade without a stop-loss is a hope, not a strategy. Placing it below the pattern's low is the most logical way to protect your capital if the bullish momentum fails to materialize.
Defining Your Profit Targets
Knowing when to cash out a winning trade is just as crucial as knowing when to get in. A clear profit target stops you from letting greed turn a good trade into a bad one. Here are two practical ways to set your targets.
Method 1: Identify Key Resistance Levels
Look to the left on your chart. Where did the price struggle or reverse on the way down? Those old support levels often turn into new resistance levels on the way back up.
- Find the closest major resistance area above where you entered.
- Set your main profit target just a little bit below that level.
This strategy uses the market's own history to find a logical spot where sellers might step back in.
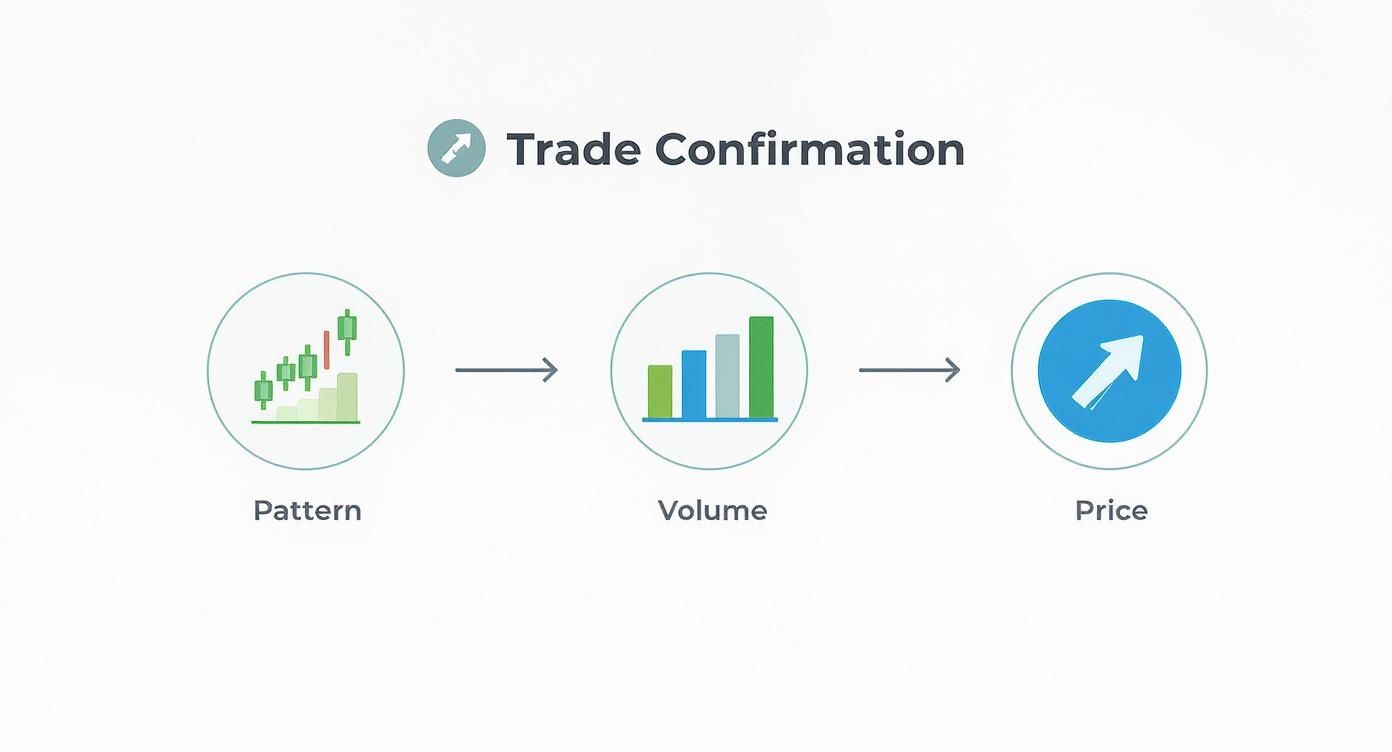
This flowchart shows how a valid pattern, confirmed by strong volume and price action, can signal a potential move up, giving you a complete trading signal from start to finish.
Method 2: Use a Fixed Risk-to-Reward Ratio
This approach is more mathematical and systematic. It defines your potential profit as a direct multiple of your risk. A common starting point is a 2:1 or 3:1 ratio.
- First, figure out your risk. This is the distance in pips or dollars from your entry price down to your stop-loss.
- Next, multiply that risk amount by your chosen ratio (e.g., multiply by 2 for a 2:1 ratio).
- Finally, add that result to your entry price. That's your profit target.
For example, if you are risking 50 pips on the trade, a 2:1 target would be 100 pips above your entry. This ensures your winning trades are meaningfully bigger than your losing ones. To really get a handle on this critical concept, you can learn more about the risk-reward ratio in our detailed guide.
Common Mistakes and How to Avoid Them
Spotting a bullish engulfing pattern is a great start, but that's where the real work begins. Far too many traders see the pattern, get excited, and jump the gun, only to turn a promising setup into a frustrating loss.
Let's be clear: this pattern isn't a golden ticket. It's a clue. Think of it like a flashing yellow light at an intersection. It signals a potential change, but you don't just floor it. You slow down, check for cross-traffic (that’s your confirmation), and only then do you proceed with caution. Treating it like a green light is one of the fastest ways to get into a trading accident.
Trading Against the Current
One of the costliest mistakes I see is traders completely ignoring the market context. A bullish engulfing pattern is a reversal signal. Its entire purpose is to flag the potential end of a downtrend.
When this pattern pops up randomly in the middle of a raging bull run, it’s not a signal to pile on more buys—it's usually just market noise. Likewise, if it forms in a choppy, sideways market with no clear direction, it carries almost no weight. Its real power is unleashed when it appears at a significant technical level.
- What to Avoid: Don't trade a bullish engulfing pattern that appears during a strong, established uptrend or in a sideways mess with no clear support.
- What to Do: Look for patterns that form at pre-identified support zones, major moving averages, or after a clean, sustained drop. The location is what gives the signal its power.
The Danger of Ignoring Confirmation
An unconfirmed bullish engulfing pattern is just two candlesticks, not a trade signal. Leaping into a trade the second the candle closes is a gamble, plain and simple. You're trading on hope, not strategy. The market can easily paint a beautiful-looking pattern and then completely reverse on the very next candle.
This is where discipline makes all the difference. Patience isn't just a virtue in trading; it's a profit-preserving skill.
The bullish engulfing pattern tells you that buyers showed up for a fight. Confirmation tells you they won that fight and are ready to advance. Never enter a trade based on the fight alone.
Waiting for that extra bit of proof—like a surge in volume or the next candle closing above the pattern's high—dramatically stacks the odds in your favor. It helps filter out the weak, false signals that slowly bleed an account dry.
Neglecting Essential Risk Management
This one is the cardinal sin of trading any pattern: failing to use a stop-loss. The bullish engulfing pattern gives you a perfectly logical place to define your risk—just below the low of the big green candle. If the price breaks that level, the entire bullish idea is toast.
Trading without a stop-loss is like driving without brakes. Sure, it might feel fine for a while, but it only takes one wrong turn for total disaster to strike. Your stop-loss is your non-negotiable insurance policy. Period.
It's also worth noting that the market is always evolving. Recent research on India's large-cap stocks highlighted that the predictive power of the bullish engulfing pattern has actually weakened in today's highly liquid, institution-dominated markets. The study concluded that while the pattern is still valuable, traders shouldn't rely on it blindly without rock-solid confirmation. You can dig into these findings on the pattern's statistical validity.
Misreading the Finer Details
Not all engulfing patterns are created equal. You have to look at the little details within the candle itself to gauge the conviction behind the move.
-
Wick Size: Pay close attention to the wicks. A big green candle with a very long upper wick is a red flag. It shows that buyers pushed the price way up, but sellers fought back hard before the close. That signals indecision. Ideally, you want a strong close near the high with a tiny upper wick.
-
Relative Size: The bigger the green candle is compared to the red one it's swallowing, the more decisive the power shift. A green candle that barely engulfs the previous one is far less impressive than one that dwarfs it by two or three times.
By steering clear of these common traps and learning to read the nuances, you can elevate the bullish engulfing pattern from a simple chart observation into a powerful tool in your trading arsenal.
Frequently Asked Questions
Even with a solid game plan, you're bound to have questions when you start trading a new setup. Getting these common points of confusion cleared up is crucial for building the confidence to act when a real opportunity pops up on your chart.
Let's run through the most common questions traders have about the bullish engulfing pattern. Think of it as that final check before you take off—you’ve studied the map (the pattern), checked your gear (confirmation tools), and planned your route (your trading plan). Now, we're just covering the "what-ifs."
How Reliable Is This Pattern?
That's the million-dollar question, isn't it? The reliability of the bullish engulfing pattern really depends on the context. By itself, some studies show a success rate of around 63%. That's better than a coin flip, but it's certainly no guarantee.
The real magic happens when the pattern shows up in the right place at the right time. Its reliability gets a serious boost when it appears:
- After a clear, established downtrend: It needs some bearish momentum to actually reverse.
- At a major support level: This is a spot on the chart where buyers have shown up in the past, adding a huge layer of confirmation.
- With a big spike in trading volume: This is your proof that there’s real conviction and participation behind the move.
Treat the bullish engulfing pattern less like a standalone signal and more like a key piece of evidence. When it lines up with other confirming factors, it goes from being a simple observation to a high-probability trade setup.
What Is the Difference Between Bullish and Bearish Engulfing Patterns?
They're essentially mirror images of each other, signaling powerful, sudden shifts in market sentiment—just in opposite directions.
- A bullish engulfing pattern forms at the bottom of a downtrend. You'll see a small red (bearish) candle get completely swallowed by a larger green (bullish) one. It’s a signal that the bulls are taking over and the price could head higher.
- A bearish engulfing pattern shows up at the top of an uptrend. It's the reverse: a small green (bullish) candle is engulfed by a much larger red (bearish) one, warning that sellers have seized control.
Both patterns represent a decisive "changing of the guard" between buyers and sellers.
Does This Pattern Work on All Timeframes?
Yes, you can spot the bullish engulfing pattern on any timeframe, from a one-minute chart all the way up to the monthly. The key thing to remember is that its significance changes a lot depending on the chart you're looking at.
As a rule of thumb, the pattern is far more reliable on longer timeframes like the daily or weekly charts. Why? Because a pattern on the daily chart represents an entire day of trading where the mood completely flipped from bearish to bullish. That’s a much more substantial shift in market psychology.
On shorter timeframes, like a 5-minute chart, you'll see these patterns constantly. While that sounds great, it also means the signal is swimming in market noise and you'll get a lot more "false positives." If you plan to trade it on lower timeframes, your confirmation rules need to be even stricter. For more answers to common trading questions, you might want to check out BuddyPro's FAQ section.
Should I Enter a Trade as Soon as the Pattern Completes?
This is where discipline comes in. While some aggressive traders jump in the second that engulfing candle closes, a more patient approach is often more profitable. My advice? Wait for additional confirmation.
A great conservative strategy is to wait for the very next candle to close above the high of the bullish engulfing candle. This simple step serves as proof that the buyers are still in control and have the strength to keep pushing the price up. It dramatically reduces your risk of getting caught in a "bull trap." You might get a slightly less perfect entry price, but you'll often improve your odds of being in a winning trade.
At Colibri Trader, we teach traders how to master price action and build consistent, profitable strategies without relying on confusing indicators. Our action-based programs are designed to give you the skills and confidence to succeed in any market condition. To discover your trading potential and start your journey with a proven, straightforward approach, visit us at https://www.colibritrader.com.