


Bull Market vs Bear Market A Definitive Guide for Traders
The essential difference between a bull market vs bear market really just boils down to two things: which direction the market is moving over a sustained period, and how investors feel about it. A bull market is all about rising prices and widespread optimism. A bear market, on the other hand, is defined by those long, painful price declines and a sense of pervasive fear.
Getting a feel for the distinct signals of each is the first step to trading them effectively.
Defining Bull and Bear Markets at a Glance
A bull market is a period when prices are consistently climbing or are expected to keep climbing. The name comes from the way a bull thrusts its horns upward, reflecting a market buoyed by strong economic performance and high investor confidence. As a rule of thumb, a market is considered bullish once prices have rallied 20% or more from a recent low.
Conversely, a bear market is the exact opposite scenario. It gets its name from how a bear swipes its paws downward, signifying a market in a sustained freefall. This condition becomes official when a major index, like the S&P 500, drops 20% or more from its most recent peak. Bear markets are driven by pessimism, economic slowdowns, and investors running for the exits.
Core Differences Between Bull and Bear Markets
To really understand the practical distinctions, it helps to put their core characteristics side-by-side. I've broken down the key attributes that define each market environment below.
The following table offers a quick snapshot of the key characteristics that differentiate these two market environments.
Core Differences Between Bull and Bear Markets
| Characteristic | Bull Market (Rising) | Bear Market (Falling) |
|---|---|---|
| Price Trend | Sustained upward movement (higher highs and higher lows) | Sustained downward movement (lower highs and lower lows) |
| Investor Sentiment | Optimism, confidence, and sometimes greed or FOMO | Fear, pessimism, and often panic or capitulation |
| Economic Outlook | Strong GDP growth, low unemployment, rising corporate profits | Slowing GDP, rising unemployment, declining profits |
| Trading Volume | Generally increases as prices rise and more buyers enter | High volume on down days; can be low during periods of indecision |
This comparison highlights how each market type is a reflection of a much larger economic and psychological picture. The differences go far beyond just the direction of price on a chart.
This infographic gives you a great visual summary of the key differences.
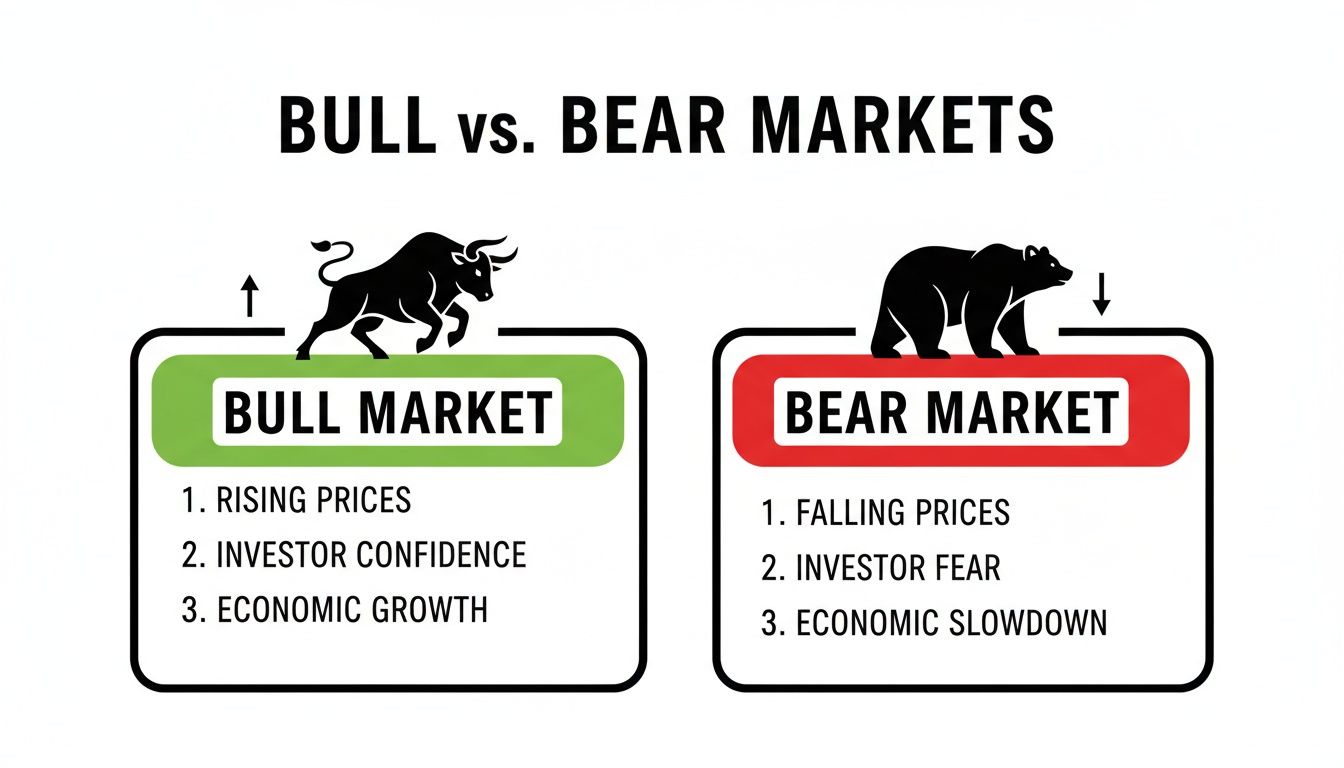
As the image shows, rising prices in a bull market feed directly into investor confidence, while falling prices in a bear market are driven by fear. Both are heavily influenced by the collective psychological state of market participants. If you want to dig deeper into this, it's worth understanding what market sentiment is and how it truly moves prices.
"While bear markets are painful, history shows they are relatively short-lived compared to their counterparts. A disciplined approach recognizes that market conditions are temporary and cyclical."
Looking back at the S&P 500 since 1926, it's clear that bull markets dominate in both length and rewards. The average bull market lasts a staggering 9.1 years and delivers a cumulative total return of 480%.
In stark contrast, bear markets are brief but brutal. They average just 1.4 years in length but produce an average loss of -41%. These are powerful statistics that underscore why having a plan for both conditions is absolutely critical for long-term survival.
Reading Price Action Signals for Market Direction
Forget the textbook definitions for a moment. The real art of navigating a bull market vs bear market comes down to reading the story the price is telling you, right on the chart. Pure price action gives you the earliest, most unfiltered clues that a trend is losing steam and might be about to turn on a dime. If you can master these signals, you'll be able to spot major shifts long before the mainstream crowd catches on.

The structure of the price is what it's all about. Every trend, whether up or down, has a distinct architectural blueprint. Once you see it, spotting changes becomes second nature. This is a foundational concept, and you can really dig into it by learning how to read price action properly.
At its simplest, a healthy bull market is just a consistent series of higher highs and higher lows. The buyers are clearly in control—they keep pushing prices to new peaks and step in to buy the dips at ever-higher levels. A bear market is the mirror image, carving out a path of lower highs and lower lows.
Identifying a Break in Market Structure
The first hint of a shift from bull to bear comes from a "break in market structure." This isn't one single candle but a sequence of events that shows the balance of power is tipping from buyers to sellers. It’s a methodical process, and the clues are right there on the chart if you know what to look for.
The initial warning shot is the failure to make a new higher high. When an uptrend runs out of gas and the next rally falls short of the last peak, it’s a sign that the buying pressure is fading.
What comes next is the critical part: the price breaks below the previous higher low. This move officially invalidates the uptrend's structure. It proves that sellers have finally gathered enough strength to smash through what was supposed to be a solid floor of support. This one-two punch—a failed high followed by a broken low—is the classic signature of a trend reversal.
For a trader, recognizing this structural break is paramount. It’s the market’s way of whispering that the party might be over before the economic headlines start shouting it.
This logic works perfectly in reverse, too. When a bear market starts to lose its grip, you'll first see the price fail to make a new lower low. Then, a rally will manage to break above the previous lower high. This tells you that buyers are finally absorbing the selling pressure and laying the groundwork for a new potential uptrend.
Key Candlestick Reversal Patterns
Zooming in from the overall market structure, individual candlestick patterns offer high-probability signals of a potential reversal. Think of them as a snapshot of the intense battle between buyers and sellers right at a critical turning point.
Some of the most reliable patterns I watch for include:
- Engulfing Candles: At the top of an uptrend, a bearish engulfing pattern appears when a massive red candle completely swallows the body of the prior green one. It's a sudden, powerful shift showing sellers just overwhelmed the buyers. A bullish engulfing at a market bottom signals the exact opposite.
- Pin Bars (or Hammer/Shooting Star): These candles have small bodies and long wicks, screaming that price was violently rejected at a certain level. A pin bar at a resistance level with a long upper wick shows sellers defending their territory. One at a support level with a long lower wick shows buyers stepping in with force.
- Head and Shoulders: This is a classic topping pattern. It’s made of three peaks: a central, higher peak (the "head") with two lower peaks on either side (the "shoulders"). A break below the "neckline"—the support level connecting the troughs—is a major signal that the trend is reversing.
History tells us that while bull markets last longer, bear markets are a frequent and unavoidable test of a trader's skill. Since 1928, the S&P 500 has gone through 27 bear markets, happening about every 3.5 years on average. That frequency is exactly why learning to spot these reversal signals early is so crucial to your survival and success.
Navigating the Psychology of Market Cycles
Beyond the charts and economic reports, the real engine driving a bull market vs bear market is raw human emotion. It's the collective psychology of millions of traders that creates the powerful tides that can sweep even the most disciplined analyst off course. Understanding these emotional cycles is just as critical as reading price action—they are two sides of the same coin.

In a bull market, optimism slowly snowballs into pure euphoria. As prices keep ticking higher, the general mood shifts from cautious belief to outright greed. This is when the Fear of Missing Out (FOMO) really takes hold, pushing otherwise sensible people to buy at ridiculous prices just because it seems like everyone else is getting rich.
You can see this euphoric state right on the charts. It often shows up as parabolic price spikes and a complete breakdown of logical valuation, where the crowd will justify buying at any price. This is easily the most dangerous phase, as that emotional high blinds traders to what are often glaring reversal signals.
The Grip of Fear in a Bear Market
On the flip side, a bear market is fueled by fear that eventually spirals into panic. The initial drop from a market top is usually met with disbelief and denial. Traders will cling to losing positions, hoping for a quick snap-back that never materializes.
As prices continue to grind lower, anxiety sets in, which then gives way to pure panic. This final stage, what we call capitulation, is where investors sell everything indiscriminately. They are desperate to get out at any cost just to stop the financial pain. This climax of emotional selling is precisely what carves out the deep market bottoms where new bull markets are born.
"The stock market is a device for transferring money from the impatient to the patient." – Warren Buffett
This timeless piece of wisdom gets right to the heart of the matter: emotional discipline. The crowd chases highs because of FOMO and panic-sells the lows because of fear. A consistently successful trader learns to do the exact opposite, recognizing these emotional extremes as signals to be cautious or to start looking for an opportunity.
Actionable Strategies for Emotional Control
Getting a handle on your psychological response is a skill you have to actively build. It doesn't just happen. Your trading plan needs specific rules designed to counteract these powerful emotional pulls.
Here are a few practical ways to stay disciplined:
- Trade a Plan, Not a Feeling: Never place a trade without a predefined entry, exit, and stop-loss. This takes emotional, in-the-moment decision-making out of the equation. When your criteria are met, you act. If they aren't, you sit on your hands.
- Trust Objective Price Action Signals: Base your decisions on what the chart is actually telling you—like a clear break in market structure or a key reversal candle—not on some news headline or a gut feeling. Price action is your objective guide through the emotional fog.
- Manage Risk Religiously: In a euphoric bull run, it’s incredibly tempting to get greedy and over-leverage. During a bear market panic, it’s easy to freeze up. A strict risk management rule, like risking only 1-2% of your capital on any single trade, keeps you grounded and ensures no one trade can cause catastrophic emotional or financial damage.
By understanding the psychology that powers the bull market vs bear market cycles, you can start to identify when the herd is acting on extreme emotion. This awareness lets you take a step back, stick to your plan, and execute trades based on logic and price action—not fear or greed.
Price Action Strategies for Bull Markets
Trading a bull market is a different beast altogether. A lot of traders think a rising tide lifts all boats, and while that's partly true, the real skill is in knowing how to ride that wave for maximum gain. The goal isn't just to get lucky; it's about finding high-probability entries that give you an excellent risk-to-reward ratio.
In a bull market, the trend is your best friend. The entire structure of the market is built on a series of higher highs and higher lows, which tells you one thing very clearly: buyers are in charge. With this kind of persistent upward momentum, the most profitable approach is usually to buy the dips, not chase the peaks.
Trading Pullbacks to Support
One of the most reliable strategies I've used in bull markets is buying on pullbacks to established support levels. Instead of jumping in at new highs where you risk getting caught in a sharp reversal, you exercise a bit of patience and wait for the price to take a breather. These pullbacks are a healthy, normal part of any uptrend—they're just periods of profit-taking before the next climb.
The process itself is straightforward, but it demands discipline:
- Identify the Uptrend: First things first, confirm the market is actually in an uptrend with clear higher highs and higher lows.
- Locate Key Support: Mark out previous swing highs on your chart. Once broken, these levels often turn into new support zones. Horizontal support and key moving averages (like the 20 or 50 EMA) are also critical areas to watch.
- Wait for the Pullback: Now, you wait. Let the price retrace back down to your support zone. Don't get trigger-happy and jump in too early.
- Look for a Bullish Signal: Once the price hits your support level, you need a confirmation signal from price action. I look for things like a bullish engulfing candle, a pin bar with a long lower wick, or another pattern that shows buyers are stepping back in with force.
- Execute the Trade: Enter a long position with your stop-loss tucked safely below the support level and the bullish candle pattern.
This method gets you into the trend at a much better price, which dramatically improves your potential return while keeping your risk clearly defined and manageable.
Using Trendlines for Dynamic Entries
Horizontal support and resistance levels are static, but an uptrend is a dynamic, moving thing. An ascending trendline is a fantastic visual tool for this, acting as the rising floor of the bull market. As long as the price continues to respect this line, the uptrend is intact.
To use this strategy, just draw a line connecting the significant higher lows. Every time the price pulls back to touch this trendline, you have a potential buying opportunity.
A trendline provides a dynamic area of value in a moving market. A bounce off a well-established trendline is a clear signal that the underlying buying pressure remains strong and the path of least resistance is still up.
Just like with horizontal support, you should always wait for a bullish candlestick pattern to form right on the trendline before pulling the trigger. This extra confirmation gives you more confidence that the trendline is going to hold and the uptrend will resume. Combining a pullback, a key trendline, and a bullish reversal signal is how you find a high-probability setup.
Letting Winners Run with Trailing Stops
One of the biggest mistakes I see traders make in a bull market is cutting their winners short. By definition, a strong uptrend means moves can be much bigger and last far longer than you might think. To really maximize your gains, you have to let your winning trades run. A trailing stop is the perfect tool for the job.
Instead of setting a fixed profit target, a trailing stop-loss order automatically moves up as the price moves in your favor.
Here are a couple of ways you can do it:
- Structure-Based Trail: Manually move your stop-loss up, placing it just below each new higher low that forms.
- Moving Average Trail: Use a short-term moving average, like the 20-period EMA, as a dynamic trail. You only exit if the price closes below it.
This technique takes the emotion out of your exit strategy. It allows you to capture the lion's share of a major trend move without giving back too much profit when it finally turns. Staying in the game is critical; history shows the first half of a bull market outperforms the second half 74% of the time. Think about the longest bull run in modern history, from 1987 to 2000—it lasted over 12 years and produced an incredible 582% in gains. That's a perfect illustration of how much upside you can miss if you jump out too soon. For more on this, you can dig into what the data shows about bull and bear markets.
Price Action Strategies for Bear Markets
While a lot of investors run for the hills when a bear market hits, a savvy price action trader knows this is an environment packed with opportunity. When the market is grinding down in a steady rhythm of lower highs and lower lows, the entire playbook gets flipped on its head. Forget buying the dips; the game is now about selling the rallies.
The core strategy here is short-selling. In simple terms, you're selling an asset you don't own, banking on the idea that you can buy it back later at a much lower price and pocket the difference. But doing this well isn't just about blindly hitting the sell button. It's about surgically identifying those moments where sellers are likely to show up in force and slam the price back down.
Identifying High-Probability Short Entries
The best short entries almost always pop up at clearly defined resistance levels. Think of these as price ceilings where previous rallies ran out of steam and got rejected. Your job is to have the patience of a sniper—wait for the price to pull back up into one of these zones, then look for a clear signal that the buying pressure is gone.
Here’s a methodical way to approach this:
- Confirm the Downtrend: First, make sure you're actually in a downtrend. You need to see a clear series of lower highs and lower lows on your chart. Don't fight the primary trend.
- Mark Key Resistance: Go back on your chart and identify previous swing lows. Once broken, these levels often become new resistance. Horizontal price levels and key moving averages (like the 50 EMA) are your best friends here.
- Wait for a Rally: Let the price come to you. A common mistake is chasing a falling price, which is just as dangerous as chasing a rising one. Let the market rally back into the resistance zone you've marked.
- Look for a Bearish Signal: Once price hits resistance, you need a trigger. Look for a confirmation candle. A bearish engulfing pattern, a pin bar with a long upper wick (often called a shooting star), or any other obvious sign of sellers taking control is your cue.
- Execute and Manage: Enter your short position as the signal forms, placing your stop-loss just above the resistance level and the high of your signal candle. This gives you a trade with a very clear, defined risk from the outset.
Following this process keeps you trading in sync with the market's dominant momentum, which is the single biggest edge you can have.
Unique Risk Management for Shorting
Shorting has its own unique flavour of risk. Bear market rallies can be absolutely brutal—they are often fast, sharp, and violent, fueled by other short-sellers getting squeezed and forced to buy back their positions. This means your risk management has to be even more disciplined than in a bull market.
A key difference in a bear market is that fear is a much faster and more powerful emotion than greed. This causes prices to fall much faster than they rise, but the counter-trend rallies can be explosive. Your stop-loss is your primary defense against getting caught on the wrong side of one.
Tighter stop-losses are non-negotiable. A bull market might give you a bit more wiggle room for a trade to work itself out. But with a short position, you need it to move in your favour relatively quickly. If it doesn't, that's often a red flag that a nasty short squeeze is brewing, and it's far better to get out with a small, manageable loss.
To build out your toolkit for these conditions, you should explore proven bear market investing strategies. It offers great context for managing risk when everything seems to be heading south.
Spotting the Final Capitulation Phase
Every bear market has an expiration date, and the end is often marked by a dramatic event called capitulation. This is the climax—that final, gut-wrenching phase of selling where absolute panic takes over. The investors who stubbornly held on through the entire decline finally throw in the towel, selling everything they have at any price just to make the pain stop.
On a price chart, capitulation is hard to miss. It usually looks like:
- A massive, undeniable spike in selling volume.
- A steep, almost vertical drop in price, like it's falling off a cliff.
- Overwhelmingly negative headlines and sentiment everywhere you look.
This moment of "maximum pessimism" is, paradoxically, the point of maximum opportunity. It’s when the very last seller has been flushed out, clearing the way for a new bull cycle to begin. For the patient price action trader, identifying capitulation is the signal to stop looking for short entries and start hunting for the first signs of a bottom. This is where incredible long-term buying opportunities are born.
Before we move on, let's crystallize the differences between trading in these two distinct market environments.
Strategic Comparison of Bull vs Bear Market Trading
This table provides a comparative overview of the primary trading approaches, risk considerations, and psychological focus for bull and bear market conditions.
| Aspect | Bull Market Strategy | Bear Market Strategy |
|---|---|---|
| Primary Goal | Buy low, sell high. Focus on capturing upward momentum. | Sell high, buy low. Focus on profiting from downward price moves. |
| Core Technique | Buying dips at support levels or breakouts to new highs. | Short-selling rallies at resistance levels. |
| Market Psychology | Greed and optimism are dominant. Traders feel FOMO (Fear of Missing Out). | Fear and panic are dominant. Volatility is high and rallies are suspect. |
| Momentum | Prices tend to grind higher slowly, with shallow pullbacks. | Prices tend to fall much faster than they rise. Rallies are sharp and short-lived. |
| Risk Focus | Guard against over-leverage and chasing tops. Manage greed. | Protect against violent short squeezes with tight stop-losses. Manage fear. |
| Ideal Price Action | Higher highs and higher lows. Breakouts above resistance. | Lower highs and lower lows. Rejections at resistance. |
Understanding these fundamental differences is critical. Trying to apply a bull market strategy in a bear market (or vice-versa) is a recipe for disaster. You have to adapt your mindset and your tactics to what the market is giving you.
Building an Adaptive Trading Plan for All Conditions
If you try to navigate the shifting tides of a bull market versus a bear market with a static strategy, you’re setting yourself up for failure. The most resilient traders I know aren't the ones with a single "perfect" system; they're the ones with an adaptive trading plan that evolves right alongside market conditions. Building this plan means moving beyond theory and cementing core principles into a system that’s uniquely yours.

Think of this plan as your operational blueprint. It dictates how you act based on objective price action, not gut feelings or emotions. It has to be flexible enough to handle the unique characteristics of both market cycles, guiding you on what to adjust and when. Understanding the limitations of 'set it and forget it' strategies really drives home why this dynamic approach is so critical.
Key Variables to Adjust
Your trading plan is not meant to be set in stone—it’s a living document. While the core components should remain consistent (like your overarching risk management rules), certain parameters absolutely must adapt to the environment.
- Position Sizing: In a steady, trending bull market, you might feel confident taking on larger position sizes. But when the heightened volatility of a bear market hits, reducing your size per trade is a crucial defensive move to protect your capital.
- Risk-to-Reward Ratios: Bull markets can offer long, sustained trends, which often allows for wider profit targets and bigger reward multiples. Bear market trades, especially on the short side, often mean you need to capture smaller, faster moves before a sharp counter-rally wipes out your gains.
- Trade Frequency: A clear, trending bull market might throw numerous high-probability setups your way. A choppy, uncertain bear market, on the other hand, demands more patience and selectivity. This usually leads to taking fewer, but more carefully chosen, trades.
An adaptive plan is built on a foundation of 'if-then' statements. For instance: "If the market structure is bullish and a pullback to support occurs with a pin bar, then I will enter a long position risking 1%." This kind of mechanical approach removes the guesswork.
Creating Your Personalized Framework
The goal here is to build a system that fits your personality and risk tolerance while respecting what the market is actually doing. Your plan should define everything, from your preferred chart timeframes to the specific price action patterns you will and will not trade.
Discipline is the glue that holds it all together. Your plan is only as good as your ability to follow it, especially when fear or greed inevitably tries to take over. By documenting your rules, you create a powerful tool for accountability and consistent execution. To get started, exploring a professional trading plan template can give you a structured foundation to build upon. This framework empowers you to trade with confidence, knowing you are prepared for whatever the market throws your way.
Answering Your Top Questions
When you're trying to figure out the difference between a bull market vs bear market, a lot of practical questions come up. I'm going to give you some straight answers to the most common ones I hear, framing them with the price action principles you need to trade these cycles effectively.
How Long Do Bull and Bear Markets Typically Last?
If you look at the historical data, it's clear that bull markets have a lot more stamina. On average, a bull market tends to run for about 9 years. This really highlights the market's natural tendency to drift upwards over the long haul.
Bear markets, on the other hand, are a different beast entirely. They're much shorter but far more vicious, typically lasting around 1.4 years. This is exactly why you need a solid defensive plan; these downturns can be sharp and unforgiving, even if they don't stick around for long.
Is It Possible to Profit in a Bear Market?
Absolutely. A bear market isn't something to fear if you know how to trade it. These conditions create some fantastic opportunities, especially through short-selling, which is simply a way to profit from a falling asset price.
This is where price action traders really shine. By pinpointing strong resistance zones and spotting bearish reversal patterns, we can time short entries with precision. And let's not forget the flip side: the panic-selling phase at the end of a bear market often serves up the best long-term buying opportunities you'll ever see, as great assets get thrown out at bargain-bin prices.
Are Economic Indicators Necessary to Identify Market Cycles?
Many traders get bogged down with economic data like GDP reports and unemployment figures. While those numbers often move in tandem with market cycles, a pure price action trader doesn't need them. Everything you need to know is already on the chart.
Price action is your leading indicator. A break in market structure or a powerful reversal pattern will often signal a shift in market direction long before the economists and news reports catch up.
This approach lets you be proactive. You're anticipating what the market will do next instead of reacting to old news that's already priced in.
What Is the Most Important Skill for Trading Both Markets?
If I had to pick just one, it would be disciplined risk management. Hands down. It's the bedrock of any successful trading career, regardless of whether the market is screaming higher or falling off a cliff.
In a bull market, solid risk rules keep you from getting greedy, taking on oversized positions, or watching all your hard-earned profits evaporate in a pullback. In a choppy bear market, it's your lifeline. It protects your capital from the massive losses that can happen during those sudden, aggressive drops.
At the end of the day, consistent money management—things like proper position sizing and actually using your stop-losses—is what keeps you in the game long enough to succeed.
Ready to finally master price action and trade with confidence in any market? Here at Colibri Trader, we teach the no-fluff, indicator-free strategies you need to build consistency. It's time to see what you're capable of.