


A Price Action Trader’s Guide to the Bull Engulfing Pattern
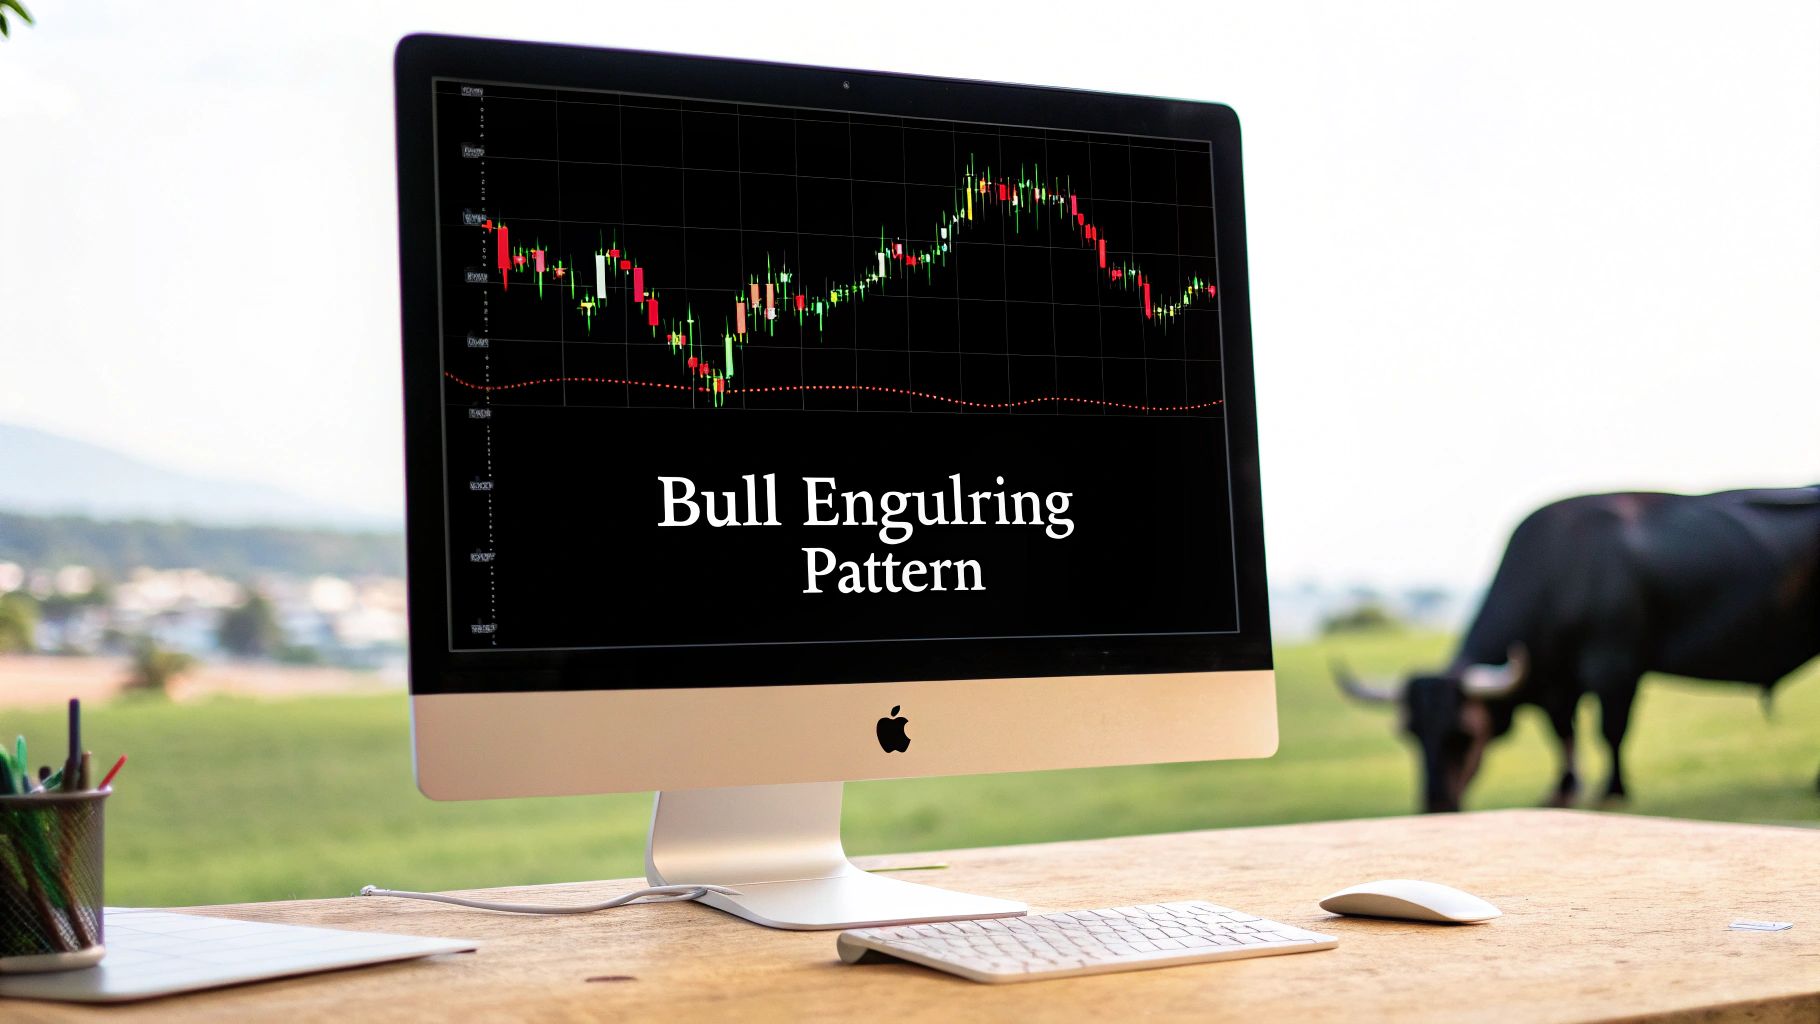
At its core, the bull engulfing pattern is a simple, two-candle setup that screams "potential reversal." It shows up after a price drop, signalling that the downtrend might be running out of steam and a new uptrend is about to kick off.
It’s a powerful visual clue that the balance of power has shifted from sellers to buyers.
Decoding the Bull Engulfing Pattern

Think of the market as a constant tug-of-war between buyers (bulls) and sellers (bears).
During a downtrend, the sellers are clearly winning, pulling the price lower and lower. This is often represented by a small bearish (red) candle—they're still in control, but maybe their strength is fading.
Then, out of nowhere, the buyers jump in with massive force. They don't just stop the sellers' pull; they yank the rope so hard they completely overwhelm them, taking back all the ground the sellers gained in the last period and then some. This explosive move forms a large bullish (green) candle that completely "engulfs" the previous red one.
When you see this on your chart, it’s telling a clear story: momentum has flipped, dramatically. The sellers have been exhausted, and the bulls are now in charge.
The Anatomy of the Pattern
The beauty of this pattern is its simplicity. It’s just two candles, but they pack a lot of information. For a bull engulfing pattern to be the real deal, it needs to meet a few specific conditions.
- A Clear Downtrend: Context is everything in trading. This pattern needs to show up after a noticeable drop in price. A bull engulfing candle in the middle of a messy, sideways market is just noise.
- The First Candle: The first candle must be bearish (red), carrying on the downtrend. Its size doesn't matter as much, but a smaller body can sometimes suggest that the sellers are losing conviction.
- The Second Candle: This is the main event. It has to be a bullish (green) candle that opens lower than the previous candle's close and closes higher than its open.
For a quick reference, here are the key characteristics I look for when identifying this pattern.
Bull Engulfing Pattern At a Glance
| Characteristic | What It Means for Traders |
|---|---|
| Location | Must appear after a clear downtrend. |
| First Candle | Bearish (red), continuing the prior trend. |
| Second Candle | Bullish (green) and must be larger. |
| Engulfing Body | The body of the green candle completely covers the body of the red one. |
| Psychology | A sudden and powerful shift from selling pressure to buying pressure. |
| Signal | Potential bottom and start of a new uptrend. |
This table boils it down, but the story behind the candles is what truly matters for a price action trader.
The single most important rule is this: the real body of the second, bullish candle must completely swallow the real body of the first, bearish one. The wicks (shadows) don't necessarily need to be engulfed, though it's an even stronger signal when they are.
By understanding these pieces, you start to see the market not just as lines on a screen, but as a battle between buyers and sellers. To get a better handle on the basics, our guide on understanding candlestick charts is a great place to build your foundation. This pattern is a crucial piece of that puzzle.
How to Spot the Bull Engulfing Pattern on Any Chart
Knowing the theory is one thing, but spotting a pattern in a live market is where the rubber really meets the road. Finding a bull engulfing pattern isn't about looking for a perfect textbook picture; it’s about training your eye to see the raw shift in power from sellers back to buyers.
To do this consistently, you need a quick and dirty checklist. Think of it as a mental filter you run every time you spot a potential setup. This process helps you weed out the weak signals and focus only on the A-grade opportunities.
The Three-Point Validation Checklist
The best bull engulfing patterns have two things going for them: the right structure and the right location. Get one without the other, and you've got a recipe for a failed trade. By checking these three points every time, you make sure the pattern has the context it needs to mean something.
- Find a Preceding Downtrend: First things first, context is king. This pattern must show up after a clear drop in price. Its entire purpose is to reverse selling pressure. If there's no selling pressure to begin with, the pattern is just noise.
- Identify the Two-Candle Structure: Next, look for the signature one-two punch. The first candle needs to be a bearish (red) candle, continuing that downtrend. The second candle has to be a bullish (green) one that forms immediately after.
- Verify the Engulfing Action: This is the main event. The real body of that second (green) candle must completely swallow, or "engulf," the real body of the first (red) candle. This means the green candle opens lower than where the red one closed, and then closes higher than where the red one opened.
Here’s a great example of what a quality bull engulfing looks like after price has been heading south for a while.
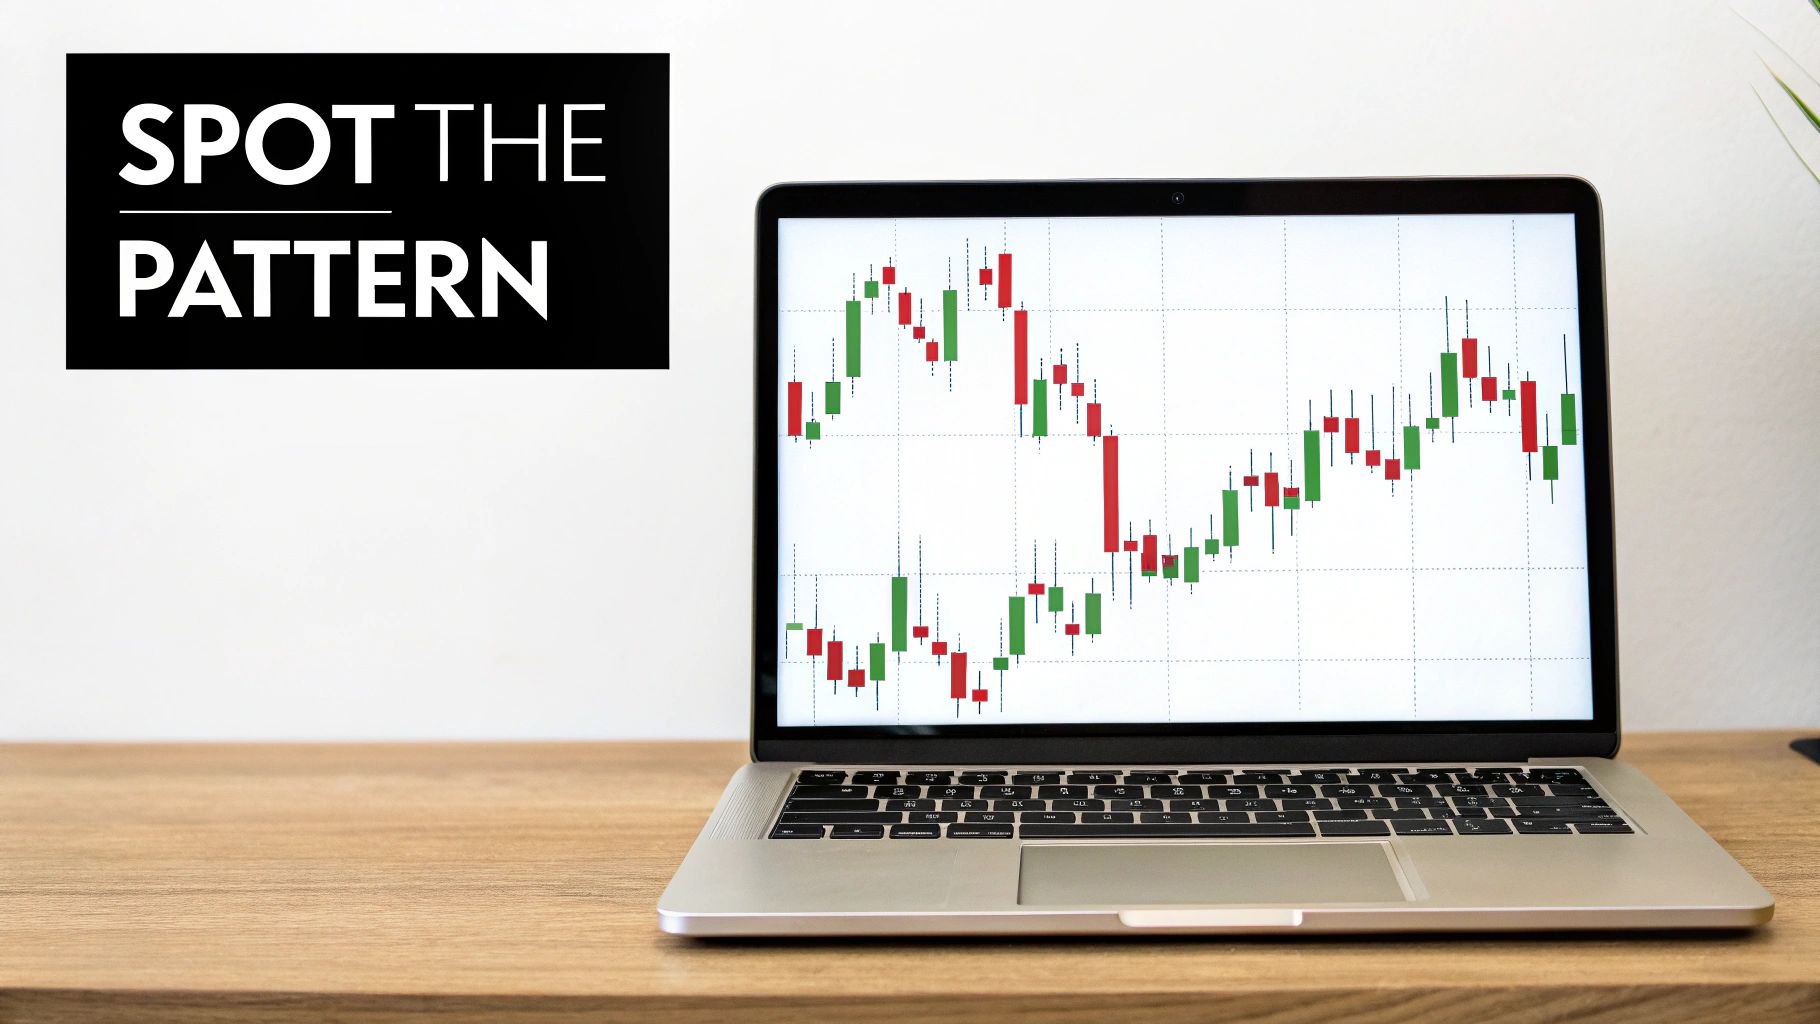
See how that big green candle just completely dwarfs the previous red candle? That's a violent rejection of lower prices and a clear signal that the mood has changed.
Beyond the Basics: What The Pros Look For
While that three-point checklist gets you in the game, experienced traders know to look for extra clues—what we call confluences—that add serious weight to the signal. For instance, a much larger engulfing candle often hints that a more powerful, committed group of buyers has stepped in, making a strong follow-through more likely.
The most powerful bull engulfing patterns don't just put the brakes on a downtrend; they signal an explosive change of character. The size of that engulfing candle is a direct reflection of the buyers' conviction.
Even more important is where the pattern shows up on your chart. A bull engulfing that forms right at a major support level or a previous swing low is infinitely more powerful than one floating in the middle of nowhere. This is the secret sauce: the confluence of the pattern itself plus a strategic location. This is what separates amateur pattern-spotting from professional price action trading.
The location gives the pattern credibility, and the pattern confirms the importance of that location. It’s a beautiful thing when they line up.
The Psychology Behind the Price Action
To really master the bull engulfing pattern, you need to see beyond the candlesticks on your chart. You have to understand the human story that’s playing out. Each candle tells a tale of fear and greed, a constant battle between buyers and sellers. This particular pattern is like a short, dramatic play in two acts, showing a sudden and violent shift of power from the sellers to the buyers.
The story starts with the first candle, a small bearish (red) one. This candle shows us a market where sellers are still in control, just as they have been during the preceding downtrend. But the small size of this candle is a huge clue: their conviction is weak. The selling is still happening, but it’s losing its punch. Sellers are getting tired, maybe a little hesitant, and likely thinking about cashing in their profits.
The Moment of Reversal
Then comes the second act: the big, bold bullish (green) candle. The session might open with sellers making one last, desperate push to drive prices lower, creating a lower low. This is a classic trap for late sellers who think the downtrend is still in full swing. Then, seemingly out of nowhere, a massive wave of buying power floods the market.
This isn't a few buyers cautiously dipping their toes in. This is a decisive, aggressive takeover.
- Trapped Sellers: That initial dip followed by the powerful reversal sends sellers who shorted at the bottom scrambling. They have to buy back their positions in a panic to cut their losses, which only adds more fuel to the bullish fire.
- Sidelined Buyers: All the buyers who were patiently waiting on the sidelines for a clear signal see this explosive move as their green light. They jump in, driven by the fear of missing out on the start of a new uptrend.
- Shift in Sentiment: The sheer force of this buying frenzy completely wipes out the previous session's losses and closes much, much higher.
This dramatic price action signals a profound shift in market psychology. It’s a clear message that the bears have lost control and the bulls are now firmly in command. The market has rejected lower prices with incredible force.
Reading the Collective Mind of the Market
The bull engulfing pattern isn't just a random shape; it’s a picture of the market changing its mind in real-time. The psychology of trading is an incredibly powerful force, and this pattern shows it in its rawest form. Understanding this narrative gives you the deep confidence you need to act decisively when you spot the pattern.
You're no longer just looking at red and green bars. You’re reading a story of capitulation and triumph. The sellers’ final, weak push is met with a buyer ambush, leading to a complete rout. This psychological shockwave often becomes the starting block for a sustained move higher, as the new bullish feeling pulls in more and more traders. Recognizing this emotional battlefield is what separates basic pattern spotting from professional price action analysis.
A Step-by-Step Strategy for Trading This Pattern
Spotting the bull engulfing pattern is one thing, but actually turning that chart observation into a profitable trade requires a plan. This is where most new traders go wrong. They see the pattern and jump in, letting emotion drive the decision.
What you really need is a simple, repeatable system. A clear set of rules for how you enter, where you place your safety net (the stop loss), and where you'll cash out.
Defining Your Entry Trigger
The biggest rookie mistake? Piling into a trade the second a big green candle starts to form. You have to wait. The pattern isn’t valid until that bullish candle closes. Patience is key.
A much smarter, more disciplined approach is to wait for confirmation. Let the market prove the buyers are serious.
A solid entry trigger is to place a buy-stop order just a few ticks above the high of the bullish engulfing candle. This way, you only get into the trade if the momentum continues upward after the pattern is confirmed. It’s like waiting for a green light and seeing the car in front of you start moving before you hit the gas.
This simple step helps you sidestep many of the "false signals" that sucker traders in, only to reverse moments later.
This flowchart breaks down exactly what’s happening behind the scenes—the shift from weak sellers to a full-on buyer takeover.
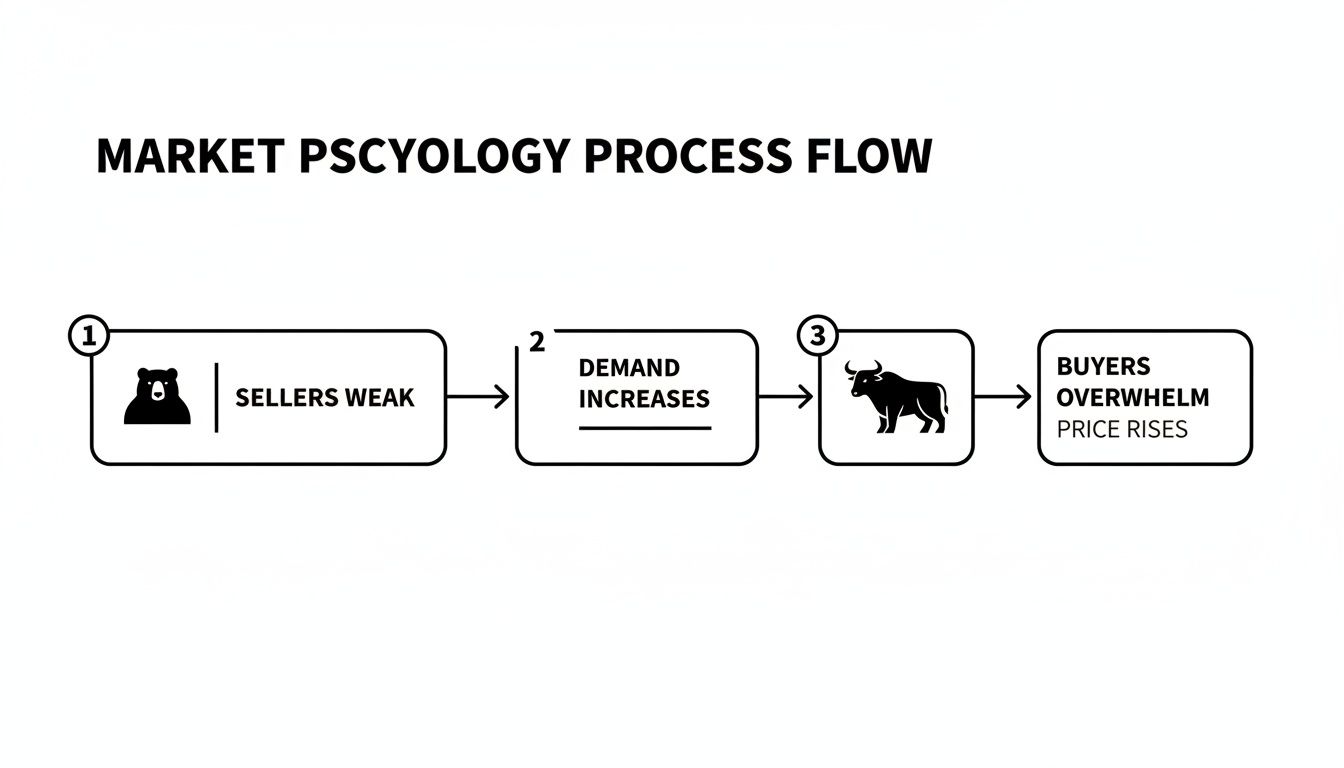
You can see how the sellers losing steam creates the perfect opening for buyers to rush in and decisively take control. That's the engine driving this whole setup.
Strategic Stop Loss Placement
Trading without a stop loss is like driving without brakes. Sooner or later, you're going to crash. Your stop loss is your non-negotiable exit plan if the market turns against you, protecting your account from a catastrophic loss.
For the bull engulfing pattern, the placement is crystal clear: set your stop loss just below the low of the big bullish engulfing candle.
This entire two-bar formation is the battleground where buyers won. If the price falls back below that level, the entire bullish argument is dead in the water. It’s a signal that the buyers failed, and it's time to get out with a small, manageable loss.
A well-placed stop loss isn't a sign of failure; it’s the hallmark of a professional. It takes the emotion out of a bad trade and keeps your powder dry for the next opportunity.
Placing your stop here gives the trade just enough room to wiggle without putting your capital in serious jeopardy. It respects the price action that gave you the signal in the first place.
Of course, before you can place any trades, you need to know how to open a trading account. Getting this sorted is the very first step to putting these rules into practice.
Bull Engulfing Trading Rules Cheat Sheet
To make this even easier, here’s a quick-reference table. You can use this as a checklist before you pull the trigger on a trade.
| Trading Component | Rule/Guideline |
|---|---|
| Entry Trigger | Place a buy-stop order just above the high of the engulfing candle. |
| Stop Loss | Place a stop-loss order just below the low of the engulfing candle. |
| Profit Target | Aim for the next key resistance level or a minimum 1:2 risk/reward ratio. |
| Confirmation | The bullish candle must close before the pattern is considered valid. |
Think of these as your core principles. Stick to them, and you'll build the discipline needed for long-term consistency.
Setting Logical Profit Targets
Knowing when to exit a winner is just as crucial as knowing when to cut a loser. Hope is not a strategy. Instead of just watching the trade and hoping it goes "to the moon," you need a logical exit point.
A common method is to use a fixed risk-to-reward ratio. For example, if your stop loss is 50 pips from your entry, you could set your first profit target 100 pips away for a clean 1:2 risk-to-reward. Simple and effective.
For a more dynamic approach that adapts to the market's structure, try these:
- Target the Next Resistance Level: Scroll left on your chart. Where did the price stall out or reverse before? That previous swing high or old support level is a natural magnet for sellers. It’s an intelligent place to take your profits off the table.
- Use Measured Moves: Another great technique is to measure the total height of the engulfing pattern itself (from its low to its high). Then, project that same distance upward from your entry point to find a logical target.
No matter which method you prefer, you must do the math before you enter. If the distance to your stop loss is bigger than the distance to your likely profit target, just skip the trade. It’s a bad bet. Always hunt for setups that give you at least a 1:2 risk-to-reward ratio. This discipline ensures your winners pay for your small losses, which is the secret to staying in this game.
How to Increase Your Win Rate with Confluence
A bull engulfing pattern is a great signal, but it never happens in a vacuum. One of the quickest ways to get burned is treating it like a standalone "buy" button without looking at the bigger picture.
Think of it this way: a powerful engine is fantastic, but it's not going anywhere without a solid car frame around it. In our world, that "frame" is confluence.
Confluence is just a fancy word for combining multiple, separate signals that are all telling you the same story. When a bull engulfing pattern shows up at a spot where other technical clues align, its reliability goes through the roof.
A great pattern in a terrible location is a recipe for a losing trade. A great pattern in a prime location? That's a high-probability setup.
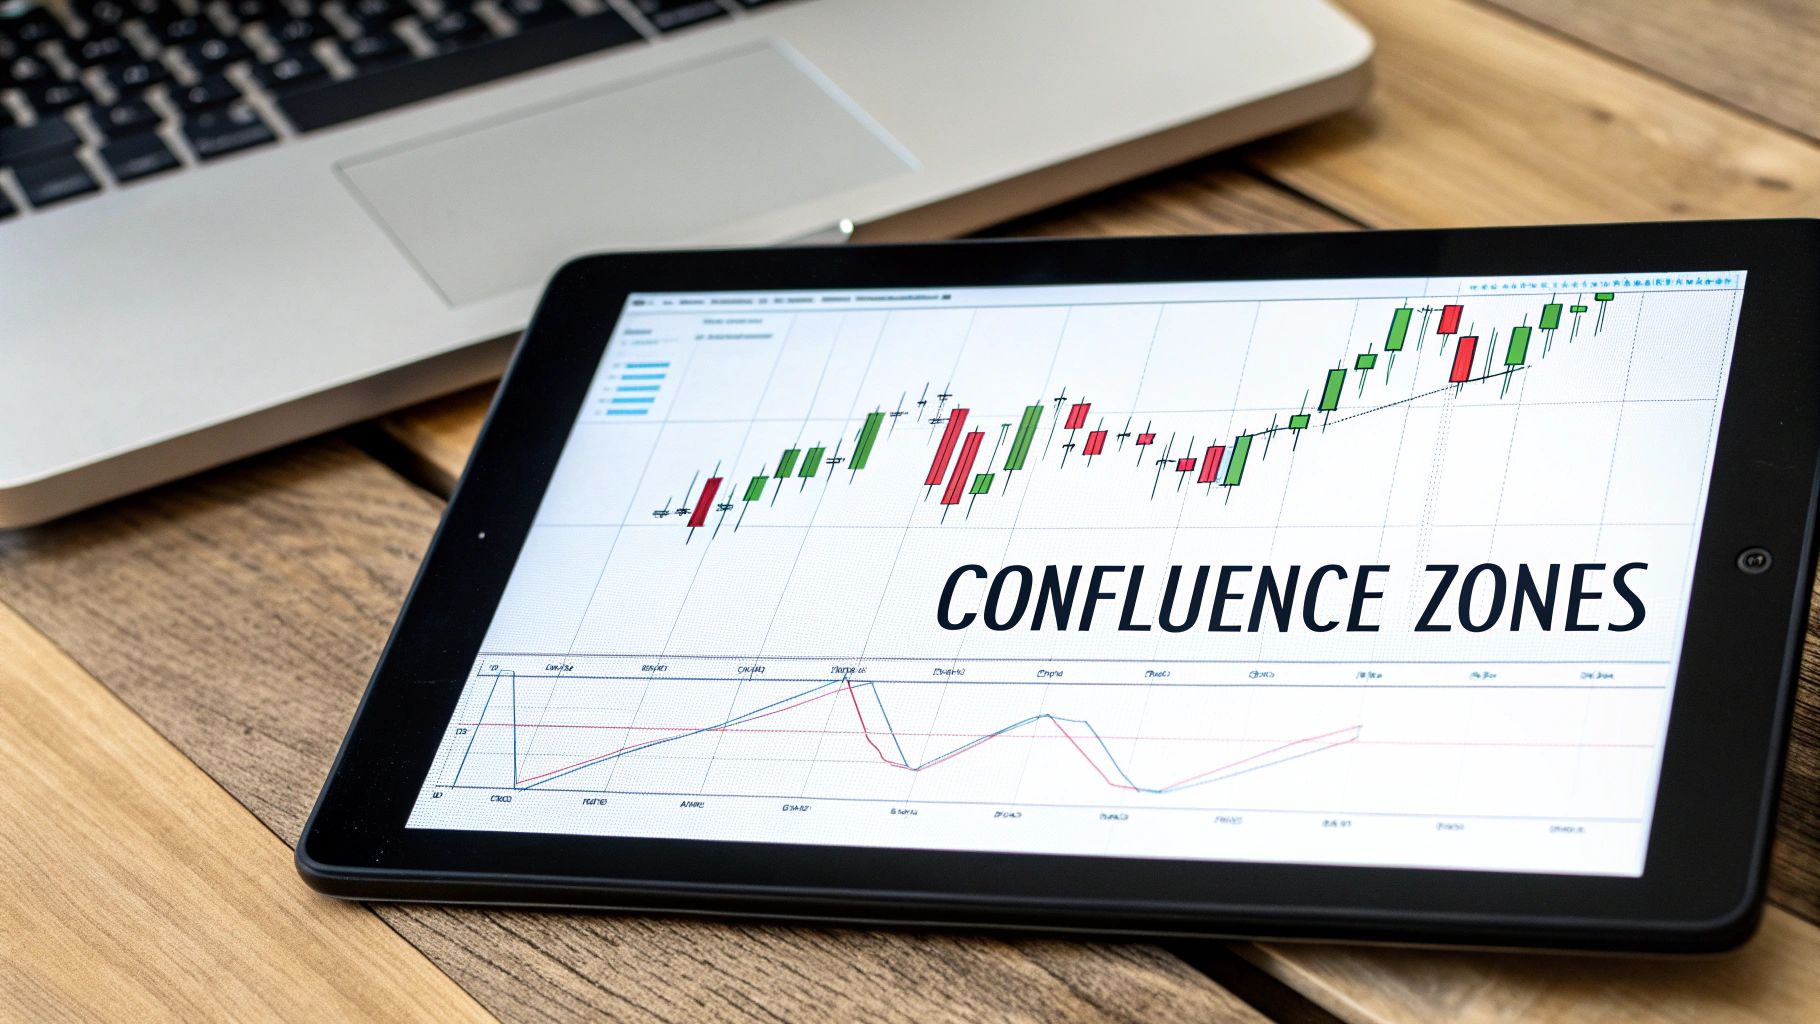
The Power of Strategic Location
As any good real estate agent will tell you, it's all about location, location, location. The most dependable bull engulfing patterns don’t just pop up randomly; they form at technically important price levels.
These are the zones where we already expect buyers to be lurking. The pattern is just the final confirmation that they've shown up in force.
I always look for the pattern to form at one of these key confluence zones:
- Major Support Levels: These are the historical price floors where buyers have jumped in before to stop a slide. Seeing a bull engulfing here is like watching reinforcements arrive at a well-defended fortress.
- Key Fibonacci Retracement Levels: After a big run-up, prices naturally pull back. A bull engulfing that prints right on the 50% or 61.8% Fibonacci level is a classic sign the pullback is likely over, and the original trend is about to kick back in.
- Long-Term Trend Lines: In a healthy uptrend, a rising trend line acts as dynamic support. When the price dips to kiss that line and prints a bull engulfing, it’s a screaming signal to get on board with the prevailing trend.
By patiently waiting for a bull engulfing to form in one of these "hot zones," you are stacking the odds heavily in your favor. You're no longer just trading a pattern; you are trading a pattern that confirms a major structural level on the chart.
This patient approach helps you filter out the market noise and focus your capital only on the A+ setups. For traders who really want to master this, digging deeper into confluence in trading can give you a serious edge.
Adding Volume as a Final Confirmation
So, you've found a clean bull engulfing pattern at a solid location. There's one last piece of the puzzle I like to add: trading volume.
Volume is what tells you about the conviction behind a move. It shows you how many people are participating.
Picture two identical bull engulfing candles. One formed on so-so, average volume. The other formed on a massive volume spike, way above the recent average. Which one tells a more powerful story?
The second one, of course. That huge spike in volume means a flood of market participants aggressively jumped in on the long side, putting their money where their mouth is and validating the reversal.
This isn't just a gut feeling; the numbers back it up. Looking at historical data, a bull engulfing pattern acts as a bullish reversal about 63% of the time. However, some studies show that win rates can jump above 70% when a significant surge in volume comes along with the engulfing candle, especially on the daily charts. You can see more details on these performance statistics over at ThePatternSite.com.
By layering these elements—a clear pattern, a strategic location, and volume confirmation—you turn a simple two-candle formation into a robust, high-probability trading strategy. This methodical process is what separates the consistently profitable traders from those just getting lucky.
Common Trading Mistakes and How to Avoid Them
Even with a strong signal like the bull engulfing pattern, a few simple mistakes can turn a great setup into a frustrating loss. Believe me, knowing what not to do is every bit as important as knowing your entry and exit rules. Mastering this pattern is less about the candle itself and more about the discipline to avoid the common traps that snag most traders.
The biggest mistake I see is treating the pattern like an automatic "buy" signal, completely ignoring the market environment. A bull engulfing pattern that pops up in the middle of a screaming, long-term downtrend is usually just a brief pause, not a major reversal. Trying to trade that is like trying to stop a freight train with a fishing net; the odds are stacked against you.
Ignoring the Bigger Picture
Context is everything. A single candlestick pattern doesn't exist in a vacuum, and trading it blind without considering the overall market structure is a recipe for disaster.
Another classic blunder is jumping the gun. Traders get hit with a case of FOMO (fear of missing out) when they see that big green candle forming and dive in headfirst. The pattern is only valid after the candle has closed. A candle can look incredibly strong for hours, only to have sellers rush in during the final minutes and wipe out all the gains, leaving you trapped in a lousy trade. Patience is not optional here.
The most expensive mistake in trading is often not a bad strategy, but a good strategy executed with poor discipline. Avoid the impulse to act before the signal is fully confirmed.
Poor risk management is another killer, especially with this pattern. Bullish engulfing candles are often quite large, which means the distance from your entry to your stop loss can be wider than you're used to. Many traders forget to adjust their position size for this, ending up risking way too much of their account on one trade.
Simple Rules to Keep You Safe
Having a firm, rules-based approach is the best way to keep your emotions in check and execute with discipline. Here are three simple rules that will help you sidestep these common mistakes.
- Respect the Trend: Only take bull engulfing signals that either align with the higher timeframe trend or appear at a significant, proven support level. Never, ever fight a strong, established downtrend.
- Wait for the Close: This one is simple but critical. Do not enter a trade until the engulfing candle has officially closed. This rule alone will save you from countless false starts.
- Calculate Your Risk First: Before you even think about hitting the buy button, calculate your position size based on your stop loss. If the required stop is so wide that it forces you to risk more than 1-2% of your capital, just skip the trade. There will always be another one.
The bull engulfing pattern has a solid reputation for a reason. Studies have shown it can have a success rate between 55% and 70%, with the daily charts often providing the cleanest signals. You can learn more about the reliability statistics of candlestick patterns to see how different timeframes affect performance. By avoiding these common slip-ups, you'll be trading the pattern in a way that aligns with its statistical edge, which is the key to consistency in the long run.
Frequently Asked Questions
Even with a detailed guide, a few questions always pop up when you're trying to apply a new pattern on a live chart. Let's tackle some of the most common ones I hear from traders so you can approach the bull engulfing pattern with more confidence.
What Timeframe Works Best for This Pattern?
You’ll see the bull engulfing pattern show up on every chart, from the 1-minute all the way up to the monthly. But its reliability changes dramatically depending on the timeframe you’re watching.
- Higher Timeframes (Daily, Weekly): These are my go-to. A bullish engulfing on a daily chart represents a full day's trading where the buyers didn't just show up—they dominated. It's a much more significant statement about market sentiment.
- Lower Timeframes (Hourly, 15-Minute): The pattern will appear much more often here, but that’s not always a good thing. These charts are full of "noise" and false signals. While you can certainly day trade with it, you need much stricter rules and extra confirmation.
For most traders, especially if you're just getting the hang of this, stick to the daily and 4-hour charts. They offer a great sweet spot between getting enough trading signals and having those signals be reliable.
Is a Bull Engulfing Pattern Always a Buy Signal?
Absolutely not. Let me be clear: treating this as an automatic "buy now" signal is one of the fastest ways to lose money. A bull engulfing pattern is a clue, a hint of a potential reversal. It needs context to mean anything.
Think of it as a compelling piece of evidence, not the final verdict. Its power comes from where it appears. A pattern at a key support level is a high-probability setup; one floating in the middle of a chart is just noise.
Always, always wait for more confirmation. That could mean waiting for the price to break the high of the engulfing candle or making sure it lines up with the bigger market trend.
How Does It Differ From a Piercing Pattern?
Both of these are two-candle bullish reversal patterns, but they tell very different stories about the buyers' strength.
A piercing pattern is when a bullish candle opens below the prior bear candle and closes more than halfway up its body. This tells us that buyers are putting up a fight, but they haven't completely taken control. It's a sign of a possible shift.
The bull engulfing pattern is a different beast entirely. It’s far more aggressive. The bullish candle doesn't just win back some ground; it completely swallows the previous candle's losses and pushes higher. This is a complete takeover, showing a much more decisive and powerful shift in momentum from sellers to buyers. It's simply a stronger signal.
Can the Bull Engulfing Pattern Fail?
Yes, and they do. Let's get this straight: no trading pattern works 100% of the time. Anyone who tells you otherwise is selling something. A pattern can look picture-perfect and still fail if a wave of selling pressure comes back into the market or if it forms in a terrible location (like right under a massive resistance level).
This is exactly why risk management is not optional. Your stop loss is your safety net. By placing it correctly below the low of the engulfing candle, you ensure that when a pattern inevitably fails, the loss is small and manageable. It protects your capital so you can live to trade another day.
At Colibri Trader, we teach you to trade based on what the price is actually doing, not what you hope it will do. Our action-based programs cut through the noise, focusing on the proven price action skills you need for consistent results. Take our free Trading Potential Quiz to find your starting point.