


Master the Bearish Engulfing Candle Pattern: Trading Guide
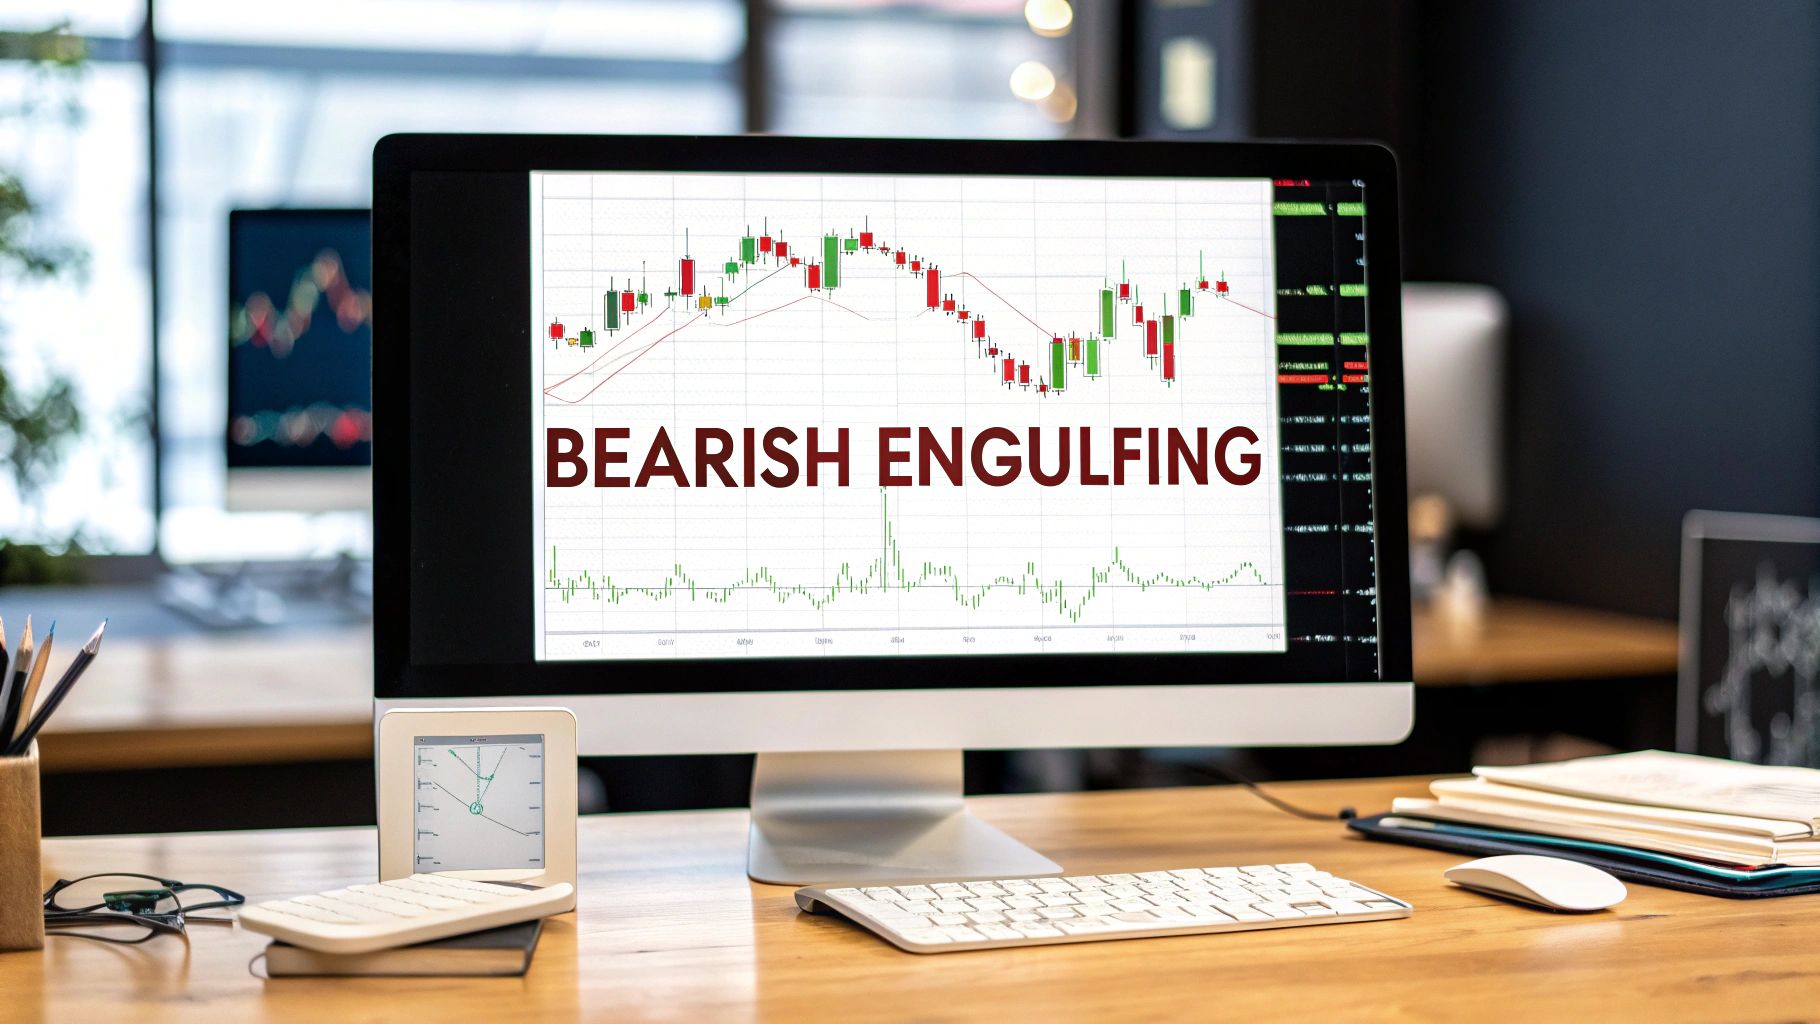
A bearish engulfing candle pattern is a powerful two-candlestick signal that warns of a potential reversal from an uptrend to a downtrend. It’s a classic price action pattern that shows up when a big bearish candle (red or black) completely swallows the body of the smaller bullish candle (green or white) that came right before it.
When you see this, it’s a sign that momentum has made a dramatic shift from buyers to sellers.
What a Bearish Engulfing Pattern Signals
Picture this: an asset's price has been on a steady climb, and the buyers are feeling great. Then, out of nowhere, a new trading session opens and sellers come in with overwhelming force.
They push the price down so hard that the day's losses don't just stop the rally—they completely wipe out the previous day's gains. That’s the story the bearish engulfing pattern is telling you. It's a visual gut-punch, a clear signal of a sudden and aggressive power shift in the market.
For traders, this pattern is a major red flag. It suggests the prevailing uptrend is running out of gas and a downtrend could be just around the corner. Think of it like a storm cloud suddenly appearing on a sunny day—it's a clear warning that the weather is about to change.
Key Characteristics at a Glance
Spotting this pattern quickly comes down to knowing its core components. If you're new to candlestick charts or just want a refresher on the basics, it's worth taking a moment to review how to properly read and interpret them by understanding candlestick charts. At the end of the day, the pattern's power comes from its structure and, most importantly, where it appears on the chart.
Here's a quick rundown of the essential characteristics of the bearish engulfing pattern.
Bearish Engulfing Pattern At a Glance
Use this table as a mental checklist to spot the formation on your charts before we dig into its anatomy in more detail. It will help you quickly grasp its appearance, meaning, and ideal placement.
| Characteristic | Description |
|---|---|
| Pattern Type | Bearish Reversal |
| Prior Trend | Must appear after a clear uptrend. |
| Number of Candles | Two distinct candles. |
| First Candle | A smaller bullish (green/white) candle continuing the uptrend. |
| Second Candle | A larger bearish (red/black) candle that completely engulfs the body of the first candle. |
| Signal Strength | Strongest when appearing at a key resistance level with high volume. |
Having this cheat sheet handy makes it much easier to confirm you're looking at a legitimate signal and not just random market noise.
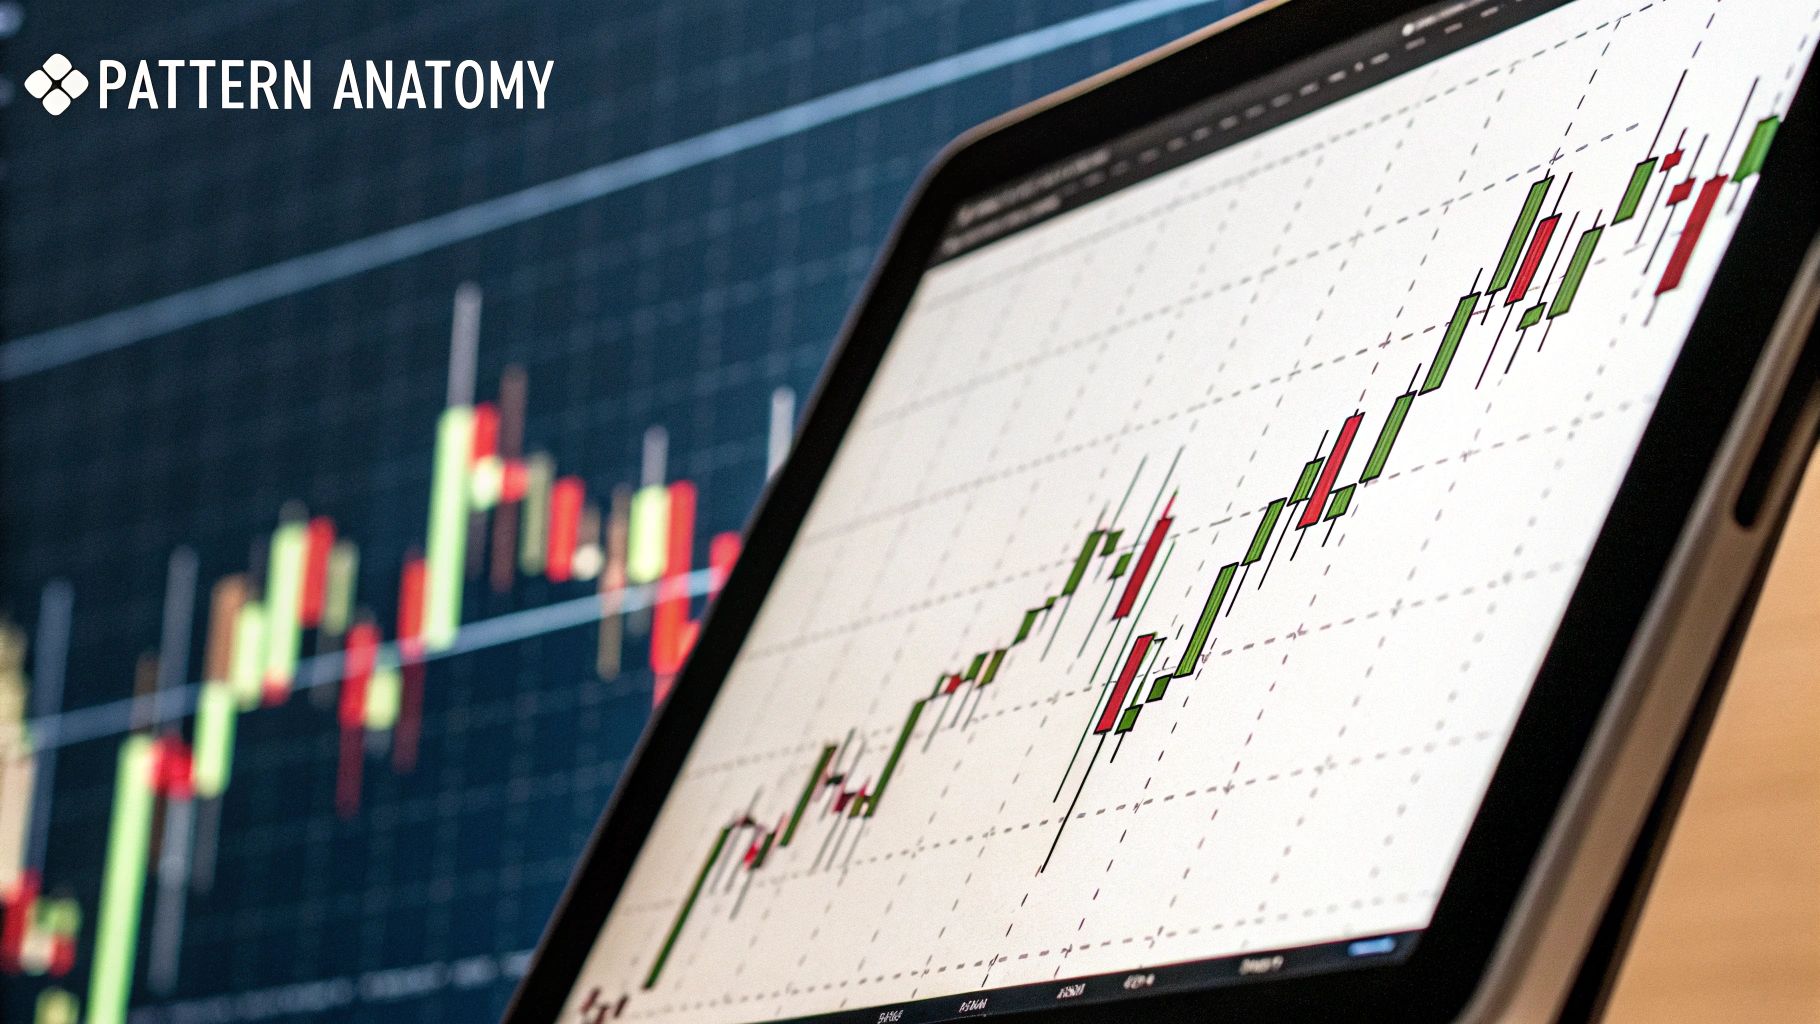
Breaking Down the Bearish Engulfing Candle
If you want to trade the bearish engulfing pattern, you first need to know what you’re looking for. It’s a simple, two-candle formation that can pack a real punch.
The first candle is a smaller green (or bullish) bar. Think of it as the last gasp from the buyers in an uptrend. Right after it comes the second candle: a big, intimidating red (or bearish) bar that completely engulfs the body of the first candle. This is your signal—a loud and clear message that sellers have just stormed the field and taken control.
Key Shape Requirements
For this pattern to have any real meaning, it must show up after a solid rally or uptrend. Context is everything.
The second candle needs to open above the first candle's close, creating a small gap up, and then close below the first candle's open. It’s this aggressive reversal that gives the pattern its power.
Here’s a quick checklist for a valid pattern:
- It’s a two-candle pattern found at the end of an uptrend.
- The second candle’s body must completely swallow the first candle’s body.
- The second candle opens higher than the first one closed, but closes lower than the first one opened.
- Its power is amplified if it appears at or near a known resistance level.
Identifying Genuine Setups
Now, not every big red candle that follows a green one is a true bearish engulfing pattern. You have to learn to filter out the noise.
Look for other clues. Is the pattern forming near a resistance zone, a key trendline, or a significant moving average? These technical levels add weight to the signal, suggesting that other traders are also seeing a reason to sell at that price.
A powerful bearish engulfing pattern doesn't just halt an uptrend; it aggressively erases the prior day's gains in one swift move, signaling a decisive shift in market control from buyers to sellers.
Annotated Chart Walkthrough
To really get the hang of this, it helps to visualize it. Think of drawing a box around the body of each candle (from the open to the close). The box for the second candle should completely cover the box for the first.
| Element | Description |
|---|---|
| First Candle | A smaller bullish bar, continuing the upward price movement. |
| Second Candle | A much larger bearish bar that fully wraps around the first candle's body. |
Here’s a pro tip: check the volume. A spike in volume on the day of the engulfing candle gives the pattern a massive boost in credibility. If you see volume jump by 50% or more, that’s a sign of real conviction from the sellers.
Common Pitfalls to Avoid
One of the biggest mistakes traders make is acting on a bearish engulfing pattern that forms on low volume. It might look perfect, but without volume to back it up, you could just be looking at random market noise.
Here are a few other traps to watch out for:
- Ignoring volume: This is a classic rookie mistake that leads to getting caught in false reversals.
- Trading in a sideways market: The pattern is a reversal signal. If there’s no clear uptrend to reverse, it's meaningless.
- Setting stops too tight: Don't place your stop-loss just a few ticks above the high of the engulfing candle. Give the trade some breathing room to account for volatility.
As a rule of thumb, make sure the volume on the engulfing day is at least 30% higher than the recent average. And to avoid jumping the gun, wait for the next candle to close below the low of the engulfing bar before entering a short position. This is your confirmation.
Practical Takeaway
When confirmed by trend, location (like resistance), and volume, the bearish engulfing pattern is one of the most reliable reversal signals in a trader's toolkit.
The best way to get comfortable with it is to pull up some historical charts and start spotting them. Mark them up. See what happened next. This kind of practice builds the pattern recognition skills you need to act decisively in a live market.
Spend time marking up old charts. It’s the fastest way to train your eyes to spot high-probability setups and build the confidence to trade them.
Understanding the Psychology Behind the Reversal
A bearish engulfing candle isn't just two bars on a chart; it's a story playing out in real-time. It’s a vivid picture of a power struggle between buyers and sellers, and to really get it, you have to understand the emotions driving the action.
Think about a stock or currency pair that's been in a solid uptrend. For days, maybe weeks, the buyers have been firmly in the driver's seat, pushing prices higher and higher. Optimism is the mood of the market. This creates the perfect setup for the first candle of our pattern—a small, bullish candle that looks like just another day of the same old uptrend.

The Dramatic Shift in Control
The real drama kicks off with the second candle. It often opens with a gap up, slightly higher than where the last candle closed. For a moment, everything looks great for the bulls. But this is a trap.
Out of nowhere, sellers storm the market with overwhelming force. They don't just halt the advance; they slam the price down so hard that it closes far below where the previous day even started. This isn't a gentle pullback. It's a brutal, decisive takeover.
The engulfing candle represents a complete psychological reversal. In just one session, the market's mood flips from greed and confidence to fear and doubt. The bears have completely wiped out the gains from the prior day and then some.
What This Means for Traders
This sudden turn of events signals a massive shift in market psychology. The bulls, who were just confidently buying, have been completely overpowered. This shockwave often triggers a cascade of selling. Traders who were comfortably long are now scrambling to get out and cut their losses.
The key emotions fueling this are:
- Bullish Complacency: Buyers get a little too comfortable, maybe a bit greedy, and start ignoring any warning signs.
- Bearish Surprise: The sellers catch everyone off guard with their aggressive attack, creating a sense of panic.
- Widespread Fear: That powerful downward move shatters the optimism, replacing it with raw fear that drives panicked selling.
Understanding this rapid flip from buying euphoria to selling pressure is what separates novice traders from experienced ones. The emotional state of the market is an incredibly powerful force. Gaining a deeper knowledge of the psychology of trading will dramatically improve how you read these patterns. When you see this story unfold on your chart, you can trade with more conviction, because you're not just trading lines—you're trading human behavior.
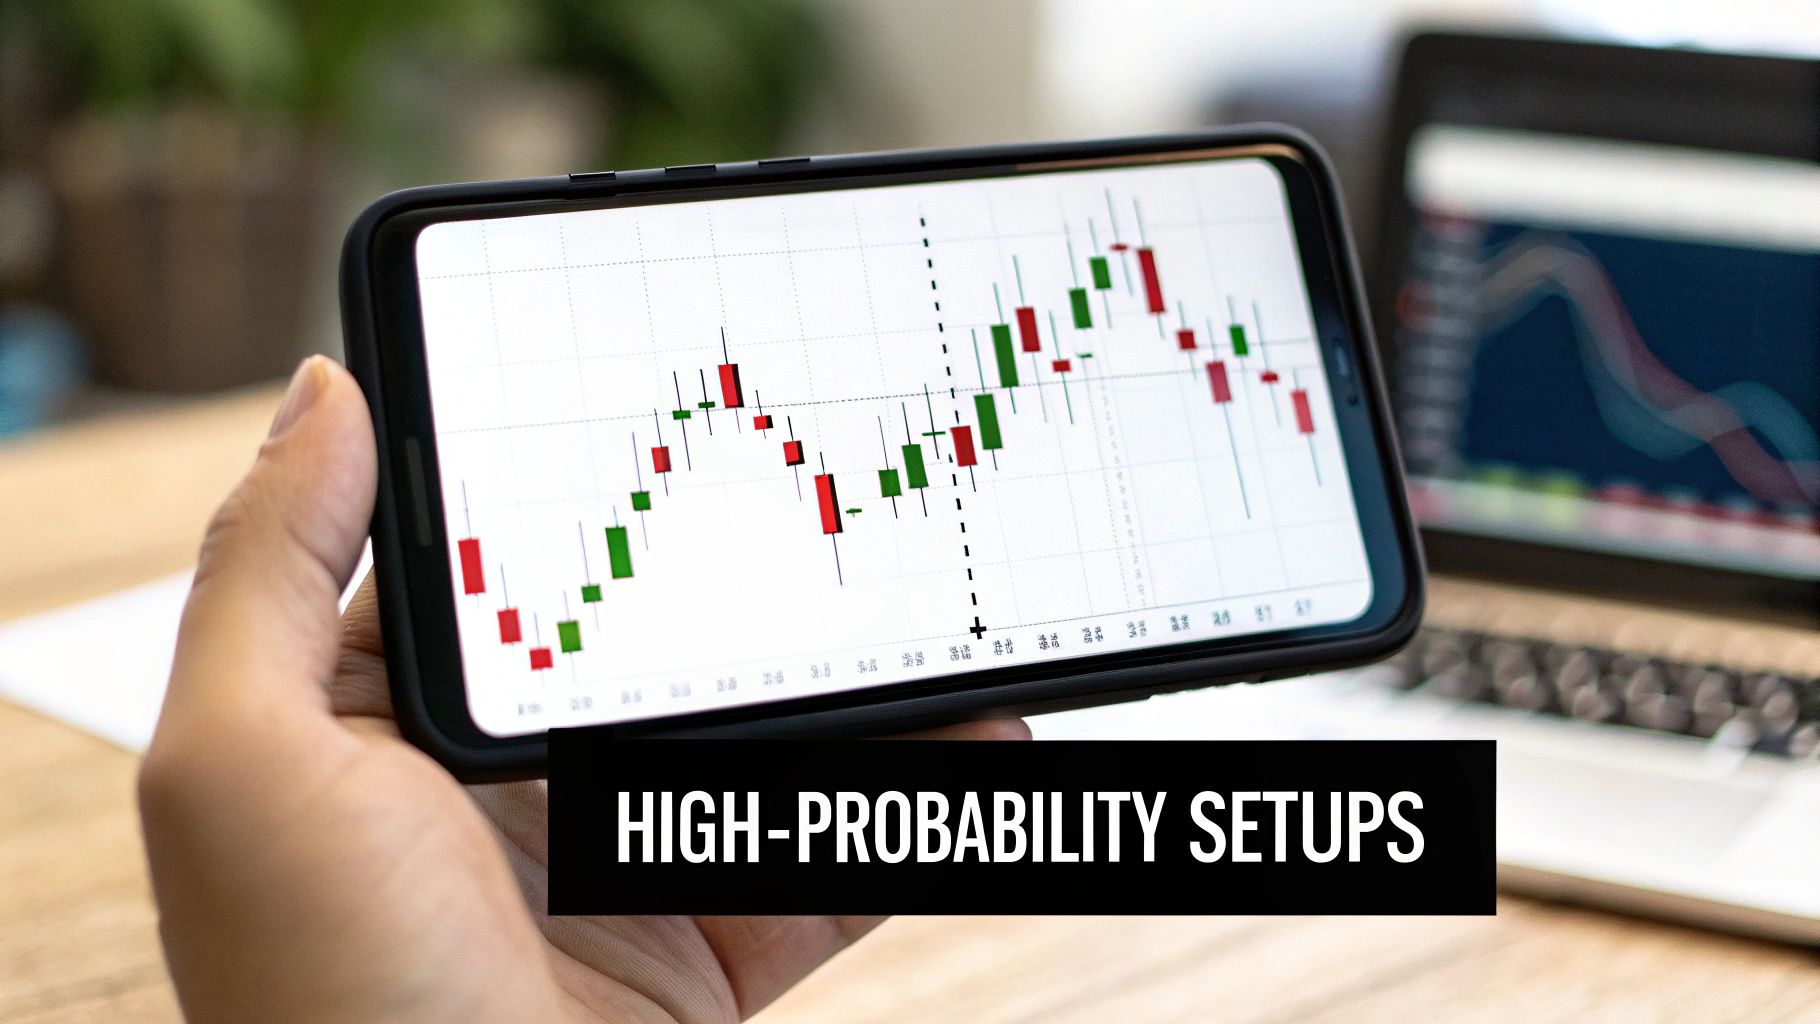
How to Spot High-Probability Bearish Engulfing Setups
Seeing a bearish engulfing candle pop up on your chart is one thing. Knowing if it's the real deal—a genuine, high-probability trade setup—is a completely different ballgame.
Let's be clear: not all bearish engulfing patterns are created equal. The ones that really count, the signals that can precede a major move, don't just appear out of nowhere. They show up within a specific market context that gives them their power.
It's like hearing a loud bang. In the middle of a fireworks show, it's just noise. But in a library? You'd jump out of your seat. Context is everything. A bearish engulfing pattern carries the most weight when it forms at the peak of a clear, sustained uptrend. Before you even start hunting for candles, you have to know how to analyze market trends to get a feel for what the market is trying to do.
The Importance of Location and Resistance
If you remember one thing, make it this: location is king. A bearish engulfing pattern that forms in the middle of a choppy, sideways market is probably just random noise. It's meaningless.
But when that same pattern appears right up against a significant technical resistance level? That’s a bright red flare telling you to pay attention.
These resistance areas are like ceilings where selling pressure has historically overwhelmed buying pressure. For a top-tier setup, look for the pattern to form at one of these critical spots:
- Previous Swing Highs: A recent peak where the price turned around and fell before.
- Major Moving Averages: Key battlegrounds like the 50-day or 200-day moving average.
- Fibonacci Retracement Levels: These are mathematically calculated zones where a reversal becomes much more likely.
When the pattern prints at one of these levels, the market isn't just hinting at a reversal. It’s screaming that sellers are stepping in at the exact place they've proven their strength before.
Waiting for Confirmation and Volume
In trading, patience pays. It’s tempting to jump in the second you see a bearish engulfing candle close, but that's a rookie mistake. Pro traders wait for confirmation.
What does that mean? It’s simple. You wait for the next candle to close below the low of the big engulfing candle. This one small step acts as a filter, weeding out many of the false signals and proving that sellers have follow-through momentum.
Volume is the other piece of the puzzle. A big spike in trading volume on the day of the engulfing candle adds a ton of credibility to the signal. High volume means conviction. It shows that a lot of traders are participating, backing the reversal with real money. A pattern that forms on weak, low volume suggests there's no real force behind the move, and it's far more likely to fizzle out.
A high-probability setup combines the right pattern (bearish engulfing), the right location (a resistance level), and the right confirmation (a lower close with high volume). Missing one of these components significantly lowers your odds of success.
While this pattern is a trader favorite, it's crucial to approach it with a data-informed mindset. Some analyses suggest its predictive power can be context-dependent. One study on major market weekly data found that after a bearish engulfing pattern, the market was actually slightly higher one week later 59.3% of the time, challenging its reputation as a surefire sell signal on longer timeframes.
Building a Bearish Engulfing Trading Strategy
Spotting a bearish engulfing pattern is a great start, but turning that observation into a consistent, profitable trade is a different ball game. For that, you need a crystal-clear, rule-based strategy. A solid plan takes the emotion out of your trading and gives you a logical framework for every move you make, from the moment you enter to the moment you exit.
This framework really comes down to three things: defining your entry trigger, setting a protective stop-loss, and knowing your take-profit target before you even click the "sell" button. Without these rules, you're not trading—you're gambling.
Defining Your Entry, Stop-Loss, and Take-Profit
A disciplined approach is everything when trading this pattern. These rules need to be ironed out before a trade is even on your radar.
-
The Entry: The temptation is to jump in right after the engulfing candle closes. Don't. A smarter entry point is to wait for confirmation. Enter a short position only after the very next candle closes below the low of the bearish engulfing candle. This proves the sellers have real momentum and aren't just faking a move.
-
The Stop-Loss: Risk management is your job number one. Always place your stop-loss just a few pips above the high of that big bearish engulfing candle. This is your line in the sand; if the price crosses it, the bearish signal is invalidated, and you get out with a small, controlled loss.
-
The Take-Profit: Decide where you’ll cash out in advance. A common tactic is to target the next major support level on the chart where buyers might step back in. Another popular method is to use a fixed risk-to-reward ratio, like 1:2. For every dollar you risk, you're aiming to make two. You can learn more about how to calculate your risk-to-reward ratio and make it a core part of your plan.
Here’s a great visual that puts this sequence into perspective.
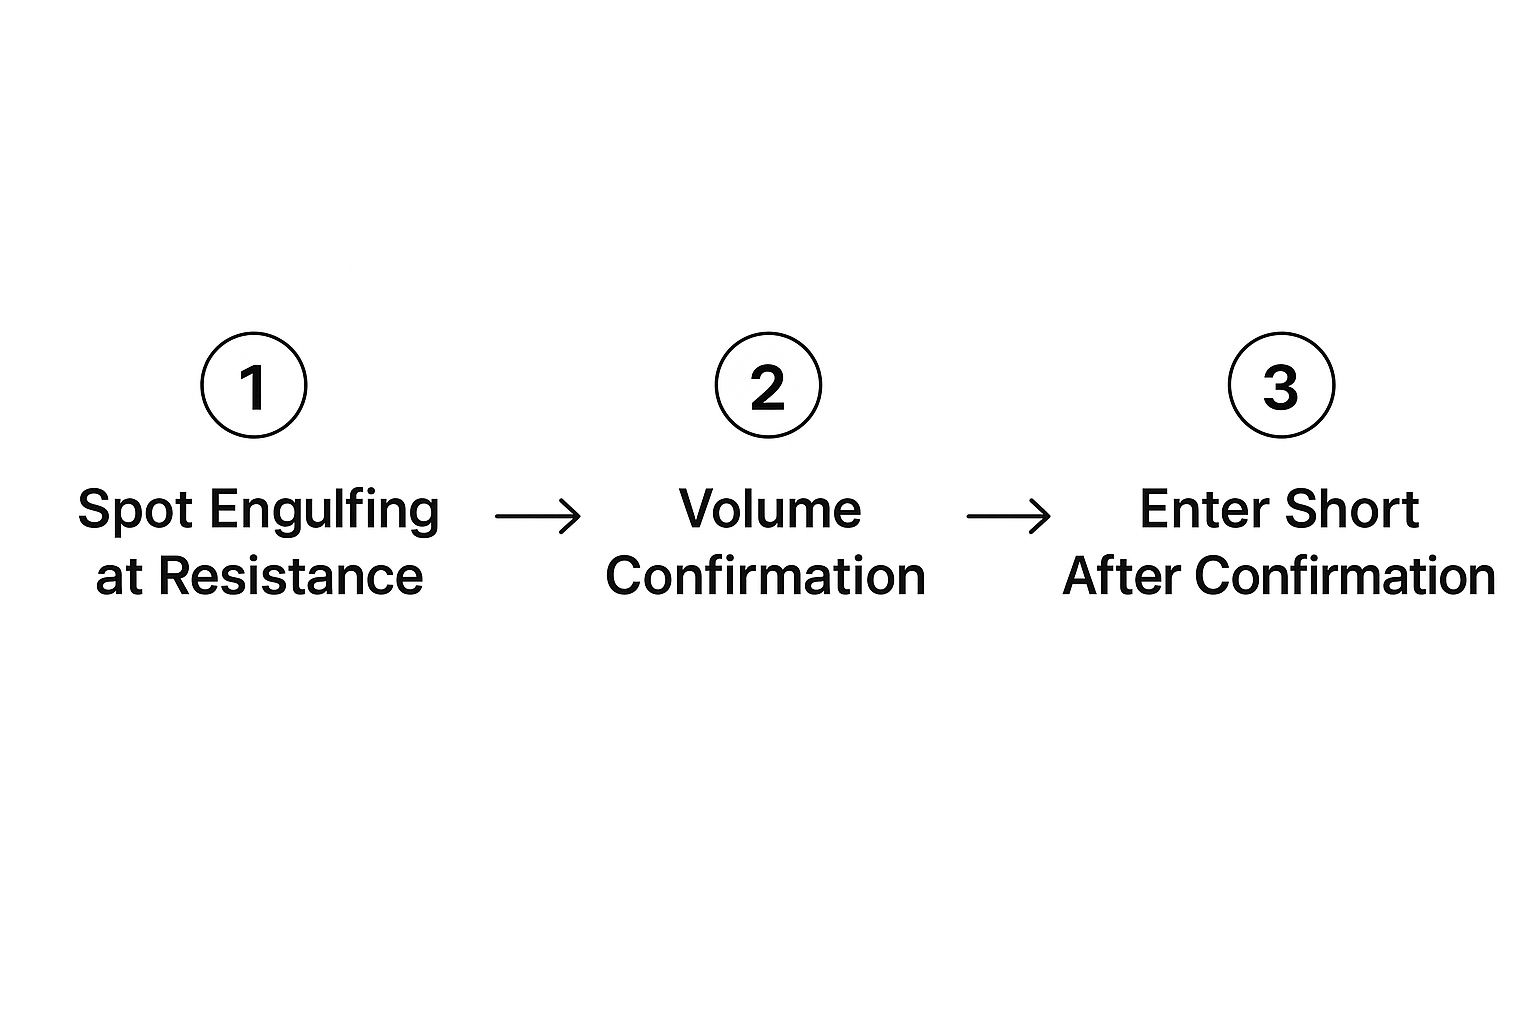
As the infographic shows, a real strategy is more than just the pattern; it’s about combining it with other clues like volume and where it appears in the trend.
Adding Confluence for Higher Probability
Trading any pattern in a vacuum is asking for trouble. To seriously stack the odds in your favor, you need to look for confluence—that's when multiple signals all point to the same conclusion.
A pattern alone is an observation. A pattern combined with multiple confirming signals is a strategy.
For instance, glance at the Relative Strength Index (RSI). If that bearish engulfing pattern forms while the RSI is screaming "overbought" (usually a reading above 70), it adds a ton of weight to the reversal signal. It tells you the uptrend was already running on fumes and was vulnerable to a turnaround.
Volume is another game-changer. A big spike in trading volume on the day the engulfing candle forms shows that sellers are jumping in with conviction. This makes the reversal signal far more trustworthy than one that appears on weak volume.
Statistical backtesting sheds some light on what to expect. An analysis by Quantified Strategies showed that while the bearish engulfing is the third most frequent pattern in the S&P 500, its average gain per trade was a modest 0.57%. However, its profit factor was a very respectable 2.7, suggesting its edge comes from being consistently right, not from hitting massive home runs.
Beyond just the pattern, incorporating general day trading tips and understanding the broader market context will sharpen your execution. By layering these elements—a solid entry/exit plan, volume confirmation, and indicator confluence—you transform a simple candlestick pattern into a powerful, repeatable trading strategy.
Common Mistakes When Trading This Pattern
In trading, knowing what not to do is often more valuable than knowing what to do. The bearish engulfing candle is a powerful signal, but it’s surrounded by common pitfalls that can easily trap new traders. Spotting these mistakes ahead of time is the first step toward trading with a more disciplined, strategic mindset.
The single biggest error? Trading the pattern in isolation. A trader sees the classic two-candle formation, gets excited about a potential reversal, and immediately jumps into a short position without any other context. This is a recipe for getting burned. A bearish engulfing pattern that just pops up randomly in a choppy market is usually nothing more than noise.
Ignoring Crucial Contextual Clues
To trade effectively, you have to learn to filter out these low-quality signals. This means paying close attention to the environment where the pattern forms. Ignoring the broader market context or nearby technical levels is a critical mistake that leads to unnecessary losses and a whole lot of frustration.
Here are a few classic blunders in this area:
- Disregarding Volume: A bearish engulfing pattern on low volume has no real conviction. It’s like a threat with no power behind it. A significant spike in volume on the engulfing day, on the other hand, confirms that sellers mean business.
- Trading on Low Timeframes: While the pattern can appear on any chart, it’s far less reliable on the really short timeframes like the 1-minute or 5-minute charts. The market noise is just too high, leading to a constant stream of false signals.
- Missing Key Levels: The pattern’s reliability skyrockets when it forms at a significant resistance level, like a previous high or a major moving average. Trading it in the middle of "no man's land" drastically reduces your odds.
Trading a candlestick pattern without considering volume and location is like trying to navigate a ship using only one star. You might see a light, but you have no idea where you are or where you're going.
Poor Risk and Trade Management
Even with a perfect setup, a trade can fall apart due to sloppy risk management. This is where many traders sabotage their own success. Committing to a trade without a clear plan for what happens next—win or lose—is simply gambling.
One of the most extensive statistical reviews of this pattern found that while it signals a bearish reversal 79% of the time, its overall performance rank is surprisingly low. What does this tell us? The initial reversal call is often right, but the downtrend that follows can be short-lived, which really highlights the need for precise trade management. You can read the full research on bearish engulfing pattern performance to understand its statistical nuances.
It's all about separating the habits of struggling traders from the disciplined practices of professionals. Let's break down what that looks like.
Trading Practices Comparison Good vs Bad
This table shows some of the most common mistakes traders make with the bearish engulfing pattern and contrasts them with the best practices that can lead to more consistent results.
| Poor Practice (Mistake) | Best Practice (Solution) |
|---|---|
| Trading the pattern in isolation. | Confirming the signal with volume and a key resistance level. |
| Setting a stop-loss too tight. | Placing the stop-loss just above the high of the engulfing candle to allow for volatility. |
| Having no clear profit target. | Defining an exit plan, such as targeting the next support level or using a 1:2 risk-to-reward ratio. |
| Risking too much on a single trade. | Adhering to strict position sizing rules, typically risking no more than 1-2% of your account. |
Ultimately, recognizing these poor practices in your own trading is the first—and most important—step toward replacing them with the habits that build a solid trading career.
Even after you’ve nailed down a strategy, it's natural to have a few lingering questions. Getting these details straight is what separates the consistently profitable traders from the crowd. Let’s clear up some of the most common questions I get about the bearish engulfing pattern.
How Reliable Is This Pattern?
Look, no candlestick pattern is a crystal ball, and the bearish engulfing is no exception. Its real power comes from where it shows up. While some studies suggest it can signal a short-term reversal up to 79% of the time, that number is meaningless without the right context.
I've found its reliability skyrockets when it appears:
- Right at a key resistance level.
- After a long, obvious uptrend.
- On a day with a big spike in trading volume.
The biggest mistake I see traders make is jumping the gun on the pattern alone. Always wait for the next candle to close below the low of the engulfing candle. That's your confirmation that sellers have real momentum and aren't just faking you out.
Is It the Same as an Outside Day?
They're similar, but the devil is in the details. An outside day is a two-day pattern where the second day's high is higher than the first, and its low is lower than the first. The key is that its closing price can be either higher or lower than its open.
A bearish engulfing pattern is a much stricter, more powerful version of a bearish outside day. The critical difference is that the body of the second candle (the bearish one) must completely swallow the body of the first candle. This sharp focus on the open-to-close range tells you there's been a decisive, aggressive shift in market psychology from buying to selling.
Can It Appear in a Downtrend?
A true bearish engulfing pattern is a reversal signal. That means its proper home is at the peak of an uptrend, signaling a potential top. If you see a similar shape forming in the middle of an established downtrend, it’s telling you a completely different story.
In a downtrend, what looks like an engulfing pattern is actually a continuation signal. It shows a quick, failed attempt by buyers to rally, which sellers immediately crush. This confirms the strength of the existing downward trend. Context is everything.
Ready to stop relying on complicated indicators and start reading the market like a pro? At Colibri Trader, we teach a straightforward, price-action approach that works in any market. Discover your trading potential with our free quiz today.