


Master the Basics of Trading: A Beginner’s Guide
At its core, the basics of trading are pretty simple: you’re buying and selling financial assets—like stocks, currencies, or commodities—hoping to profit from how their prices change. Imagine a massive, global marketplace where values are in constant motion. The real skill is learning to anticipate these moves, not just gambling on them.
Your First Step Into the Trading World
Getting started in trading can feel like learning a new language. You're hit with weird terms and charts that look like something out of a NASA control room. But honestly, the core idea is much simpler than it looks. This isn't some secret club for Wall Street insiders; it's a skill anyone can pick up if they're willing to learn the ground rules.
The journey begins the moment you realize you're not just clicking buttons. Every single trade is a decision based on what you believe an asset's price will do next. Will it go up or down? Your job is to build a reliable process for making those calls and—just as important—managing the risk when you get it wrong.
The Landscape of Opportunity
Trading happens across a few major financial markets, and each one has its own personality and quirks. You don't need to master them all at once. For now, just get a feel for the main options to see what might click with your own interests and goals.
- Stock Market: This is where you trade shares of ownership in public companies like Apple or Ford. For most people, this is the most familiar place to start.
- Foreign Exchange (Forex) Market: This is the biggest market on the planet, where you trade global currencies against each other (like the Euro versus the U.S. Dollar).
- Commodities Market: Here, you're trading in raw materials. Think gold, crude oil, or even agricultural products like corn.
- Cryptocurrency Market: A much newer and more volatile arena for trading digital assets like Bitcoin and Ethereum.
Just knowing these different playgrounds exist is the first step to finding your niche.
The goal is to go from being a spectator to an active participant—someone who makes disciplined decisions based on real information. This guide is your roadmap for that journey, starting with the absolute basics of trading.
Before we dive deeper, let's put the most critical concepts on the table. Think of these as the four pillars every new trader must understand before even thinking about placing a trade. They form the foundation for everything else you'll learn.
Core Pillars of Trading for Beginners
| Pillar | What It Is | Why It Matters for Beginners |
|---|---|---|
| Market Fundamentals | Understanding what financial markets are and how they work. | You need to know the basic rules of the game you're playing, from what a stock is to how currency pairs move. |
| Order Execution | The practical mechanics of buying and selling assets. | Knowing the difference between a market order and a limit order is non-negotiable. It's how you actually do anything. |
| Risk Management | A set of rules to protect your capital from large losses. | This is the single most important skill for survival. Without it, one bad trade can wipe you out. It's not optional. |
| Price Action Analysis | The skill of reading price charts to predict future movement. | Charts tell a story. Learning to read them helps you spot patterns and make informed decisions instead of just guessing. |
Getting a solid grip on these four areas is your first real mission as a trader. Master these, and you'll be miles ahead of most beginners.
A Roadmap for Success
I've structured this guide to build your knowledge one step at a time, so you never feel like you're in over your head. We're going to demystify this whole process, moving logically from one concept to the next. You won't just learn the "what," but the "why" behind every principle, giving you practical knowledge you can actually use.
We'll start by defining the markets, then get into the nitty-gritty of placing a trade. From there, you’ll discover the make-or-break role of risk management—I can't stress this enough. Finally, I’ll show you how to start reading the story that price charts are telling.
By the time you're done, the world of trading will feel a lot more manageable and way less mysterious. Let's get started.
Navigating the Global Financial Markets
When you first get into trading, it’s easy to think of it as one single activity. In reality, you’re stepping into a massive ecosystem of global markets. Each one has its own personality, its own rhythm, and is driven by entirely different assets and economic forces.
Figuring out these different arenas is a crucial part of learning the https://www.colibritrader.com/trading-for-beginners/, because you need to find where you fit in.
Think of it like choosing which sport to play. You wouldn’t show up to a soccer match with a basketball, right? The same logic applies here. The strategies and mindset you need to trade stocks are worlds apart from what’s required for currencies or gold. Let's break down the primary fields of play.
The Stock Market
This is the one everyone knows. When people say "trading," this is usually what comes to mind. When you trade stocks, you're buying and selling small pieces of ownership—shares—in public companies. We're talking about giants like Apple, Amazon, or Tesla. The goal is simple: profit from the ups and downs in what people believe the company is worth.
The stock market dances to the tune of corporate earnings, big industry news, economic reports, and general investor mood. It’s deeply tied to the health of the economy and how well individual businesses are doing.
The Foreign Exchange (Forex) Market
Welcome to the biggest, most liquid financial market on the planet. The forex market is where currencies are traded against each other, running 24 hours a day, five days a week. Instead of company shares, you're trading currency pairs, like the Euro versus the U.S. Dollar (EUR/USD) or the Japanese Yen versus the British Pound (GBP/JPY).
Forex trading is all about the big picture—macroeconomics on a global scale. It’s moved by things like:
- Interest rate decisions from central banks.
- Geopolitical events and shifting international relationships.
- Economic data like inflation reports and employment numbers.
Because of its sheer size, it's a favorite for traders who thrive on spotting large-scale economic trends and capitalizing on swift price movements.
The sheer scale of these markets creates immense opportunity but also highlights the complexity involved. To truly grasp the basics of trading for beginners, one must appreciate both the potential and the discipline required to succeed.
The Commodities Market
Commodities are the raw materials that literally fuel our world. In this market, you can trade physical goods like oil and gold without ever having to store a barrel or a bar in your garage.
They generally fall into two buckets:
- Hard Commodities: These are the things we mine or extract from the earth. Think gold, silver, and crude oil.
- Soft Commodities: These are agricultural products that are grown, like coffee, corn, and wheat.
Commodity prices are extremely sensitive to the classic forces of supply and demand, but also to things like weather patterns and global industrial activity. A conflict in the Middle East can send oil prices soaring, while a drought in Brazil could do the same for your morning cup of coffee.
The Cryptocurrency Market
The new kid on the block is the crypto market, home to digital assets like Bitcoin and Ethereum. This is the wild west of finance. It operates on decentralized blockchain technology, completely outside of traditional banks and governments.
This market is famous for its extreme volatility, driven by everything from tech breakthroughs and regulatory crackdowns to pure social media hype. While it offers the potential for eye-watering returns, the risk is just as high. And because it's always on—24/7—the action never stops.
The global stock market alone was valued at an estimated $51.61 trillion in 2025, which gives you a sense of the massive scale and opportunity out there. But that number also shows how complex this world is, with countless assets all influencing each other. Learn more about the factors shaping global market dynamics.
The Practical Mechanics of a Trade
Thinking about financial markets is one thing, but actually placing a trade? That's where theory gets real. This is the hands-on part of trading—the moment you turn an idea into an actual position in the market. It might feel like a huge step, but the whole process is built on just a few core concepts.
At its heart, every trade you make is a bet on where you think an asset's price is headed. You’re either calling for it to go up or predicting it will go down. That simple choice splits all trading into two main directions.
Going Long Versus Going Short
When most people first imagine trading, they're picturing going long. It’s the classic, intuitive move: you buy something because you think its value is about to increase. If you're right, you sell it later for a higher price and pocket the difference.
Let's say you believe a company is on the verge of releasing a killer earnings report. You decide to buy 10 shares of its stock at $50 per share, putting down $500. A week later, the report is a smash hit, and the stock price soars to $60. You sell your shares, making a clean profit of $10 per share, or $100 total. That's a textbook long trade.
But what if you see a stock that you think is completely overpriced and headed for a fall? This is where going short comes into play. It’s less intuitive, but it's a critical tool in a trader's arsenal.
When you short a stock, your broker lends you shares you don't own. You immediately sell those borrowed shares at the current market price. Your goal is to wait for the price to drop, buy the exact same number of shares back at the new, lower price, and return them to your broker. The difference is your profit.
Imagine you see a stock trading at $100 that you feel is massively overvalued. You short 10 shares, selling them for $1,000. A week later, as you predicted, the price tumbles to $80. You can now buy those 10 shares back for just $800 to return to your broker, netting a $200 profit. Going short is how you find opportunities even in a falling market.
Placing Your Order The Smart Way
Once you’ve picked your direction (long or short), you have to tell your broker how to execute the trade. You do this using an order. The two most common types you’ll use constantly are the market order and the limit order.
-
Market Order: This is the "get me in now" button. A market order instructs your broker to buy or sell immediately at the best price currently available. It’s the fastest way to enter a trade, guaranteeing your order gets filled. The trade-off? You don't have control over the exact price you get.
-
Limit Order: This order puts you in control of the price. A limit order tells your broker to only buy or sell at a specific price or better. If a stock is trading at $50 but you only want to buy it at $49.50, you set a limit order. Your trade will only execute if the price drops to your level. It’s great for preventing you from overpaying, but there's no guarantee the price will ever hit your target, meaning your order might never get filled.
Your order type is your first line of defense in managing how you enter a trade. Choosing between speed and price control is one of the first strategic decisions you'll make.
Your Most Important Order: The Stop-Loss
Market and limit orders get you into a trade. The stop-loss order is your non-negotiable tool for getting out if a trade goes against you. For any serious trader, this is the single most important order for managing risk.
A stop-loss is a standing instruction you give your broker to automatically sell your position if the price drops to a specific level. It's your safety net.
Think about it: if you go long on a stock at $50, you can place a stop-loss at $48. If the stock suddenly tanks, your broker will automatically sell your shares once the price hits $48. This move caps your loss at $2 per share and protects your capital from a complete disaster.
Learning to use a stop-loss on every single trade isn't just a good habit—it's what keeps you in the game long enough to succeed.
Understanding Market Psychology and Behavior
It’s easy to think that financial markets run on cold, hard data. In reality, they're powered by something far less predictable: human emotion. The price you see flashing on a chart isn't just a number; it's the real-time result of millions of people making decisions based on two overwhelming feelings—greed and fear.
Getting a handle on this is one of the most critical lessons in the basics of trading. At any given moment, the market is a mirror reflecting the collective mindset of every single participant. When optimism is high, people buy eagerly, and prices climb. When pessimism takes over, fear sparks a sell-off, and prices fall.
These two forces are so fundamental to trading that they have their own mascots.
The Battle Between Bulls and Bears
You'll hear traders talk endlessly about "bull" and "bear" markets. These aren't just quirky terms; they describe the primary trend and the emotional tide of the market over a long period.
-
Bull Market: This is a period of widespread optimism and confidence. The economy is usually humming along, and asset prices are locked in a sustained uptrend. Bulls are the buyers, charging forward and driving prices higher.
-
Bear Market: A bear market is the complete opposite. It's a time of pessimism and anxiety, where investors expect losses, and heavy selling pressure pushes prices down. Officially, a bear market kicks in after a price decline of 20% or more from recent highs. Bears are the sellers, swiping prices downward.
Knowing which type of market you’re in is absolutely crucial. A strategy that prints money in a bull market can get you wrecked in a bear market.
"Bull markets are born on pessimism, grow on skepticism, mature on optimism, and die on euphoria."
— Sir John Templeton
This legendary quote from Sir John Templeton perfectly captures the cyclical nature of market psychology. It reminds us that market trends aren't random. They are emotional cycles that swing from one extreme to the other. Your job as a trader isn't to get swept up in the emotion, but to figure out where we are in that cycle.
Resisting Emotional Trading Traps
Because markets are fueled by human emotion, it's incredibly easy to fall into psychological traps. The two biggest culprits are FOMO (Fear Of Missing Out) and panic selling.
FOMO is what happens when you see an asset going parabolic and you jump in, terrified of missing out on easy profits. This almost always leads to buying at the absolute peak, right before the party ends and the price collapses. It’s a decision driven by pure greed, not a solid plan.
Panic selling is its evil twin. When the market takes a nosedive, the fear of losing it all can make you dump your positions at the worst possible time—right at the bottom. This is a decision driven by pure fear.
The only way to build a lasting career in trading is to create a trading plan and follow it with iron-clad discipline. Let your rules, not your feelings, make your decisions. This idea is central to market psychology. It helps you know when to get in or out, especially when you see a broader trend playing out.
For example, the powerful bull run in stocks leading into 2025 showed exactly how these cycles work. After the S&P 500 posted huge gains for two years straight, people naturally started worrying that things were getting overheated. But historically, the third year of a bull run often brings more modest, grinding gains. This reflects a "mature" market where investor optimism is resilient enough to fight off negatives like higher interest rates, just as Templeton described. You can read the full analysis on 2025 market outlooks to see this concept in action.
Mastering the Core Principles of Risk Management
If you take only one lesson away from this guide, I want it to be this one. The single biggest difference between a trader who lasts a few months and one who builds a career isn't some mystical gift for predicting the future. It’s an obsessive, disciplined focus on risk management.
I’ve seen it time and time again: long-term success has little to do with winning every trade. It’s about making sure your losses are small and your wins are big enough to matter. This is the defense-first mindset that separates the pros from the amateurs. Before you even think about profits, you have to learn how to protect your trading capital. No capital, no trading. It's really that simple.
Let's walk through two non-negotiable rules that form the absolute bedrock of this defensive strategy.
The 1% Rule: Your Ultimate Safety Net
The first and most critical rule for survival is the 1% rule. The principle is brilliantly simple: you should never risk more than 1% of your total trading account on any single trade.
Imagine you have a $5,000 trading account. Applying the 1% rule means the absolute maximum you can afford to lose on one trade is $50. This isn't just a friendly suggestion; it's a mathematical shield. It makes it practically impossible for one bad decision or an unlucky streak to wipe you out.
Even if you lose ten trades in a row—and trust me, it happens to everyone—you’ve only lost 10% of your account. You can recover from that. Without this rule, a single catastrophic loss could end your trading journey before it even gets off the ground.
This image breaks down how concepts like position sizing and stop-loss orders all work together to achieve one goal: protecting your capital.
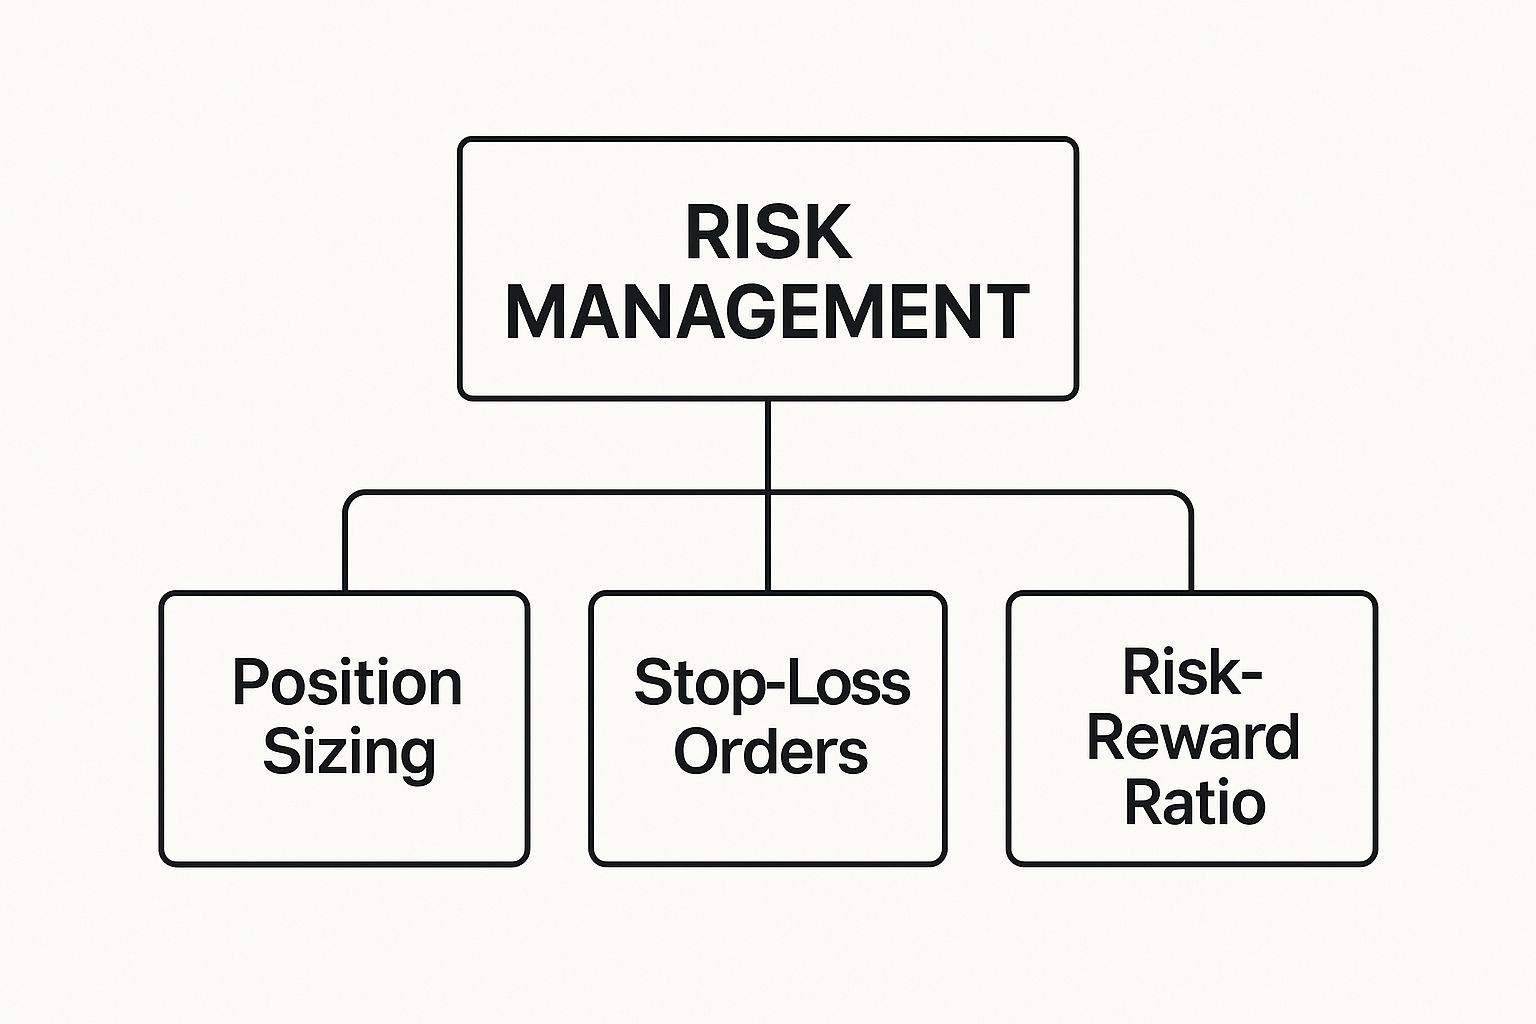
As you can see, everything starts with overall risk management. From there, you decide how much to risk, where you’ll get out if you're wrong, and whether the potential reward justifies taking the trade in the first place.
Calculating Your Risk-to-Reward Ratio
Once you’ve limited your potential downside with the 1% rule, the next move is to make sure your potential upside is actually worth the risk. This is where the risk-to-reward ratio comes into play. It’s a straightforward comparison between what you stand to lose if you’re wrong and what you stand to gain if you’re right.
Professionals almost always look for trades where the potential reward is at least twice the potential risk—a 1:2 ratio or, even better, higher.
Let's make this real with an example:
- You decide to buy a stock at $100.
- You place your stop-loss order at $98, which means you're risking $2 per share.
- You set your take-profit target at $106, aiming for a $6 gain per share.
In this scenario, you're risking $2 to make a potential $6. That's a risk-to-reward ratio of 1:3. This is an incredibly powerful concept because it means you don't even need to be right half the time to be profitable.
To see how this works in practice, look at the table below. It shows that with a strong risk-reward ratio, a trader can be profitable even if they lose more trades than they win.
Risk-Reward Ratio Scenarios
| Scenario | Risk per Trade | Reward per Trade | Win Rate | Profit/Loss over 10 Trades (6 Losses, 4 Wins) |
|---|---|---|---|---|
| 1:1 Ratio | $50 | $50 | 40% | -$100 (6 x -$50 + 4 x $50) |
| 1:2 Ratio | $50 | $100 | 40% | +$100 (6 x -$50 + 4 x $100) |
| 1:3 Ratio | $50 | $150 | 40% | +$300 (6 x -$50 + 4 x $150) |
As the numbers clearly show, a favorable risk-reward ratio completely changes the game. It allows your winning trades to more than cover your small, controlled losses, pushing your account forward over time.
For traders looking to go deeper, there are plenty of great resources that explore this topic. For a more detailed look, you can check out this guide on managing trading risk that covers these principles with more examples and strategies.
By combining the 1% rule with a favorable risk-to-reward ratio, you build a robust trading framework. You cap your downside on every single trade while giving your upside serious potential. This two-pronged approach builds discipline and, more importantly, turns trading from a reckless gamble into a calculated business.
How to Read the Story of a Price Chart

A price chart is the trader’s most fundamental tool, but don't let its simplicity fool you. It’s not just a bunch of lines and bars; it’s a living record of the constant tug-of-war between buyers (demand) and sellers (supply).
Learning to read a chart is like learning to read the market's body language. It gives you a massive edge in understanding where the price might be headed next. This skill is the very foundation of technical analysis—the practice of forecasting price movements by studying what price has done in the past. Instead of digging through financial reports, you're focused entirely on the story the chart is telling you.
For most of us modern traders, that story is told through Japanese candlesticks.
Decoding Japanese Candlesticks
Each candlestick on a chart tells you what happened to the price over a specific chunk of time—whether that's one minute, one hour, or one day. It packs four crucial pieces of information into one simple shape.
- The Body: This is the thick, rectangular part. It shows the distance between the opening price and the closing price for that period.
- The Color: A green (or white) body means the price closed higher than it opened. That's a win for the buyers. A red (or black) body means the price closed lower than it opened—a clear win for the sellers.
- The Wicks: These are the thin lines sticking out from the top and bottom of the body. They reveal the absolute highest and lowest prices the asset hit during that period.
A long, solid green body with tiny wicks shouts strong, confident buying pressure. On the flip side, a long, imposing red body tells you sellers were firmly in control. This is the basic grammar of chart reading, and you can get a deeper dive in our dedicated guide on how to learn to read stock charts.
Finding Support and Resistance Levels
Once you can read the individual candles, you can start to see the bigger picture. Two of the most important concepts you'll ever learn are support and resistance. Think of them as a floor and a ceiling that contain the price.
Support is a price level where a downtrend is expected to pause or reverse. This is the "floor" where a concentration of buyers tends to show up, pushing prices back up.
Resistance is the opposite. It's a "ceiling" where an uptrend is likely to stall because sellers are waiting to take control and push prices back down. Spotting these zones on your chart is crucial for finding strategic areas to enter or exit your trades.
Understanding these levels is critical because they represent key psychological battlegrounds between buyers and sellers. When a price finally breaks through a strong resistance level, that old ceiling often transforms into a new support floor.
Identifying the Prevailing Market Trend
Finally, by zooming out and looking at the chart over a longer period, you can identify the market's overall direction. This is called the trend, and it's arguably the most important piece of information a chart can give you. There are really only three types of trends:
- Uptrend: A series of higher highs and higher lows. This is a bull market where buyers are clearly in control.
- Downtrend: A series of lower highs and lower lows. This is a bear market where sellers are dominating the action.
- Sideways (or Ranging) Market: Price is just bouncing between a clear support and resistance level, with no real direction.
As a new trader, your primary goal should be to identify the main trend and trade with it. The old saying, "The trend is your friend," has stuck around for a reason. By learning to read candlesticks, spot support and resistance, and identify the trend, you turn a confusing chart into a clear map of market opportunities.
Answering Your Key Trading Questions
As you start piecing these concepts together, it's completely normal for a few big questions to bubble up. Tackling these common uncertainties head-on is a huge part of your learning curve. It's how you build real confidence and move forward with a solid foundation.
Let's dive into some of the most frequent questions I hear from beginners. Getting these answers straight will help you set realistic expectations and start your trading journey on the right foot.
How Much Money Do I Need to Start Trading?
There’s no magic number here, and the real answer depends on the market you trade and the broker you choose. The most important rule, and one you should never forget, is to only trade with capital you are fully prepared to lose. This isn't just a friendly suggestion; it's a core principle that protects you from financial ruin.
I always advise new traders to start small, maybe with just a few hundred dollars. In the beginning, your goal isn’t to get rich. It's to get your hands dirty with real-world experience, master your strategy, and nail down your risk management in a live market—all without taking a major financial hit. Once you can prove to yourself that you can be consistently profitable on a small scale, then you can think about adding more capital to your account.
What Is the Difference Between Trading and Investing?
The main distinction really just boils down to one simple factor: time.
- Investing is the long game. We're talking about building wealth over years, sometimes even decades. Investors buy assets like stocks and hold them, focusing on the company's fundamental health and long-term growth potential.
- Trading is a much faster-paced activity. It’s all about buying and selling more frequently to profit from price swings that happen over minutes, hours, days, or weeks. Traders tend to lean heavily on technical analysis and reading market sentiment to make their moves.
Can I Really Teach Myself to Trade?
Absolutely. With the incredible amount of quality information out there today—from in-depth articles like this to books and demo accounts—teaching yourself has never been more possible. Success in trading isn't about having a special degree or a background in finance. It comes down to your commitment to learn, your discipline, and your patience.
The path to becoming a successful trader is paved with continuous education and disciplined practice. Start with the fundamentals, develop a clear trading plan, and test your strategies extensively on a paper trading account before putting any real money on the line.
This structured approach is the smartest way to learn. It lets you build experience and make all the classic beginner mistakes without any of the financial pain.
At Colibri Trader, my specialty is turning dedicated learners into confident, disciplined traders. My action-based programs cut straight through the noise, focusing on the price action strategies that actually work. Find out where you stand and how I can help by taking our free Trading Potential Quiz. Start your journey with Colibri Trader today.