




Ascending Channel: A Price Action Trader’s Guide
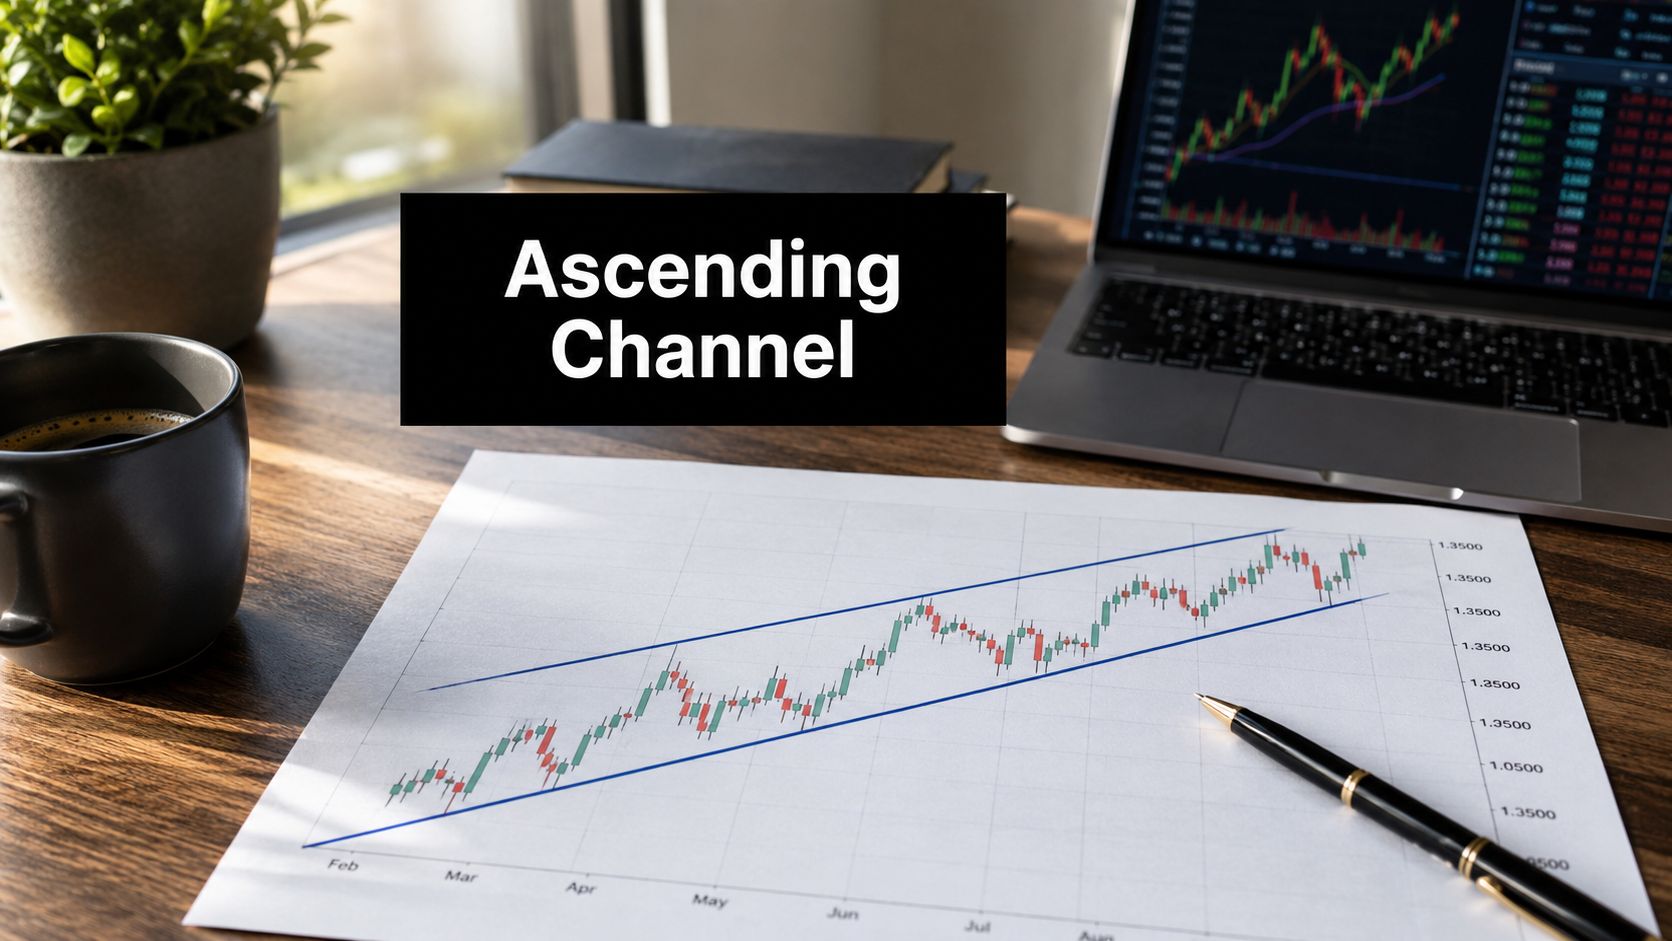
You're probably looking at a chart that keeps grinding higher, tapping a rising support line, then stalling at a rising ceiling. Most traders see that and think one thing: bullish continuation.
That's only half the story.
The ascending channel is one of the cleanest price action patterns on the chart, but it also traps traders who assume “uptrend” automatically means “buy every breakout.” If you trade it that way, you'll eventually learn the hard lesson this pattern teaches over and over. A market can look orderly, bullish, and healthy right before it breaks lower.
The good news is that this pattern gives you structure. It gives you repeatable trade locations. It gives you clear invalidation. And if you read it properly, it can help you trade both continuation and reversal without guessing.
What an Ascending Channel Reveals About Market Psychology
An ascending channel is a bullish price pattern made up of higher highs and higher lows contained within two parallel, upward-sloping trendlines. It's recognized across stocks, bonds, and forex as a sign of an established, range-bound uptrend, as outlined in Investopedia's definition of the ascending channel.
That definition matters, but the psychology matters more.
When you draw an ascending channel on a chart, you're really mapping an agreement between buyers and sellers. Buyers are confident enough to step in at progressively higher prices. Sellers are still active enough to cap price near the upper boundary. So price doesn't run freely. It climbs in a controlled rhythm.

What the lower line is telling you
The lower trendline is more than support. It shows where demand keeps showing up.
Each time price pulls back into that line and buyers defend it, the market tells you something useful. Buyers believe value exists at higher and higher levels. They're not waiting for a deep discount. They're stepping in earlier.
That's why the lower boundary often becomes the decision zone. If buyers defend it again, the trend stays intact. If they stop defending it, the character of the move changes fast.
What the upper line is telling you
The upper trendline marks a recurring area where sellers take profits or new sellers test the market. That doesn't make the trend bearish. It means the uptrend still has friction.
A lot of newer traders misunderstand this. They see repeated rejection at the top of the channel and assume the pattern is weak. It isn't weak by default. It's balanced. The market is rising, but it's rising inside a framework.
Practical rule: Don't think of the channel as “price going up.” Think of it as “price going up, but only as long as buyers keep accepting higher support.”
That shift in thinking helps you read context instead of memorizing shapes.
Why this psychology matters in real trades
An ascending channel works best when you understand where control sits. Near the lower boundary, buyers have recently proved themselves. Near the upper boundary, supply has recently shown up. In the middle, neither side has a clean edge.
This is why many bad trades come from entries in the center of the channel. You're paying too much to buy support and too early to short resistance. You're trading noise instead of structure.
If you're still shaky on how price swings create trend context, study market structure in this guide from Colibri Trader. The channel makes much more sense once you can read higher highs and higher lows as behavior, not just lines.
How to Draw and Validate Channels Like a Pro
Most traders don't struggle with spotting an ascending channel. They struggle with drawing one that's tradable.
A sloppy channel can justify almost any opinion. A clean one gives you clear decision points. That's the difference.

Start with support, not resistance
Draw the lower trendline first.
Use the swing lows that clearly stand out on the chart. You want the line to connect the rising lows that attracted buyers, not random intrabar noise. Once that lower line is in place, project a parallel line upward to align with the swing highs.
That order matters. Support usually tells the cleaner story in an ascending channel because it shows where buyers repeatedly commit.
What a valid channel looks like
A tradable ascending channel usually has a few traits:
- Parallel boundaries: The upper and lower lines should move together. If they converge, you may be looking at a different pattern.
- Visible oscillation: Price should move from one side of the channel toward the other in a reasonably orderly way.
- Moderate slope: A channel that climbs too aggressively often becomes unstable and prone to sharp failure.
- Respect for both rails: The more cleanly price reacts to both boundaries, the more useful the channel becomes.
Discretion comes into play. Price action trading isn't drafting. You're not forcing the market into a geometric template. You're identifying repeated behavior.
Use touch quality, not line perfection
Many traders obsess over whether every wick touches exactly. That's the wrong focus.
You're looking for reaction, not mathematical beauty. If price consistently turns near the same rising support and near the same rising resistance, the market is respecting the structure. Small overshoots and undershoots are normal.
A simple checklist helps:
- Mark two clear swing lows to anchor the support line.
- Clone the angle upward to frame the swing highs.
- Look for repeated reactions near both boundaries.
- Reject channels that need constant adjusting to stay valid.
A good channel feels obvious after you draw it. If you have to explain it too hard, it probably isn't clean enough.
When to trust it and when to skip it
The channels worth trading tend to look organized. The ones worth skipping usually have one of three problems.
| Situation | What it usually means |
|---|---|
| Very steep slope | The trend may be overextended and unstable |
| Weak reactions at boundaries | Price may be drifting, not respecting a real channel |
| Messy overlap and erratic wicks | Structure is unclear, so risk placement gets sloppy |
If your lines keep changing with every new candle, step back. The best setups rarely require creative drawing.
For more detail on anchoring and refining trendlines, review this Colibri Trader guide on trading with trend lines. The same habits that improve plain trendline work also improve channel work.
Four Actionable Setups for Trading the Channel
You're watching price grind higher inside a clean rising channel. The easy conclusion is “bullish pattern, buy the breakout.” That assumption catches a lot of traders on the wrong side of the move.
An ascending channel can offer four real trades. Two come from the swings inside the structure. Two come from the move that ends it. The edge comes from recognizing that the bearish resolution deserves at least as much respect as the bullish one.

Buying the support bounce
This is usually the best location trade in the pattern.
Price tests the lower rail, sellers push, and then the push stalls. You want to see buyers defend that area with clear rejection, tighter downside follow-through, or a fast reclaim after a brief undercut. That gives you an entry close to the point where the setup is invalid.
The trade-off is simple. You get the best price, but less confirmation than you get on a breakout. That means support bounces work best in channels that are orderly, moderate in slope, and already respected on multiple touches.
Shorting the resistance rejection
This setup is underused, which is a mistake.
A rising channel can still produce clean two-way swings. If price repeatedly tags the upper boundary and fades, that upper rail is a place where short-term sellers have been getting paid. You are not calling the end of the trend. You are trading the rotation back toward the middle of the channel or down to support.
The best rejections usually show some loss of force. Price reaches the upper rail in a choppy climb, candles narrow out, or breakout attempts fail to hold above prior highs. That kind of action often signals exhaustion, not strength.
Buying the upside breakout
The long breakout is valid. It just gets overhyped.
A good upside break usually leaves the channel cleanly and does not spend much time drifting around the upper rail. Strong closes, expanding range, and immediate acceptance above resistance matter more than a quick poke through the line.
You are paying a higher price for better confirmation. Sometimes that is the right decision, especially when the market has been compressing near the top of the channel before release. Sometimes it means buying the final push before a failure back into the structure.
Shorting the downside breakdown
This is the setup many traders avoid, even though it often deserves top billing.
Thomas Bulkowski's testing, summarized in the thepatternsite.com ascending channel study, found downward breakouts occur more often than upward ones in ascending channels. That lines up with what experienced traders see on charts. A rising structure can attract late buyers, then unwind fast once the lower rail gives way.
The psychology is practical. As long as the lower boundary holds, buyers can keep defending higher lows. Once that support breaks, trapped longs start selling, breakout buyers lose conviction, and short sellers finally have a clean trigger. That shift can produce a sharper move than the earlier climb.
Treat the ascending channel as a two-sided pattern with a bearish bias on resolution, not as an automatic long setup.
Picking the right setup for the chart in front of you
Match the trade to the behavior at the boundary.
- Choose the support bounce when the lower rail keeps producing decisive bullish reactions.
- Choose the resistance rejection when price reaches the upper rail stretched and hesitant.
- Choose the upside breakout when price closes above resistance and holds there.
- Choose the downside breakdown when support fails and the market cannot reclaim the channel quickly.
Good channel traders stay flexible. We are not predicting what the pattern should do. We are reading which side is winning at the level that matters.
Precision Trading Rules for Entry Exit and Risk
A good pattern doesn't pay you. Good execution does.
Traders differentiate themselves. They stop treating the ascending channel like a picture and start treating it like a trade plan with exact decision points.

Entries that make sense
For support bounces and resistance rejections, the best entries usually come after price reacts at the boundary, not before. Let the chart show rejection first. If you buy support while the candle is still driving down, you're guessing. If you short resistance while buyers are still pressing, same problem.
For breakouts and breakdowns, insist on a close outside the channel. In a bearish break, the close below support matters because it shows price didn't just probe the line. It accepted lower ground.
A practical way to think about entries:
| Setup | Better trigger |
|---|---|
| Support bounce | Rejection from lower rail, then bullish follow-through |
| Resistance rejection | Failure at upper rail, then bearish follow-through |
| Breakout up | Decisive close above upper rail |
| Breakdown down | Decisive close below lower rail |
Stop placement that respects the pattern
Stops should sit where the setup is clearly wrong.
For a support bounce, that's generally below the support area that triggered the trade. For a resistance rejection, it's above the rejection area. For an upside breakout, the stop often belongs under the breakout structure or the trigger swing low. For a downside breakdown, it often belongs above the breakdown structure or above the failed reclaim area.
The mistake is placing stops so tight that normal channel noise knocks you out. The other mistake is placing them so wide that the pattern no longer gives you useful risk.
Execution note: If your stop can't be placed at a logical invalidation point without making the trade unattractive, skip the trade.
That one rule saves a lot of bad decisions.
Profit targets for the bearish break
The downside break deserves a more precise approach because that's where many traders exit too early.
For a breakdown from an ascending channel, a high-probability target benchmark is 2.0 to 3.0 times the channel height, projected downward from the support breach, based on this ascending channel breakdown framework. The channel height is the vertical distance between support and resistance.
That target matters because bearish breaks can accelerate once the structure fails. If you cut the trade too quickly, you often capture the least interesting part of the move.
This walkthrough can help if you want to see chart-based examples of trade management in action:
Managing the trade after entry
A plan is easier to follow when you define what would make you hold and what would make you reduce exposure.
- Hold the trade when price continues to respect the break or rejection.
- Reduce risk when price reaches a logical reaction area and starts stalling.
- Exit fast if the market invalidates the reason you entered.
- Trail intelligently when the move starts extending and structure forms in your favor.
A lot of traders think risk management starts with stop-loss placement. It starts earlier. It starts with refusing mediocre entries in the middle of the channel.
Distinguishing Real Breakouts from Costly Traps
The most expensive ascending channel mistakes usually come from one habit. Chasing the first move outside the line.
A breakout looks exciting because it feels like confirmation. But not every push beyond the boundary means anything. Some are just liquidity grabs. Some are exhaustion. Some are traps built on weak participation.
Use volume as a lie detector
The cleanest warning sign is weak volume.
The data behind this pattern points to a simple truth. Low volume on a breakout is a “massive glowing red flag” that indicates a trap, and one emerging way traders validate the move is through volume profile, looking for a high-volume node at the breakout point, as discussed in this guide on ascending channel fakeouts and volume confirmation.
That lines up with how experienced price action traders think. A breakout should attract participation. If price leaks outside the channel with no real commitment behind it, the move is vulnerable.
What a trap often looks like on the chart
A fake breakout usually has a familiar sequence:
- Price pokes outside the channel and draws attention.
- Breakout traders jump in early because the pattern looks obvious.
- Follow-through stalls quickly instead of expanding.
- Price slips back inside the channel and traps late entries.
This matters more on the first retest. If the market can't hold outside the broken boundary, the original break is suspect.
A strong move tends to look firm after the break. A weak move tends to look apologetic.
Don't confuse an ascending channel with a rising wedge
This is another common problem. Traders label everything with rising highs and rising lows as an ascending channel.
That's dangerous because a rising wedge behaves differently. In a wedge, the boundaries converge. The structure tightens. In an ascending channel, the boundaries stay parallel. That difference changes how you interpret pressure building inside the pattern.
Here's a quick comparison:
| Pattern | Boundary shape | Trading implication |
|---|---|---|
| Ascending channel | Parallel rising lines | Tradable range with possible breakout or breakdown |
| Rising wedge | Converging rising lines | Compression pattern with different pressure dynamics |
If your lines are pinching together, don't trade it like a clean channel.
A breakout is not confirmed because price crossed a line. It's confirmed when price leaves the line and behaves like it belongs outside it.
For traders who want to sharpen this side of the game, this bear trap trading guide from Colibri Trader is worth studying. The same logic that helps you avoid false downside breaks also helps you avoid low-quality channel signals in general.
Adapting Your Strategy Across Timeframes and Markets
You spot the same rising channel on a 5-minute chart and on a daily chart. The lines look nearly identical. The trade does not.
On lower timeframes, the pattern moves with less forgiveness. Price can tag support, bounce, fail, and reverse before you have time to second-guess the entry. On higher timeframes, the structure is usually cleaner, but the stop is wider, the hold is longer, and the pullbacks test your patience more than your trigger finger.
That changes how we trade it.
A day trader can use an ascending channel as a working framework for quick support bounces, resistance fades, and breakdown continuation. A swing trader usually cares more about whether the channel is advancing into overhead resistance, losing momentum, or setting up a downside failure after an extended move. A position trader may treat the channel less as an entry pattern and more as a way to judge trend quality and where the trend is vulnerable.
The pattern stays the same. The job you assign it changes.
A practical way to adjust by timeframe looks like this:
- Lower timeframes: Favor clean boundaries, quick confirmation, and fast exits when price hesitates.
- Mid timeframes: Look for the best mix of structure, tradable swings, and reasonable stop distance.
- Higher timeframes: Put more weight on context, major levels, and whether a break can carry far enough to justify the wider risk.
Market type matters too. In stocks, gaps can break the structure before the open gives you a fair entry. In forex, session shifts can turn a clean channel into noise for a few hours. In crypto, the pattern can stay orderly longer than expected, then fail hard once liquidity thins out. The channel is only part of the trade. Volatility, session behavior, and execution conditions decide whether the setup is usable.
Many traders get trapped by the name of the pattern. An ascending channel looks bullish while it is climbing, so they keep hunting only for upper boundary breaks. In practice, that mindset is too narrow. As noted earlier, downside breaks are common enough that you should plan for them first, especially when the channel is grinding higher with weak momentum or repeatedly rejecting at the top line.
That shift improves trade selection fast.
Instead of asking, "How do I catch the bullish breakout?" ask, "Is this channel still being accumulated, or is it walking upward into a reversal?" On intraday charts, that question can keep you out of chasing late longs. On swing charts, it can put you in front of the better move, which is often the break lower after the channel has done its job of pulling buyers in.
Backtest the version you trade.
If you trade Nasdaq futures, test Nasdaq futures. If you trade large-cap stocks, use stock data with gaps and earnings reactions included. If your entries come from 15-minute closes, do not judge the setup from daily chart examples. Small changes in confirmation rules can completely change whether the pattern has an edge in your hands.
One habit worth keeping is a screenshot library of channels you traded well, channels you forced, and channels that broke the opposite way from what the structure seemed to promise. Some traders turn those reviews into narrated clips or generate studio-quality videos for private journals and team debriefs. That makes it easier to study the exact shape of the channel, the quality of the retest, and whether the failure gave warning before the break.
Use the ascending channel as a framework, not a prediction. Read the slope, test the quality of each touch, and stay open to the bearish outcome even while price is still rising.
If you want to build that kind of disciplined price action skill, Colibri Trader is a strong place to start. It focuses on clear, practical trading education built around price action, risk control, and repeatable execution, which is exactly what traders need when turning patterns like the ascending channel into a real strategy.