
Day Trading Explained: How It Works and Whether It Pays
You've probably seen the screenshots. Someone buys a stock at the open, sells it less than an hour later, and posts a green balance for the day. It looks simple, almost casual, and it leaves you asking why you shouldn't do the same thing tomorrow morning.
Day trading explained starts somewhere less exciting. Before any chart pattern matters, you've got a cost and capital problem. You need enough money in the right account, a way to keep one bad trade from damaging that account, and a result that still pays after fees, spreads, and your own time. Most beginners lose money, and pretending otherwise won't help you. What can help is understanding the order in which these pieces fit together, so you can decide whether day trading fits your situation at all before you risk a dollar on it.
Day Trading Defined and How It Differs From Other Styles
It's 9:30 in the morning and the opening bell rings. A trader watches a stock jump on heavy volume, buys it, sells it forty minutes later after a small move, and holds no position when the market closes. That round trip, opened and closed inside one session, is the whole definition.
Day trading means opening and closing a position within the same trading day, so you don't intentionally carry anything overnight. Your profit or loss comes from small intraday price moves, not from dividends or from owning a growing business over years. You aren't really investing in a company. You're renting its price movement for a few minutes or hours, and timing plus control do the work that patience does in longer styles.
Where day trading sits among the styles
Day trading sits between scalping, which is faster and more frantic, and swing trading, which lets you step away from the screen. The table below puts the four main styles side by side.
| Style | Typical holding period | Trades per day | Main analysis focus | Time needed per day |
|---|---|---|---|---|
| Scalping | seconds to a few minutes | dozens or more | order flow and very short moves | several hours, full attention |
| Day trading | minutes to hours, closed the same day | one to several | intraday price action and key levels | most of the session |
| Swing trading | two days to several weeks | rarely more than one | daily and 4-hour charts | 30 minutes to an hour |
| Position investing | months to years | rare | long-term trends and fundamentals | occasional review |
Notice what the table is really telling you. As the holding period shrinks, the time demand rises and the margin for distraction disappears. A position investor can check prices on Sunday. A day trader who looks away during a fast move can miss an exit entirely.
Reader check: If you can't give the market your full attention for the hours you plan to trade, day trading is the wrong style for right now, whatever your capital is.
That one question settles it for many people. If your job, family, or time zone makes focused screen time unrealistic, it's worth weighing day trading against swing trading before choosing. A slower style isn't settling. It's matching the method to the life you have.
Markets and Instruments Day Traders Actually Trade
Start with one test for every market. Can you get in and out quickly, near the quoted price? That quality is called liquidity, and it matters more than how exciting a market looks. A thin market can show a wonderful move on the chart that you'd never capture, because the gap between the buying and selling price eats it.
Five markets pass that test for most day traders. Each one changes your capital needs, your available buying power, and which costs hit you hardest.
| Instrument | Typical day trading use | Main risk |
|---|---|---|
| US stocks | liquid large caps with high intraday range | gaps and sudden moves in low-volume names |
| Index futures (e.g., E-mini S&P 500) | tight spreads and large contract size | high leverage per contract |
| Spot forex (major pairs) | constant liquidity across sessions | leverage and news-driven spikes |
| CFDs on indices and shares | many markets from one account | financing costs and wider spreads at times |
| Cryptocurrency | continuous trading and large daily ranges | extreme volatility and thin liquidity at times |
What each market asks of you
US stocks concentrate their volume around the opening hour, so liquid large caps give you fast fills early in the session. The trap is drifting into low-volume names, where one headline can jump the price past your stop. Index futures like the E-mini S&P 500 offer tight spreads and deep liquidity, but the contracts are large. One E-mini S&P 500 contract gains or loses $50 for every full index point, so a routine ten-point move is $500 on a single contract, in either direction.
Spot forex in major pairs runs through the Asian, London, and New York sessions, which suits traders outside US hours. The convenience hides a risk, because generous margin makes an oversized position feel affordable until a news release spikes the price. CFDs put indices and shares in one account, which is handy, though financing charges and spreads that widen outside peak hours raise your costs.
Cryptocurrency trades around the clock and moves a lot, which beginners read as opportunity. Large daily ranges cut both ways, and liquidity can thin out exactly when volatility peaks. It's the only market on this list that never gives you a closing bell to enforce a break.
Pick one market and one session, and stay there until its rhythm feels familiar. Each market has its own busy hours, typical ranges, and ways of misbehaving.
Switching markets every week resets that familiarity to zero. One market learned well beats five markets glanced at, especially while you're still building basic execution skills.
Pattern Day Trader Rules and Capital Requirements
In the United States, pattern day trader is a regulatory label, not a comment on your skill. The SEC day trading guidance describes the trigger under FINRA rules. A customer becomes a pattern day trader after making four or more day trades within five business days, provided those trades represent more than 6% of the customer's total trades in the same margin account and period.
Once that label applies, the account must hold at least $25,000 in equity, and that amount must remain in the account. You can't patch the requirement together from other accounts, because it applies separately to each day-trading account. Say you've got $18,000 in a margin account and $10,000 in a retirement account. Your total is $28,000, but your margin account still falls short, so the restriction still bites.
Buying power and the margin call
Qualifying accounts get buying power of up to four times the maintenance-margin excess calculated at the prior day's close for eligible equity securities. That sounds like an advantage until you flip it over. Borrowing magnifies losses exactly as it magnifies gains, and it does so on money that isn't yours.
Exceed your permitted buying power and the broker can issue a margin call and restrict your buying power. If that call remains unmet after five business days, the account is limited to cash-available trading for 90 days. That one mistake can end a beginner's season before any strategy gets a fair test.
| Situation | Rule | What it means |
|---|---|---|
| Four or more day trades in five business days | Day trades exceed 6 percent of trades in the same margin account | Account is classed as a pattern day trader |
| Pattern day trader account | Minimum $25,000 equity that must remain in the account | Balances in other accounts generally cannot be combined |
| Buying power for eligible equities | Up to four times the maintenance-margin excess at the prior close | Leverage magnifies losses as well as gains |
| Margin call not met within five business days | Account limited to cash-available trading | Restriction lasts 90 days |
| Account under $25,000 | Up to three day trades in any five business days | Plan trades around the limit |
Two habits follow from this. Know your account type before your first trade, and count your day trades every week rather than guessing. Readers outside the US face different thresholds, so check your own broker's rules instead of assuming these numbers travel.
Reading Price Action Without Indicators
Price action works like listening to the market's conversation directly rather than reading a summary of it afterward. A bare chart is a useful place to start, like the setup below.

A single candlestick records who won a tug of war during one time window. If price dipped and then closed near the top of the candle, leaving a long lower wick, buyers pushed back hard after sellers had their chance. That one shape shows you intent that a lagging average of the last twenty closes smooths away.
Levels and zones
Support and resistance are price zones where buying or selling has repeatedly shown up before. Treat them like shelves rather than lines, broad areas where price often reacts sharply instead of exact prices it must touch. Supply and demand zones apply the same idea over a wider area, marking where aggressive buying or selling previously overwhelmed the other side.
Three setups cover most of what a beginner needs to recognise:
- Bullish engulfing at support: A green candle fully covers the prior red candle on a strong support zone. That close is your trigger, a move below the zone is your invalidation, and the next resistance overhead is your target.
- Break and retest: Price pushes through a level, comes back to touch it from the other side, and holds. You enter on the hold, not on the first breakout, and a close back through the level says you're wrong.
- Rejection at resistance: Price reaches a known ceiling and prints a wick showing sellers defending it. The logic points down toward the middle of the recent range or the next support below.
Before any of these patterns earns your money, ask what it can realistically pay. Measure the room between your entry and your target, then subtract the spread and the slippage a fast move will cost you. A clean engulfing candle that offers only a narrow gap to the next resistance can be a correct read and still a losing trade after costs. Pattern recognition comes second, net return comes first.
The walkthrough below shows how these pieces look in live conditions.
When conditions argue against trading
A setup doesn't live in a vacuum. Trending, ranging, news-driven, illiquid, and crowded markets each change your spreads, your slippage, and how fast a pattern fails. According to Reuters reporting on retail investors, U.S. retail trading activity rose roughly 53% year over year in 2025, reached about 20 to 25% of total market activity, and touched approximately 35% in April.
Heavy participation cuts both ways. A volume surge can mean smooth fills, or it can mean crowded, emotional positioning that unwinds violently. Retail activity tends to cluster around volatile stretches, so the busiest tapes are often the hardest ones for a beginner to trade well.
Reduce size or stay flat after two failed setups in a row, during an unscheduled news release, or when the opening minutes whip back and forth with no follow-through.
Standing aside in those conditions is a cost decision. You spend your risk budget on conditions that fit the setup, and you keep it when they don't.
Risk Limits and Position Sizing That Protect Your Account
Survival comes first, and position sizing is where survival gets decided. The standard starting point is the 1 percent rule. You risk no more than 1 percent of your account equity on any single trade. At that rate, even twenty consecutive losses cost you roughly a fifth of the account, painful but recoverable, instead of ending the account outright.
The formula itself is simple enough to do on paper. Position size equals your risk amount divided by the distance from entry to stop. Say you've got a $10,000 account. One percent is $100, and if your stop sits $0.50 below your entry, you buy 200 shares. Every part of that sentence is decided before you click anything.
| Account size | Risk at 1% | Risk at 2% | Shares at 1% risk, $0.50 stop |
|---|---|---|---|
| $5,000 | $50 | $100 | 100 shares |
| $10,000 | $100 | $200 | 200 shares |
| $25,000 | $250 | $500 | 500 shares |
| $50,000 | $500 | $1,000 | 1,000 shares |
Where the stop goes
Your stop belongs beyond the level that proves the setup wrong, not at whatever dollar amount feels comfortable. If you buy a bounce off a support shelf, the idea dies when price closes through that shelf, so the stop sits just beyond it. Once the stop distance is honest, the formula hands you a share count, and you accept that count even when it feels small.
Working the other way round causes most of the damage beginners report. Choosing 500 shares because it sounds meaningful, then squeezing the stop in tight so the loss looks tolerable, means ordinary noise pushes you out. You end up right about direction and still lose money, which is a frustrating way to learn that size follows risk, never the reverse. You can practise the arithmetic with a step by step position sizing walkthrough until it becomes automatic.
The daily limit and reward to risk
A per-trade limit still allows a bad day to stack up, so add a daily loss limit of about 2 to 3 percent of equity. Hit it and you stop for the day, no exceptions and no final trade to win it back. On the $10,000 example, that's $200 to $300, roughly two or three full-size losses, after which the screen goes dark.
Finally, check whether your targets justify your risks. At a 1 to 2 reward to risk ratio, where you aim to make twice what you stand to lose, a win rate around 34 percent breaks even before costs. That number surprises people who think they need to win most of the time. Run the same calculation on your own trade log, using your real wins and losses, and you'll see your actual expectancy per trade.
Non-negotiable: Never increase size to recover a loss. The trade after a loss gets the same 1 percent calculation as every other trade, or smaller.
That single rule separates a drawdown from a blown account. Losses are a cost of doing business. Doubling down to erase one is how a cost becomes a catastrophe.
A Typical Day Trader Routine From Open to Close
A working day breaks into five phases, and the flow below keeps them in order.
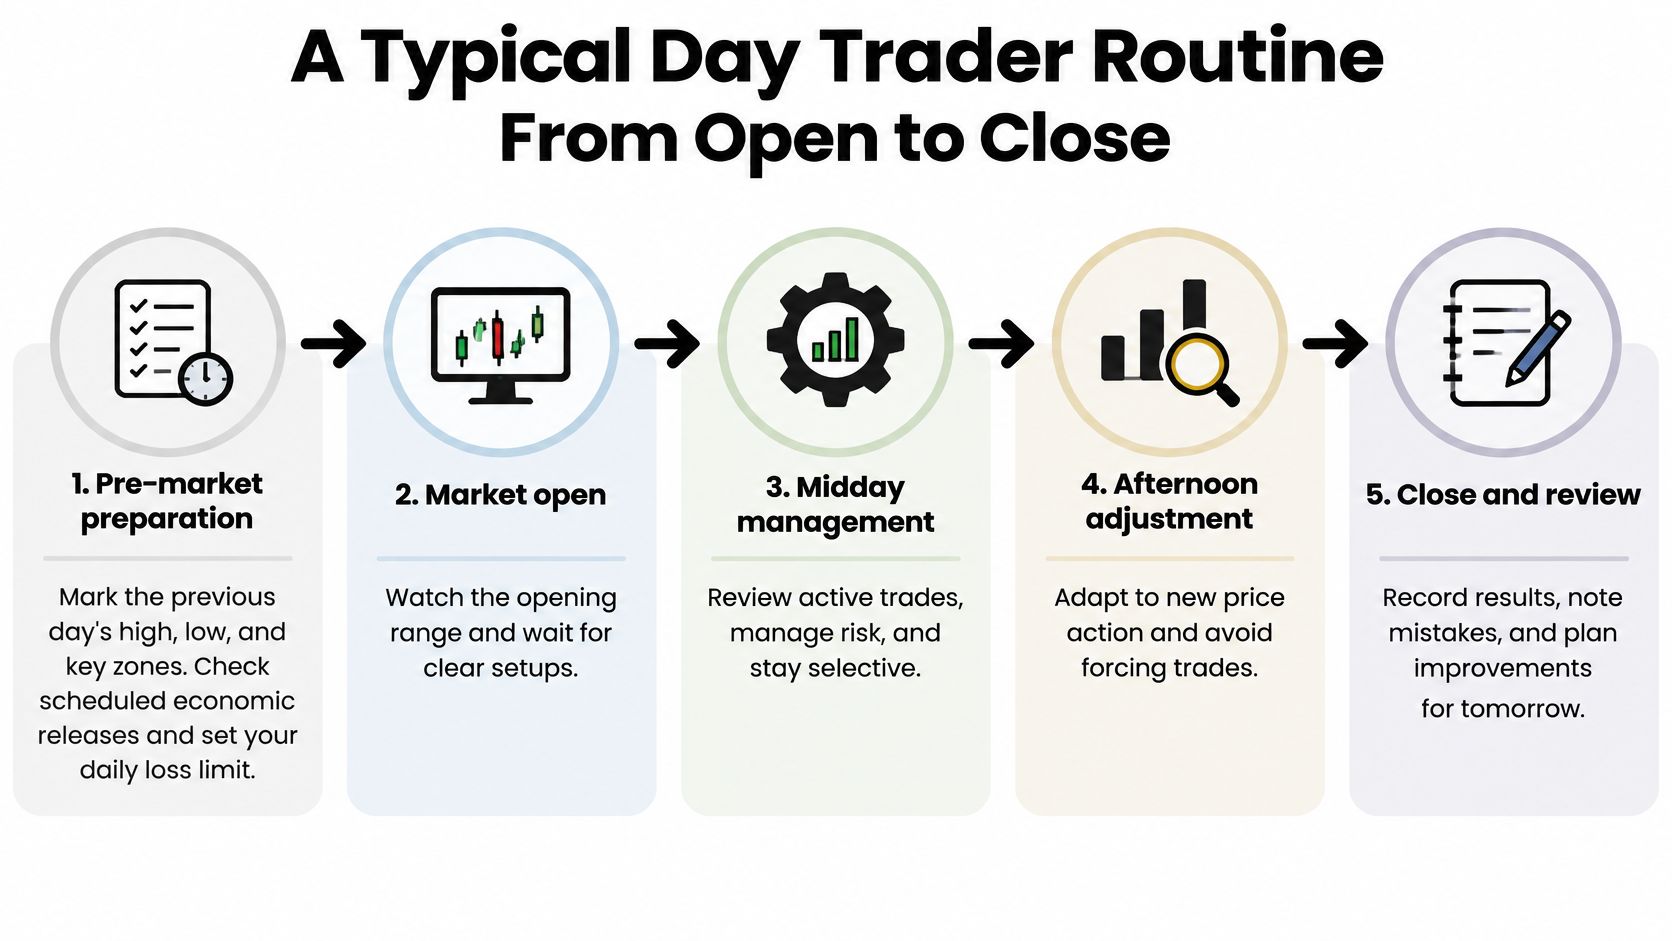
- Pre-market preparation: Mark the previous day's high, low, and key zones on your chart. Check scheduled economic releases and write down your daily loss limit before the open.
- Opening range: Watch the first 15 to 30 minutes without trading. The open brings the widest spreads and the fastest false moves of the day.
- Execution: Take only setups that match your written plan. Each one carries a predefined stop, target, and size calculated from your risk limit.
- Midday management: Step back as volume fades and cut activity after a losing streak. Once the daily limit is hit, you stop, so revenge trades never get started.
- Close and review: Log every trade with entry, exit, reason, and outcome. Mark whether the plan was followed, because that distinction matters more than the profit column.
For a beginner, this is usually two to three hours of focused work, not a full day glued to the screen. The review is where the routine pays off. Separating plan-following trades from plan-breaking ones shows whether your results come from repeatable skill or from luck, and what you find shapes tomorrow's pre-market preparation.
Whether Day Trading Makes Money After Costs
Here's the gap nobody posts screenshots of. You can win individual trades, feel skilled, and still lose money once commissions, spreads, and slippage take their cut from every round trip. Gross profit is the number before those costs. Net profit is what's left, and it's the only number that pays rent.
The visual below separates those two results.
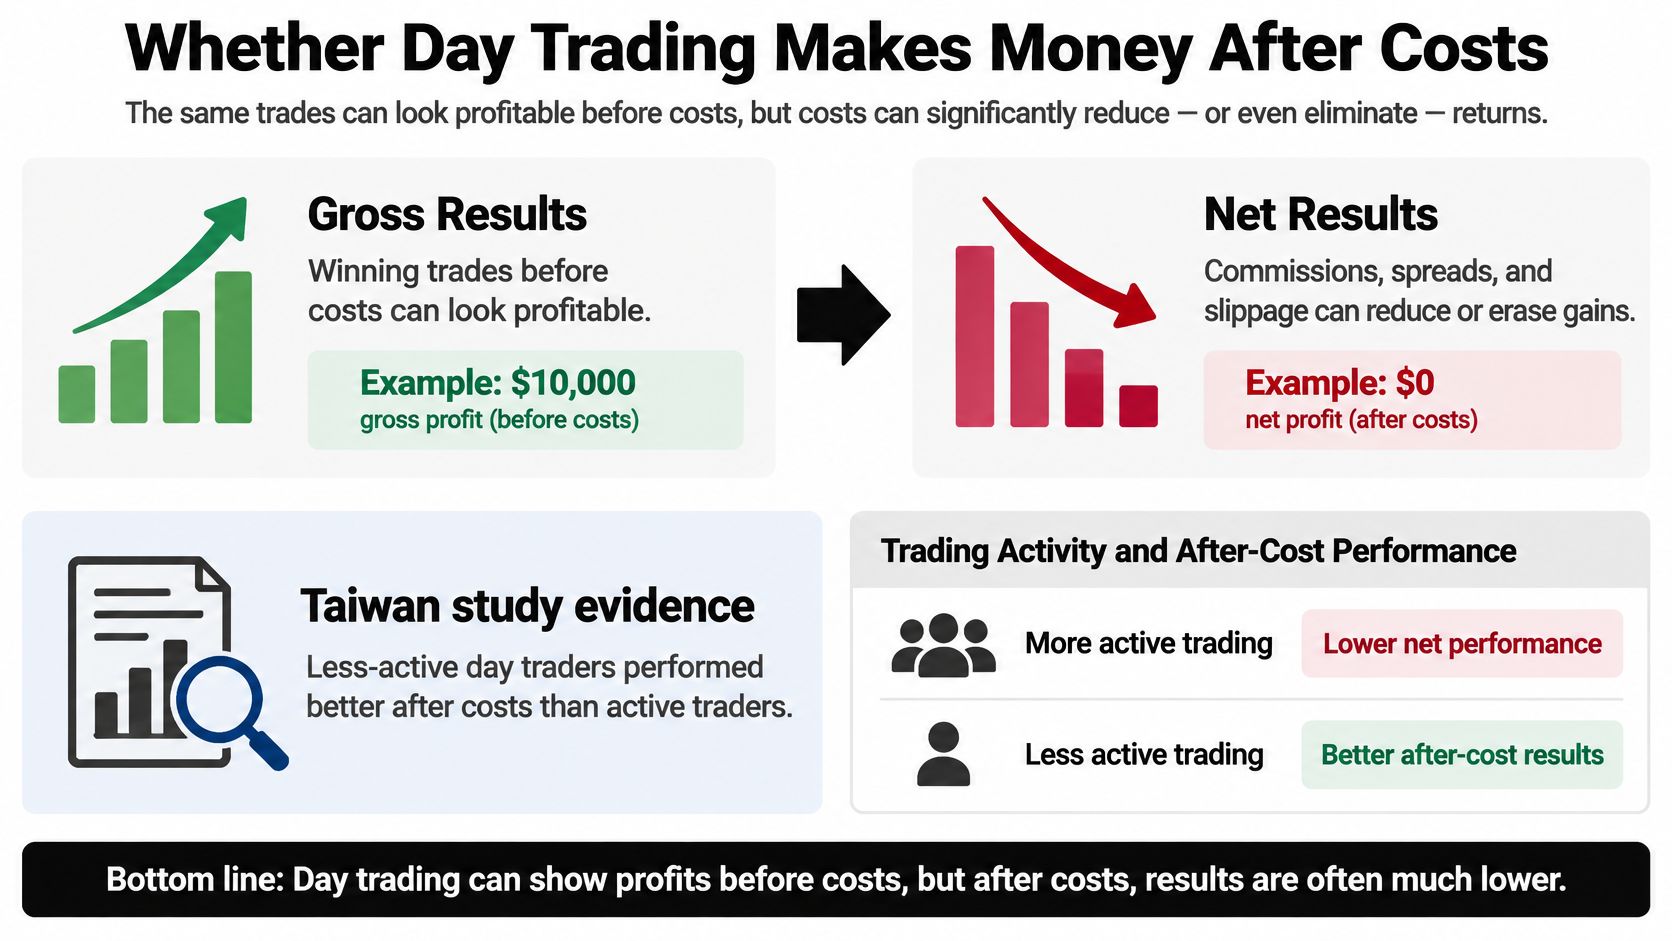
Account-level research on individual day traders shows how sharp that gap can get. The heaviest traders in one large study were skilled enough to generate gross profits before transaction costs, yet their accounts lost money on average after costs were applied, and less-active day traders showed negative gross returns even before paying a single fee. A small subset did outperform the typical participant. Possible and likely are different words.
Run your own viability test
List every cost before you judge a single strategy:
- Trading costs: Commissions per trade, the bid-ask spread on each entry and exit, and slippage when fast markets fill you worse than quoted.
- Running costs: Platform and data fees, plus financing charges on positions held with borrowed funds.
- Tax: Short-term gains often face heavier treatment than holdings kept longer, which raises the gross return you must clear.
- Your time: A focused session has a value. If those hours would otherwise earn you a wage, your trading must beat that figure too.
Now do the arithmetic in advance. Say a $10,000 account needs $300 net per month to justify your effort, and your fees run $120 monthly. Your trades must earn $420 gross just to stand where you intended, before tax and before valuing your hours. That target then gets divided by your expected trades, which tells you the minimum edge each setup must deliver after every cost. Compare that requirement with what your trade log produces once costs are subtracted, not what it shows in the gross column.
The central question isn't "what strategy works?" It's "what minimum net performance must I achieve to justify this activity at all?"
Chart reading answers the first question. Only your account's arithmetic answers the second, and it answers first. If that number looks unrealistic for your account size, the honest conclusion may be not to trade it. Walking away from a bad equation is a decision, and often the most profitable one available to a beginner.
Choose Your First Learning Step Before Trading Live
You don't need everything at once. You need a sequence, and four steps in the right order will take you further than months of random practice.
- Learn the mechanics on demo first: Work through market basics and the pattern day trader rules with practice money. Learning how to paper trade properly means treating fake funds with real discipline, including realistic position sizes.
- Master one price action method: Take candle and zone reading and apply it to one market in one session. Depth on a single setup beats shallow knowledge of ten.
- Build the routine and the log: Write your plan, run the five-phase day, and record every trade. Your log becomes the evidence for every later decision.
- Go live small, late: Trade real money only after a sustained run of sessions where you followed the plan. Consistency of behaviour comes before consistency of profit.
Structured courses are one route through those steps, and our own programmes map onto them. The BASIC section includes Chart Patterns, Smart Money, and Time Trading as foundations. The Price Action Method teaches trading with Price Action using naked charts, and The Ultimate Supply and Demand Course teaches the fundamentals of Supply and Demand Trading. The Day Trading Programme is a full-length programme that teaches day trading and is open only to colibritrader.com subscribers. Compare any option against your budget and goals before paying for anything.
The founder's advice is to plan your trades and trade your plan. So here's your action for this week. Pick one market, one method, and write your first week's plan with a loss limit in it, all before opening any live position.
Day trading rewards preparation far more than enthusiasm, and we built our price action programmes to teach exactly that order of work, from reading naked charts to sizing positions you can survive. Whether you start with foundational lessons or aim for structured day trading training, you'll find a clear next step at Colibri Trader. Visit today, choose the programme that matches your current step, and write your first plan before your first live trade.